CHAPTER 22
Daily, Weekly, and Monthly Charts
Although daily, weekly, and monthly charts can generate intraday signals, they occur so infrequently that they become a distraction for a day trader and should be ignored. The most common signals are those based on yesterday's high and low, and you can see them on a 5 minute chart. However, there are frequently price action entries on these longer time frames, but because the signal bars are so large, far fewer contracts can be traded if the risk is to be the same as for a day trade. Also, overnight risk may mean that you should reduce your contracts even further or consider trading option strategies that have a limited risk, like outright purchases or spreads. A day trader should trade these charts only if they do not occupy his thoughts during the trading day, because it is easy to miss a few day trades using large volume while nursing a trade of far fewer contracts or shares based on the daily chart, and these misses can more than offset any gain from the daily signal.
Although all stocks form standard price action patterns, stocks of very small companies that have little institutional ownership have a significant risk of unusually big moves up and down. They tend to be more volatile, and in stock market terminology, these stocks are called high-beta stocks. For example, you would not expect Wal-Mart (WMT) to jump 1,000 percent in a month, but when a small drug company gets its one drug approved by the Food and Drug Administration (FDA) or is suddenly a takeover candidate, this is exactly what can happen. Some traders like the huge, fast moves, but most traders prefer to avoid the risk of sudden, huge moves in both directions and bad fills on their trades. Traders who trade these special situations have to watch the stocks very closely, which makes it difficult for them to trade other stocks at the same time. Since the risk is so great, they can only trade a small portion of their portfolio this way and this erases most of the gain derived from the big moves. When you add the stress of the unpredictability, most traders should not bother with these stocks.
When trading counter to a strong trend, the goal should be a scalp of 1 or 2 percent, since most countertrend trades just result in pullbacks that become with-trend entries. Gaps complicate the entries and, in general, the risk is less if the market opens within yesterday's range and then trades through the entry stop at one tick beyond that range. If you cannot watch the stock intraday and there is a gap open, it is probably best to pass on the trade. If you can watch the stock and there is a gap opening, watch for a gap pullback and then enter on the failed pullback into the gap, as the market resumes its move away from yesterday's range. In other words, if you were looking to buy but today gapped up, look for a sell-off on the open today and then buy an opening reversal back up, placing your protective stop below the low of today. If the entry fails and your stop is hit, look elsewhere or give it only one more try if there is a second buy setup. Don't spend too much time on a stock that is not doing what you wanted it to do, because you will lose money. There is a natural tendency to want to make back your money on the same stock after a loss, but this is a sign of your emotional weakness. If you feel a need to prove that you were right and are in fact a great chart reader, you might be right about that, but you are not a great trader. Great traders accept their losses and move on.
Pullbacks on daily charts rarely have classic reversal bars, leaving traders with more uncertainty than when trading 5 minute charts. Uncertainty means risk, and when there is more risk, position sizes need to be smaller, and a trader will have to consider taking a partial position and adding to the position as the price action unfolds. In a bull pullback, additions can be made at a lower price if the market sells off a little more, but the bears have not yet demonstrated that they are in control. Additions can also be made at a higher price after the trend has resumed and a small pullback forms a higher low above your original entry.
When you scan your daily charts at the end of the day, you will frequently see setups to consider for the next day. Once the setup triggers, there will often be an intraday trend that will provide you with many good 5 minute with-trend entries. If the stock is not one that you normally trade intraday but its volume is about five million shares or more, it is worth considering adding it to your basket of day trading stocks for a day or two. Sometimes, however, even with very liquid stocks such as the Oil Service HOLDRS (OIH), your broker might not have an inventory available for selling short, and you might only be able to trade buy setups. If you really want to short, you can buy puts instead, even for a day trade.
Since round numbers are magnets, they can set up trades. For example, if Freeport-McMoRan (FCX) is up 20 percent over the past few months and is now trading at 93, many traders will assume that it will reach 100. Because of this, bears will not short aggressively, because they believe that they soon will be able to short at a better price, and bulls will buy aggressively because they believe that FCX will go above the magnet. This absence of bears creates a vacuum effect that often results in the stock quickly moving up to the magnet. It will typically go 5 to 10 percent above the magnet before it pulls back, and it usually pulls back below the round number at least once before it decides what it will do next. Bulls can buy as it rallies into the magnetic field of the round number and take profits just above it, and bears can wait to short until the market is above and then take profits on the test back down. Bulls will usually buy again there for a scalp.
FIGURE 22.1 Price Action Has Not Changed over Time
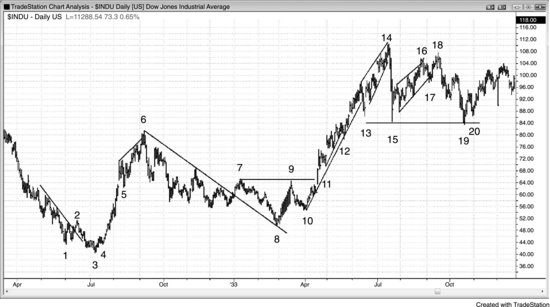
Price action is the cumulative result of a large number of traders acting independently for countless reasons to make as much money as they can. Because of that, its fingerprint has remained unchanged and will always provide a reliable tool for making money for those who can read it. Figure 22.1 is a daily chart of the Dow Jones Industrial Average in 1932 and 1933, and it looks like any stock trading today on any time frame.
Bar 2 was a low 2 that broke a trend line.
Bar 3 was a small final flag reversal and a lower low test of the bar 1 low after a trend line break (a trend line break and then a test can be a major trend reversal).
Bar 4 was a breakout pullback and a small higher low.
Bar 5 was the first pullback in a strong bull spike and a high 2.
Bar 6 was a wedge channel after the bull spike and led to two large legs down, ending at bar 8.
Bar 7 was a trend line break and a two-legged pullback. It was the breakout of a large wedge bull flag that had its first push down at bar 5.
Bar 8 was a lower low major trend reversal and breakout pullback, a larger wedge bull flag, and a breakout test of bar 2.
Bar 10 was a higher low and a pullback from the bar 9 breakout above the bear channel from bar 7 to bar 8. A bear channel is a bull flag.
Bar 11 was a small high 2 breakout pullback after the breakout above the failed bars 7 and 9 double top bear flag.
Bars 12 and 13 were reversals up after minor trend line breaks.
Bar 14 was a wedge and a small final flag reversal.
Bar 15 was a strong-momentum countertrend move that would likely be tested after a rally tested the bar 14 high. It formed a double bottom bull flag with bar 13, but it was strong enough down so that the market might have flipped to always-in short. Traders would have looked to short a lower high and would not have looked to buy here if the long would have made it more difficult for them to get short on the lower high. Sometimes when traders scalp a long when they are looking to short a lower high, they cannot change their mind-set to short as the short is setting up.
Bar 16 was a wedge lower high, and bar 17 was a failed breakout of the wedge.
Bar 18 was the lower high test of the bar 14 bull trend extreme and was a low 2 entry for a short on the wedge higher high breakout pullback. There was a failed breakout below the wedge, and the rally to bar 18 was a higher high breakout pullback from the wedge. Other traders saw it as simply a better wedge than the one that ended at bar 16. Bar 18 was also a breakout test of the bar 14 signal bar low.
Bar 19 was the test of the bar 15 low and was a double bottom bull flag.
Bar 20 was a higher low pullback in the reversal up.
FIGURE 22.2 Gap Pullbacks
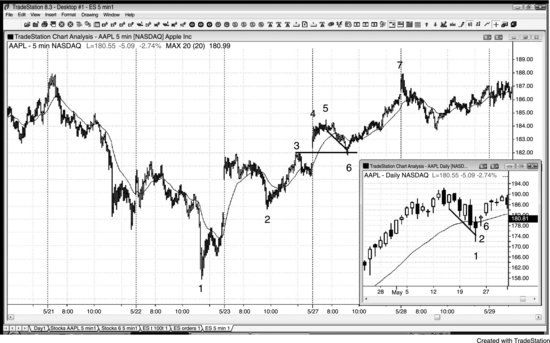
As shown in Figure 22.2, when there is a buy setup on the daily chart and the market gaps above yesterday's high, traders will often wait to buy a pullback on the 5 minute chart. AAPL was in a strong bull trend on the daily chart (thumbnail) and had a first moving average pullback at bar 1, which was a bear trend channel overshoot (the numbering is the same on both charts). Bar 2 on the daily chart had a strong intraday reversal up and closed near its high. It was reasonable to want to buy at one tick above the high of bar 2 on the daily chart, which was the high of bar 3 on the 5 minute chart. However, the next day gapped above the day 2 high. Rather than risk a possible reversal down day, it would have been prudent to watch for a reversal up after a pullback test of the gap on the 5 minute chart.
Bar 6 on the 5 minute chart closed the gap and was a moving average gap bar and a bear trend channel overshoot and reversal up. This was a great long entry with a protective stop below bar 6. This 62 cent risk led to a several-dollar gain.
FIGURE 22.3 The Weekly SPY
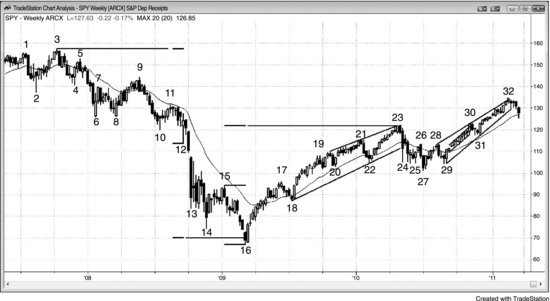
As shown in Figure 22.3, the weekly chart of the SPY looks like it is in a bear rally because the move up from bar 16 to bar 32 has a shallower slope than the sell-off down to bar 16. Also, the market is not holding above the resistance created by the lows of bars 6, 8, and 10 at the bottom of the upper trading range. However, the rally has retraced so much of the bear trend down to bar 16 that the bear trend does not have much influence left, and the market has therefore become a large trading range. If it is a bear rally, then it should eventually test the bar 16 low. The bulls want the market to continue to go above the swing highs in the bear trend down from bar 3 and eventually to break out to a new all-time high. The bears want the market to fail in an expanding triangle formed by bars 21, 22, 23, 27, and 32, and then break below the bar 27 bottom of the triangle and subsequently to a new bear low below bar 16. Since the rally has been so big, the chart has become more of a large trading range and it has lost the certainty that comes from a trend. Uncertainty is the hallmark of a trading range; once a market appears uncertain, it is usually in a trading range, as is the case here.
On the move down from bar 3, the market began forming lower highs at bars 5, 9, and 11 and lower lows at bars 6, 8, 10, and 12. Since there was yet to be a strong bear breakout, the odds favored this sell-off as being a test of the bottom of the trading range or a possible large bull flag. Some traders believed that the bear spike down to bar 6 might have turned the market to always-in short, but the bear spike down to bar 13 flipped the always-in position to short for any traders who were still in doubt.
Bar 14 was the third bar of a second sell climax and an attempt at a two-bar reversal from a final flag, but the market fell once again in a spike and climax bear down from bar 15. This was the third sell climax and a wedge bottom (bars 13, 14, and 16). The bottom was just past the measured move target based on the height of the upper trading range.
The move up to bar 17 had 12 bull bodies, small tails, and only a couple of bull bodies and was strong enough to be considered a spike by most traders. After the three sell climaxes at the bar 16 low and this spike up, traders thought that there should be at least a second leg up and possibly a measured move up based on the bar 16 low and the top of the bar 15 or bar 17 high.
Bar 23 was just slightly above the measured move target and the top of the trend channel line, and it was a two-bar reversal down in the area of the bars 6, 8, and 10 bottom of the upper trading range. The first target was a break below the channel, which occurred at bar 24. A second leg down ended at the bar 27 two-bar reversal. Bar 29 formed a higher low breakout pullback after the bar 28 breakout of the two-legged bull flag down from bar 23. It was also the right shoulder of a head and shoulders bottom bull flag where the left shoulder formed between bar 24 and bar 25. The trading range between bar 21 and bar 28 was also a head and shoulders top, where bar 21 was the left shoulder, bar 23 was the head, and the bars 26 and 28 double top was the right shoulder. As happens in 80 percent of topping patterns, the market broke to the upside and the bears learned once again that most tops are just bull flags.
The move from bar 29 to bar 32 was in a fairly tight bull channel and could easily be followed by higher prices. However, since the entire chart is a large trading range, big rallies are usually followed by big sell-offs, and the market might soon begin to correct down to the bar 27 bottom of the expanding triangle, or even to the area of the bar 16 bear low.
Bar 16 was a measured move down. Most institutions take trades that they believe will work, which means that the probability is at least 60 percent. They therefore need at least a measured move to have a positive trader's equation (the measured move is where the reward becomes as large as the risk, and the trader's equation begins to become reasonably profitable). The result is that trades often hit a target exactly and then reverse or at least pause, because many firms will take partial or full profits there. Most targets, like all support and resistance, soon fail, because the measured move is the minimum needed, and many firms will feel that the market is strong enough to go well beyond.
FIGURE 22.4 Monthly Gold Wedge Channel
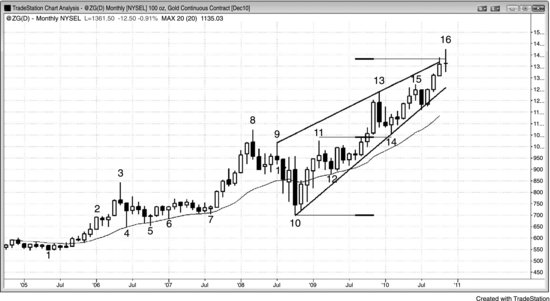
As shown in Figure 22.4, the monthly gold chart is in a wedge channel after the bull spike from bar 7 to bar 8. Some traders will see the current move as the third push up where bars 11 and 13 were the first two pushes. Others see bar 8 or 9 as the first push.
Whenever five to 10 bars are close to a trend line, the odds are good that the market will soon fall below the trend line. This makes the bull trend line up from bar 10 vulnerable to a downside breakout. Since the market is just above the trend channel line and the measured move target, the odds favor a two-legged sell-off starting very soon. At a minimum, the market should correct to just below the bar 8 high, and it might correct to the bar 10 bottom of the wedge. Less likely, there will be an upside breakout of the wedge top and a measured move up.
FIGURE 22.5 Monthly Dollar Index Futures
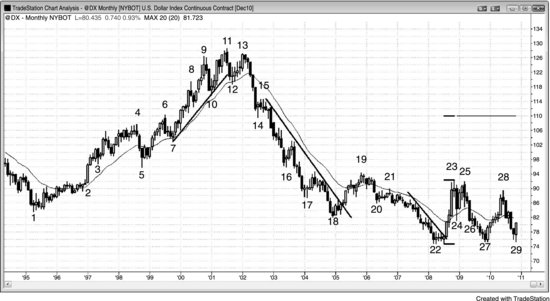
As shown in Figure 22.5, the monthly dollar futures had several trades that qualify as best trades. The dollar, along with the Swiss franc and Japanese yen, are risk-off currencies, and traders tend to buy them when they think that the stock market will fall.
The dollar had a bull spike up as it broke above the top of the bear flag at bar 2, converting the market to always-in long. It then formed a channel, followed by the bar 5 test of the bottom of the bar 3 start of the channel. This created a double bottom bull flag at bar 5 and was followed by a breakout pullback buy setup at bar 7. The market topped out at the bar 11 higher high. Some traders saw the move from bar 3 to bar 11 as a broad channel, and others saw the channel as starting at bars 5 or 7. All traders suspected that bar 11 or bar 13 could be the start of the correction down to the bottom of the channel, because the market was becoming two-sided with several reversals and prominent bear bodies. These represented accumulating selling pressure.
The move down to bar 10 was a strong bear trend bar, and it broke below a steep bull trend line up from bar 7 (not shown). This was a strong enough move to make many bulls take profits on the rally to the new high at bar 11. Bears started shorting at that higher high and even more aggressively at the bar 13 lower high major trend reversal. The move down to bar 12 had two strong bear trend bars and broke below the bull trend line. The market should have had at least two legs down, but instead it had a bear spike down to bar 14 and then a channel down to bar 18. The move down to bar 14 convinced most traders that the market had flipped to always-in short and therefore should be followed by more selling.
The bear channel continued down to bar 18, which was the fifth bar in a sell climax at the end of a big bear trend. Traders expected a rally, at least to the moving average. It was also a double bottom with bar 1.
There was a 20 gap bar short at the moving average, but since the spike up was strong, it was better to wait for a second signal. The second signal came with the bar 19 moving average gap bar, which formed a double top bear flag with the high of the small rally after bar 17.
The spike down to bar 20 was followed by a parabolic and therefore climactic channel down to bar 22, where the market formed a lower low major trend reversal. There, the market went sideways in a variation of an iii pattern (bodies only). It had a failed low 1 short that reversed up in a small double bottom, and the bull spike up to bar 23 was exceptionally strong. This probably flipped the market to always-in long and would have made the bulls try to keep the market above the bottom of the spike. They bought aggressively near the low and they also did at bars 27 and 29, creating a double bottom bull flag. Bar 27 was a double bottom major trend reversal, and bar 29 was a reversal up from the third push down in a triangle, which could ultimately have a breakout up or down.
The wedge bull flag (bars 24, 26, 27) was followed by another rally and then a double bottom at bar 29. This was a good risk/reward setup for a long, since a trader would be buying at the bottom of a trading range. The probability of an equidistant move up was probably 60 percent, since the market was at the bottom of a trading range. The risk was about $5.00 with a 60 percent chance of a test of the bar 28 top of the trading range. A trader would be risking $5.00 to make $10.00 with a probability of 60 percent, which is very good. The average profit per trade would be about $4.00. Since this was also a double bottom bull flag, the odds were probably better than 60 percent. The target would be a measured move up out of this trading range, and it would test to around the bar 15 top of the bear channel.
It is important to realize that this means that there was about a 40 percent chance that the market would fall below the bar 22 low, so traders would need to exit if that happened. If it did, the next target would be a measured move down, based on the height of the bar 27 to 28 or bar 22 to 23 legs down.
Even if the market does go up, the odds favor that it will stall around the bar 11 high and form a larger trading range.
FIGURE 22.6 Round Numbers Can Be Support and Resistance
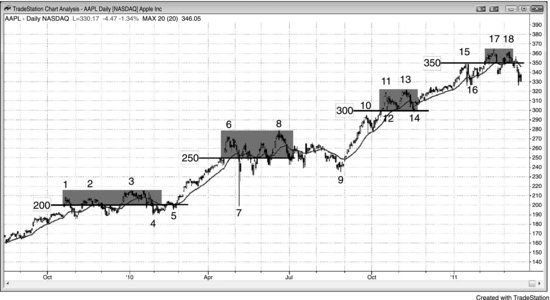
As shown in Figure 22.6, this daily chart illustrates how AAPL, which was in a strong bull trend, stalled below significant round numbers, which are often magnets that draw the market to them. Once enough traders became convinced that the magnet would be reached, the bears stopped shorting, and the market rallied in a buy vacuum to above the target. For example, the bears believed that the market would get above $300 and probably at least 5 to 10 percent above, because that is what the market usually does once it is in the magnetic pull of a round number. Since the bears expected the market to reach around $315 (5 percent above the round number), they stepped aside. It did not make sense for them to short before the market got there when they believed that the market would be higher within a few bars. Their absence caused the market to go up quickly, since the bulls had to push the market up higher to find enough traders to take the opposite side of their longs.
Once the market gets 5 to 10 percent above the target, bulls begin to take profits and bears begin to short for a test back down to the round number, which usually gets penetrated at least once. The pullback to the bar 12 low missed $300 by a penny (the bar 12 low was $300.01) and the market rallied sharply into the close of that day. Double top shorts around bar 13 succeeded in driving AAPL below $300, but the buyers came back and formed the bar 14 double bottom.
FIGURE 22.7 The Daily and Monthly Charts Can Be in Opposite Trends
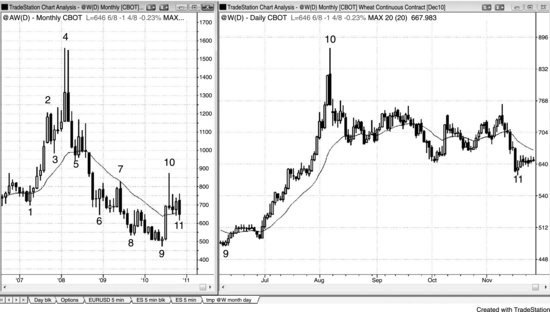
As shown in Figure 22.7, wheat had a sharp rally on the daily chart on the right, but it was just a bear market rally on the monthly chart on the left, where bar 10 formed a moving average gap bar in the bear trend, a double top bear flag with bar 7, and a breakout test of the bars 3 and 5 bottom of the upper trading range (a head and shoulders top). The numbering is the same for both charts.
On the day before the bar 10 bear reversal bar formed on the daily chart, a television pundit said that wheat was going much higher and that he was buying it at the market and on pullbacks. When a trend forms large bull trend bars after a long bull spike (10 to 20 bars), there is a great risk of a protracted two-legged pullback because most strong bulls would only buy a significant pullback and most strong bears would short at the market and scale in higher. The television pundit might ultimately be right about wheat going a lot higher, but he was tying up too much of his capital by buying at the top of a parabolic spike and climax. Instead, he should have been doing what the institutions were doing. The bears were shorting and the bulls were waiting for a two-legged pullback before buying.
On the day before bar 10, the news was obviously very bullish for wheat, but that is irrelevant. The chart told traders that strong bears and bulls were expecting a large correction. The spike and parabolic climax told traders that the weak bulls and bears were doing the wrong thing and that the strong bulls and bears were betting on the pullback. The best way to make money trading is by doing what the smart money is doing and not listening to experts on television. The smart money is so huge that those smart traders cannot hide what they are doing. However, you must be able to read the chart to understand what is going on.
FIGURE 22.8 News Can Move a Stock
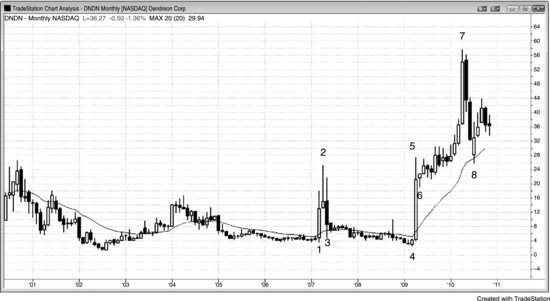
As shown in Figure 22.8, Dendreon Corporation (DNDN) had sharp moves up and down due to news releases about its prostate cancer drug. It jumped 800 percent in the two months that ended at bar 2 and gave back 90 percent of that gain over the next couple of months. It then jumped 2,000 percent up to bar 7 and then fell 50 percent in the next three months. With the risk of huge moves up and down, traders can only trade small volume, and this reduced position size offsets any gain that they would get from the large swings. When you add the stress due to the unpredictability, it is almost impossible for most traders to trade anything else when they are in a market like this, and it is likely that they would make more money by avoiding these special situations. They are fun to watch, but your goal is to make a lot of money, not to get an emotional rush or a meaningless sense of power after making a little money from a small position after a rare big move.