CHAPTER 23
Options
I once talked with a woman trader who was a small business owner and managed a stock portfolio for herself and her husband. One day, she awoke to find her portfolio was down $500,000 since the day before. On that day she became a day trader, deciding to never again carry trades home overnight. She was a good chart reader, but was no longer willing to have any overnight exposure that could result in a huge loss. As an alternative, she could have switched to option trading for trades that she wanted to hold for several days to several weeks. She was a strong trader and could have continued to trade a substantial part of her portfolio with options instead of restricting herself to day trading. I haven't talked with her in years, but I am confident that she is doing well whether or not she strictly day trades, but she might be doing better if she incorporated options into her strategies.
Because the bid-ask spread is often wide for options, traders should usually only consider option trades on higher time frame charts. Any setup with a significantly positive trader's equation is reasonable. Here are some examples of situations when traders should can consider call or put purchases based on 60 minute or daily charts:
- Buying calls on a pullback to the moving average in a bull trend.
- Buying puts on a rally to the moving average in a bear trend.
- Buying calls at the bottom of a trading range.
- Buying puts at the top of a trading range.
- Buying calls at a new low in a bear stairs pattern.
- Buying puts at a new high in a bull stairs pattern.
- Buying calls during a bull spike in a strong bull breakout.
- Buying puts during a bear spike in a strong bear breakout.
- Buying calls below a weak low 1 or low 2 at the bottom of a trading range.
- Buying puts above a weak high 1 or high 2 at the top of a trading range.
You can also trade options based on a smaller time frame like a 5 minute chart:
- If you are a new trader and your account is limited or you want to be certain of your risk, you can buy SPY puts or calls instead of trading the SPY or Emini. The bid-ask spread is usually just one tick for the front month, at-the-money (ATM) options on the SPY, and many big cap stocks. This allows traders to place trades on the 5 minute chart and still have a favorable trader's equation.
- On rare occasions when the intraday price movement is so huge that you are unwilling to trust your quotes or your fills on the underlying (like the Emini, stocks, bonds, currencies, or whatever market you are trading), then you can buy puts and calls with limit orders for day trades based on 5 minute charts.
There are many other situations in which trading options is worthwhile, and there are many other useful option strategies, but the aforementioned are the easiest for a day trader and the least distracting. If traders are able to handle other types of option trading, they should trade them, but most active day traders cannot take those trades without interfering with their day trading earning potential. Risk reversals, cashless collars, and ratio spreads in general offer excellent trader's equations, but are probably too distracting for a day trader. The orders are relatively complicated to place and they require a lot of concentration to do them correctly. You have many strike prices and expirations to consider; the bid-ask spreads are often wide and therefore the trades feel a little expensive; and, you should use limit orders, but they often do not get filled quickly. You then have to manage the trades and often will want to make adjustments as the trades evolve. Forex traders will hedge their stock portfolios with currency trades, when they think that the stock market will fall, by buying risk-off currencies like the Swiss franc or the U.S. dollar and shorting risk-on currencies like the Swedish krona to get the same hedge. This avoids the cost of options, but requires a comfort with the foreign exchange (forex) market, where a lot of action takes place overnight. All of this is very distracting for a day trader, and most choose either to focus on day trading or to add only simple put or call purchases to their trading.
It is easiest to mostly buy puts or calls and sometimes spreads and look to hold the trades for one to several days. You can consider allowing one new extreme against your position, and you can be willing to add on because your risk is exactly known and limited with these strategies. At a possible major trend reversal top, you could also simply sell short a small stock position, but you might tend to watch it too much during the day, and this would cause you to miss day trades and ultimately negate any gains from the stock trade.
Options contain a time value that melts away every day, reducing the value of your put or call. If you buy a spread, you lose on the bid and on the ask on both strikes, both when you enter and when you exit the spread, and you have double the commissions. Because of these costs, traders have to restrict themselves to trading only the very best option setups. Also, they should add options to their day trading only if it truly results in an increase in their bottom line, which will not be the case for most traders. Trading anything profitably is difficult for all traders, and most profitable traders usually choose to focus on either options, futures, or stocks and not divide their attention among all three. However, be aware that options traders consider stock positions an integral component of their trading, and most hold their positions for days to weeks and not minutes to hours, like day traders.
There is one other rare occasion in which intraday options can be preferable to futures and stocks. That is when the market is in a huge free fall and it is close to limit down. If a reliable reversal pattern sets up, you might think that the risk of buying the Emini is small, even on a small position, but it can be substantial even with a reputable broker. How can that be? Because the system can get overloaded and your orders might not get processed or reported back to you for 30 minutes or more. If you just bought what you thought was a bottom and then the market fell through your protective stop, you might still see your stop order on your computer screen as a working, unfilled order, even though the market has fallen well below it. So what do you do? You don't know if the order got filled, and when you call your broker to find out, you are on hold for 30 minutes. Then after about 30 minutes, your computer screen will show that your order got filled with some slippage when it was supposed to have been filled. You cannot afford to live with this kind of uncertainty for such a long time on a huge bear day when your broker's order systems are not working correctly. You could easily lose 10 points in the Emini since the broker is never responsible for your order getting filled. An alternative is to buy calls, so that you will be certain of your risk if the market goes into a free fall after you are in the market. You could try to limit any potential loss with a stop on your call, but even if the market falls far below your stop without it being filled, at least you know that your risk is not catastrophic even if the stop order was never processed (assuming that your position size was reasonable). How can the market fall through your protective stop and not trigger it? The stop is based on the last trade, and if no trades took place in your particular option, the bid and ask might fall too far below your stop, but your stop would not get filled and your option would be worth much less than you thought. It is important to understand that protective stops in options often offer no protection, and if the market is moving quickly against you, you should try to exit on a limit order as soon as you can.
You can also consider day trading SPY options instead of the SPY or the Emini, especially when you are starting out and if you are afraid of a huge loss. For example, if you buy a one-month-out, at-the-money (ATM) call in the SPY, it might cost about $250, which is the most that you could lose even if the SPY falls to zero (obviously this assumes that you bought the call and did not make a mistake, like instead shorting a naked put or call). Even if the SPY fell 1 percent over the next hour, you could probably get out of your call with under a $100 loss. If you bought the call during a pullback in a bull trend, the odds are good that you would be able to exit with a 10 to 20 cent profit, which translates into a $10 to $20 profit. This would require about a 25 to 45 cent move in the SPY. If the SPY instead fell 50 cents, you could get out of your call with maybe a 30 cent loss, which is $30. Buying puts or calls gives beginning traders more certainty about the most they have at risk, and this might make it easier for them to think about how to trade without constantly worrying about the dollars.
If you take only a couple of day trades a day in the futures or stock markets, then you can be more active in the options market, especially if you also actively swing trade stocks. The opportunities could fill another book, but a few points are worth making here. For example, if you are long a stock that is basing on the daily chart and you are willing to add on lower, you could sell a put at one strike below the market. You collect the premium if your stock goes up or even drops a little, and if instead it goes down below the strike of the put, the buyer of that put will put the stock to you (you will be forced to buy it at the strike price) and you will therefore be adding to your long stock position at that lower price.
Another common use of options for traders who are long stock is to sell out-of-the-money (OTM) calls to collect premium. This covered call writing can add about a 10 percent return to your portfolio every year, but it will occasionally take you out of a stock that is exploding upward.
If you are expecting a big move in a stock or a futures contract but you don't know the direction, you can buy a straddle (buy both a put and a call), but then you suffer time decay, commissions, and bid-ask spreads on both legs. Straddles are rarely worthwhile. An alternative for futures traders is to combine the futures and options in a delta-neutral position, meaning that it has an equal chance of going up or down. For example, in the Emini, one long contract is equal to buying 500 SPY or 10 at-the-money calls. If you buy one Emini contract (or 500 SPY) and 10 ATM puts (alternatively, you could short one Emini or 500 SPY and buy 10 ATM calls), this is a delta-neutral position at the moment that you placed the trade. If the market moves up or down, the delta changes. If the market goes up, your Emini will make more than your puts will lose; if the market goes down, your puts will gain more than your Emini will lose. You lose money only if the market goes sideways for several days, because your option will decay. There is a lot of fine-tuning that you can do to increase your return as the market moves, but Emini day traders are too busy to add this to their trading.
Option traders often talk about catalysts, which are upcoming news events that can lead to big moves in a stock. The most common one is an upcoming earnings report, and less common ones include anticipated information about new products or possible takeovers. Because there is uncertainty and the potential for a big move up or down is large, the premium is usually greatly inflated. As soon as the news is announced, the premium gets crushed, so much so that you can see the big move in the direction that you expected and still lose money! For example, suppose you thought that Amazon (AMZN)'s earnings were going to be strong so you bought a call for $5.00 on the day before, and the earnings were strong and AMZN went up 5 percent on the open; however, your call might open at only $4.00. You would be right about the strong earnings and the strong open, but the premium was so inflated that AMZN probably had to go up 10 percent for your call to increase in value. Because of this rapid loss of the greatly inflated premium, traders need to be careful when buying options before catalysts. If the volatility is too high, they are expensive and require a huge move to be profitable. One way to reduce the effect is to buy a spread so that your short option's loss of premium will largely offset the loss on your long option, but spreads are usually worth buying only if you plan to hold the position for a week or more, because they usually will be profitable only if there is a big move, or if there is a smaller move and expiration is approaching.
Many index options traders pay attention to the Chicago Board Options Exchange Market Volatility Index (VIX), which tends to move in the opposite direction to the indexes and in general rises greatly when the market falls in a panic and traders are buying a huge number of puts to hedge their longs. Other traders are obviously buying puts as a bet that the bear trend will continue. However, after the market starts to turn up again, there can also be an increase in put buying, but for a different reason. Instead of speculators betting on a fall or scared longs hedging, it is often due to confident longs who are protecting their new longs. When this is the case, that put buying implies that the downside risk is much less. These new longs are willing to hold on to their stock positions during a sell-off because they bought the puts as protection, so if the market falls, they will hold on to their stock and futures positions instead of selling in a panic and driving the market down further. In other words, this put buying is a sign that the downside risk has shrunk and bulls are becoming confident. However, it is impossible to know whether the overall put purchases in the market are for speculation on further declines or for protection of new longs. Relying on the opinions of pundits on television is never a good basis for taking positions. If they could make a lot of money trading, most of them would not be wasting time pontificating on CNBC.
Many hedge funds buy stock and hedge by also buying puts, either in the specific stocks in their portfolios or in the overall market, like SPY puts. Hedge funds are rarely perfectly hedged and most adjust the amount of put protection based on the overall market. Some use the volatility index to make adjustments in their puts. For example, if the volatility index rises 20 percent due to a 10 percent drop in the stock market over the past few weeks, they will buy back some or all of their puts, because the puts would have served their purpose. They initially bought the puts when the market was higher, as protection against a sell-off in their stock portfolio. If the market sells off and their stocks decrease in value, their puts will increase in value. They will take profits on their puts and either become less hedged while they wait for the market to rally again, or they will buy new puts to roll their hedge forward into a further out contract, and usually a lower strike price. If the market rallies strongly and they are relatively less hedged, they will buy more puts to increase their downside protection.
If you are trading options on the daily or 60 minute charts and are confident that the move will begin within the next day or two, it is best to just buy an option instead of a spread. However, if you think that the move might take a week or more to begin, you can reduce the effect of time decay by purchasing a spread. You reduce your total profitability because the value of the short option increases as the market goes your way, but the overall risk/reward ratio improves. In general, choose the strike for the short option near a support or resistance area. For example, if the SPY is at 105 and has a strong buy signal, but there is resistance around 108, you could buy the one-month-out ATM 105 call and finance it in part by shorting the OTM 108 call. The net cost of the long call less the premium you collected on the short call might be about $1.20. Since 108 is resistance and resistance acts as a magnet, the market should get drawn to the 108 area. Both calls will increase in value, but the long ATM 105 call will increase in value faster and more than make up for the loss on the short 108 call. If the market rallies in a very strong bull spike and you think that it will easily break through the 108 resistance area, you can buy back the short 108 call for a loss and hold the long 105 call, which has more than enough profit to offset the loss on the short call. If the rally to 108 is weak and you think that the market might sell off, you should exit your spread with a profit. It is usually not worth holding the spread to expiration, even though that it when the maximum profit is realized. Your premise has changed so you need to reevaluate your position, and this is always a consideration when trading options. If the SPY is at 108 at expiration, the short 108 call will expire worthless and the long 105 call will be worth $3.00, so your total net profit might be about $1.80. However, if the market is at 108 with two weeks to go before expiration and your net open profit is $1.50, it is probably better to simply exit because it is not worth risking turning your $1.50 profit into a loss by sitting through a sell-off below 105 before expiration. As the market rallied to 108, your risk/reward situation changed, and it is no longer as good as it was when you put the trade on. It is better to take your profit and look for the next trade.
A trader can either buy or sell a spread. For example, if the SPY is at 130 and a trader thinks that it will go up, he could buy a call spread by buying the ATM 130 call and selling an OTM call at a higher strike price, like a 133 call. He could also make a bullish bet by shorting a put spread, like selling an ATM 130 put and buying an OTM 125 put. In general, most traders prefer buying spreads to selling them because they prefer to be long and not short the ATM option. If they are short the ATM option and the underlying goes even a little against them, they are at risk of having additional, unwanted work. For example, if they shorted that put spread and the SPY fell to 129 and stayed there as expiration approached, they might be put the stock, which means that the broker will automatically sell them the stock at 130; then they would have to decide what to do with the stock and the remaining long OTM put.
Buying a spread is usually best when you plan to hold the trade for several weeks, especially if you can hold the position into the final week. This is because the short strike is always more OTM; the more a position is OTM, the faster it will lose premium through time decay, and that decay accelerates rapidly in the final week. However, you can also purchase a spread with the intention of holding it for just a few days if you are expecting a huge move beyond your short strike within that time. Buy the spread for a trade that you expect to hold for less than a week only if you think that the market will go beyond your short strike during that week. Otherwise, just buy a simple call or put. For example, say the SPY is at 134 and you think that it will fall to 130 over the next week. Either you could buy a put, like the ATM 134 put, or you might want to consider a spread, like a long 134 put and a short 132 or 131 put.
Since options lose money every day even if the market remains unchanged, you should hold your position only if you believe that your premise is still valid. Otherwise, get out, even at a loss. How do you know if your premise is still valid? Look at the market as it is at this moment and imagine that you are not holding the position. Next, ask yourself if you would put on that exact position. If you would not, then your premise is invalid and you should exit immediately.
A common mistake that a beginner makes is to hold a winning option position too long. For example, if the trader buys a call at the bottom of a trading range with a goal of a test up to the middle of the range over the next week, but the market races to the target in just one day, it is usually better to take most or all of the profits at that point. Yes, the strong momentum might be the start of a bull trend, but it is more likely that the trading range will continue, and either the market will soon go sideways and erode the premium through time decay or the market will pull back and the profit will disappear. Option profits disappear quickly, so it is very important to take them once you have them.
Just because a stock is well-known, do not assume that its options are heavily traded. If they are not, the bid-ask spread can be unacceptably large. For example, the bid for an ATM call might be $1.20 and the ask might be $1.80. This means that you would probably have to pay $1.80 for the call, and if you immediately sold it you would receive $1.20, instantly losing 60 cents, or a third of your investment! In general, if the open interest is less than 1,000 or the recent daily volume is less than 300 options for the strike that you are considering, you usually should not place the trade. You should rarely, if ever, trade thinly traded options. However, if you do, you should always enter and exit with limit orders. Even then, your limit order might sit there for hours while you are waiting for it to get filled, and you will sometimes end up giving in and exiting at the market, greatly reducing your profit potential. One of the nice things about active option markets like the SPY is that the bid-ask spread for the front month is usually only a penny for ATM and near-the-money options, so you can place market orders and get excellent fills.
A large bid-ask spread alone should not be a deterrent to buying an option, because the spread is proportional to the price of the stock. When AAPL is trading at $300, the bid-ask spread on an ATM call might be 20 cents, which might seem like a lot to a beginner. However, traders would not hesitate to buy an option on a stock trading at $30 if the bid-ask spread on the option was 2 cents. They might buy 10 calls of the $30 stock for every one AAPL call. This is a mathematically appropriate way to trade.
Spreads can be useful if you are entering during a strong spike on the daily chart and the market has a way to go before it reaches its target. For example, if the SPY is at 118 and falling sharply well below the moving average in a new bear trend, and you believe that it will hit 115 within the next few days, you might be hesitant to buy a put, because the market might suddenly reverse up to the moving average before falling to the target. As an alternative, you can buy a 118 put and short a 115 put. If the market falls nonstop over the next couple of days to the 115 support area, you could exit your put spread for maybe a $1.50 profit. If instead it rallied to 120 at the moving average, your spread might have an open loss of a dollar. If you believed that your premise was still intact, you could leg out of your spread by buying back your short put for a profit of maybe 50 cents, but holding your long put. If you are right and the market then falls to your 115 target over the next week, you might make an additional $2.00 on the long put for a total profit of about $2.50 on the trade. It takes experience to be able to leg out of a spread when the market is going against you, but if you are confident about your chart reading, this can be a good approach.
Incidentally, short options at support and resistance levels increase the strength of those levels, since options tend to expire near the strike price with the biggest open interest. The more volume traded at any option strike price increases the magnetic effect of that price, which increases the support and resistance at that price. If the volume is large enough, it can affect the market around expiration. The volume can get huge if there is an obvious support or resistance level, because that strike price will generate lots of option activity. In fact, the SPY and the QQQ often expire close to the put and call strike price with the largest open interest. The short side of the options is usually taken by institutions, who are the smart money traders, and they will do whatever they can in the options market and in related markets to make their short options expire worthless so they get to keep the entire premium that they collected.
The VIX is a measure of the volatility of the S&P 500 index options, and although buying a call or the SPY or the Emini is usually a good trade during a strong bull spike when you believe that follow-through is likely, there is a risk associated with the VIX. Incidentally, every 16 points in the VIX corresponds to a 1 percent expected average daily range in the S&P 500 index (so a VIX of 32 means that the average daily range of the SPY and Emini is about 2 percent). If the spike is strong enough, the VIX might also spike up and the cost of your call would be elevated at the time of your purchase. If over the next couple of hours the market enters a quiet bull channel, the VIX might fall enough so that the value of your call will not increase. Because of this, if you want to buy a call during a bull spike or a put during a bear spike, if you are not buying early on in the spike, it is better to wait for a pullback to reduce the risk of buying during a brief spike up in the VIX, which would cause a brief overpricing of all options.
A dramatic increase in option volatility usually causes a disproportionate increase in price of the OTM options. This is called skew, and skewed pricing can be upsetting to beginning spread traders, because it results in smaller profits than what seems fair or logical. If a trader bought a 133/128 put spread in the SPY during a trading range in a bull market when the SPY was around 133, paying $3.50 for the 133 put and receiving $2.00 for the short 128 put, and the SPY fell $4.00 over the next two weeks on some world crisis, the trader might assume that the spread would increase by $4.00 as well. However, since so many traders are buying OTM puts to protect their longs as the market is falling sharply, their price increases disproportionately to the ATM puts, and the spread might increase to only about $2.50, or a $1.00 profit. As the market falls sharply, the volatility increases sharply, which has a greater effect on OTM puts (and calls, as well). However, the market might have to fall about 5 percent below the lower strike price, maybe down to 123, for the spread to have close to a $5.00 profit in the weeks before expiration. Spreads get close to their profit potential only if the market falls far below the lower strike price, or during the last week before expiration. Traders should generally buy spreads only if they are expecting a move to near their short leg at some point over the next few weeks, or if they are willing to hold the spread and exit within a week or so of expiration. The put spread will have the full $5.00 profit at expiration if the SPY is less than 128, the lower strike price, at expiration, but most traders exit before then.
Because of the skewing of OTM options during big spikes on the daily chart, traders should consider outright option purchases if they are expecting a move up or down over the next week or so. If they are planning to exit several weeks before expiration, they should consider not buying a spread. For example, if the market just had a strong 3 percent drop on the daily chart and now has pulled back to a possible lower high, and traders expect a strong second leg down to begin within the next few days, they are probably better off just buying an outright put instead of a spread. If they were willing to buy two put spreads for a total cost of $3.00, they might instead consider buying a single ATM put for about $3.50. If they get the sharp sell-off during the next week or so that they are expecting, their put might be worth $7.50 if the market quickly falls to 128. This is still less than the $5.00 they might have hoped to make (the difference between the 133 in the SPY when they bought the put and the current price of 128), but much more than the $2.00 they would have made on the two put spreads. If their put quickly increases in value by $3.00 or $4.00 within a few days, they should sell out of the position, because the market will probably pull back and enter a trading range. If they continue to hold the put, the $4.00 profit might quickly become a $2.00 profit. The rally might convince them that their premise is no longer valid, and they will then exit with that $2.00 profit, wishing that they hadn't been so greedy. The options market often offers traders unexpected gifts, but rarely as much as a beginner might think is logical. When it does, it is almost always better to take the gift and then look for the next trade.
FIGURE 23.1 Buy Calls during Bull Spikes
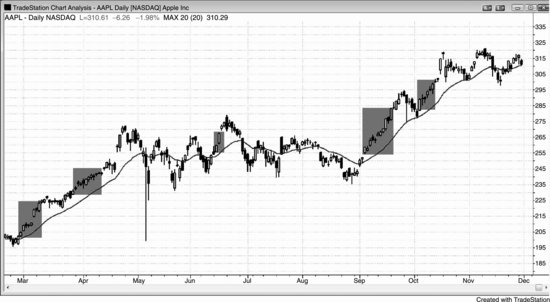
When a stock is in a strong bull spike, traders can buy calls or call spread. Many traders who buy calls in strong bulls prefer OTM strikes because the time decay is slightly less. As shown in Figure 23.1, this daily chart of AAPL had several bull spikes composed of a series of bull trend bars with small tails and bars with little overlap. The momentum was strong, which made the odds favor higher prices. If traders wanted to participate in the up move but limit their risk, they could buy calls or call spreads. They could take partial profits after a few days and then exit the remainder of the position at the first sign of a reversal or on a pullback to near their entry price.
When the market is trending up and traders want to buy it, but would like to buy it a little lower, they will often sell a put just below the market. For example, during any of the shaded bull legs, a trader could have sold a one month out put that was about 2 percent OTM for $8. If the market fell and they were put the stock, they got in 2 percent below the current price and they would be happy. If the market instead continued up, they got to keep the $8, which is about a 2 percent profit in one month. Other traders would simply sell an ATM put. For example, when the market was at 260 and rising sharply, they could have sold a one month out 260 put for about $12. If they were put the stock, they would get to keep the $12. This means that their net cost to buy the stock was 248, even if it never fell much below 260, and simply continued higher.
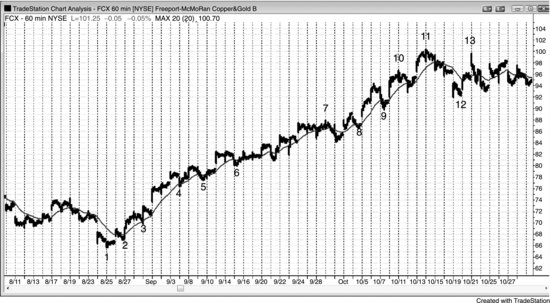
FIGURE 23.2 Fade Stair Breakouts with Options
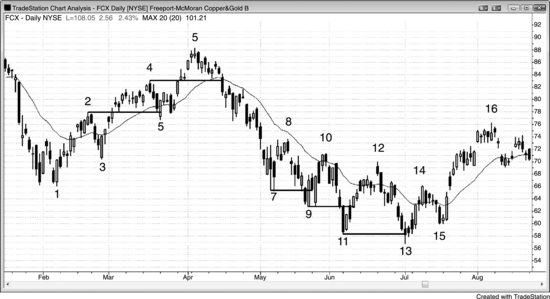
When a market is in a stairs pattern, you can fade each new breakout with options, expecting a pullback into the prior stair. As shown in Figure 23.2, after the rally to bar 4, the daily chart of FCX had a pullback to below the bar 2 high, which means that the bulls were not too strong. Traders who correctly assumed that a breakout above bar 4 would be followed by a pullback to below the bar 4 high could have bought puts at the bar 5 doji or before the close of the next day once it was clear that the day was likely to be a strong bear trend day.
When the market turned up at bar 9 and rallied several dollars above the bar 7 low, traders could have bought calls on or just before the close of bar 11, expecting a rally of at least a couple of dollars above the bar 9 low. They could have bought calls again on the close of bar 13 when they saw the big tail at the bottom of the bar.
Bar 12 was a bear reversal bar and a potential final flag reversal, a moving average gap bar, a double top with bar 10, and a weak high 1 or high 2 breakout at the top of a possible trading range. It was reasonable to buy puts at the end of the day. Since the market was in a broad bear channel down from bar 5, many traders bought puts on each rally above the midpoint of the prior leg down and near the moving average. Many waited until near the close of the day, to be confident that the day would be a bear trend day, like during bars 8, 10, 12, and the bar after bar 14. They took profits below the most recent swing low, and the profit taking by all bears, combined by the buying by the bulls, resulted in the reversal up after each new low. Bears were buying back their shorts at new lows, not pressing their bets by shorting more on the breakout. This is a sign that the bear trend is transitioning into a two-sided market (a trading range).
FIGURE 23.3 Fade Trading Range Extremes with Options
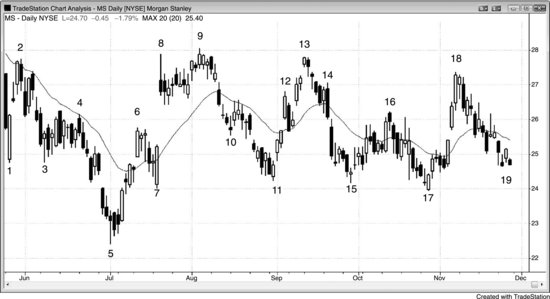
When the market is in a trading range, traders can buy puts and exit previously purchased calls near the top of the range and then buy calls and exit puts near the bottom of the range. As shown in Figure 23.3, after the reversal up from the bar 5 low, Morgan Stanley (MS) reversed down after bar 9, which was the second attempt to break out above the bar 2 high. Since there was a spike up to bar 6 and then a pullback to bar 7, the three pushes up to bar 9 (bar 6 was the first push) were likely to function as a channel and be followed by a test of the bar 7 bottom of the channel. Traders could have bought puts near the close of the bear bar that formed three bars after bar 9.
Bar 11 was a bull reversal bar and a double bottom bull flag with bar 7, as well as the bottom of a channel after the bear spike to bar 10. Traders could have exited their puts and bought calls going into the close of the bar.
The bar after bar 13 had a bear body, and traders could have exited their calls and bought puts at the top of the range, especially since this was a wedge bear flag. The two bars after bar 10 formed the first push up, and bar 12 was the second.
The move down to bar 15 followed a very strong spike, and even though bar 15 formed a double bottom with bar 11, the market might have needed more of a base before it could rally much. Traders who did buy calls here should have taken profits on the reversal at the bar 16 top of the wedge bear flag.
Bar 17 was a bull reversal bar and the third push down from the bar 9 high. Many traders saw this as a potential bull triangle after the strong move from bar 5 to bar 9, and this was a call-buying opportunity. It was also a reversal up from a low 2 at the bottom of a trading range (bars 7, 11, and 15 established the bottom of the range). A low 2 short signal at the bottom of a trading range usually fails and leads to a reversal up, as do most attempts to break out of a trading range.
When professional options traders believe that the market will rally, they will sometimes put on a risk reversal, which is beyond the scope of this book. For example, the market rallied strongly from the bar 5 low and then entered a trading range. Many traders would rightfully have concluded that the market had a good chance of testing the top of the trading range again, and it might even break to a new high. After the double bottom at bar 15, an options trader saw that there was strong buying around 24.00, and he would be happy to be able to buy there. Since he believed that the market would work higher, he could have bought a call at any point as the market rallied up from the bar 15 bottom of the triangle (with bars 7 and 11). If he bought the one month out November 26 OTM call for 1.50, he might have been able to completely cover the cost of that purchase by selling an OTM 24 put, which would have given him about a 1.50 credit. The net cost of his long 26 call and his short 24 put was zero, and this strategy is called a risk reversal. If the market fell below 24, the stock would have been put to him at 24, the price where he was hoping to be able to buy. He would then be long the stock and still long a call. If the market fell sharply, he would lose the 1.50 he spent for the call and as many dollars as the stock fell below his 24 entry price. However, he believed that this was unlikely, and in this situation, had possibly a 70 percent chance of making money. The market dipped below 24, and on a one-bar small dip like that with several weeks to expiration, it would have been unlikely that he would have been put the stock. If he had been, then he would be long the stock and the call, and he could have taken profits on both around the bar 18 test of the top of the trading range. If he was not put the stock, he could have closed out his risk reversal with a big profit on both his long call and his short put, which would have fallen close to zero (he received 1.50 when he sold it and could now buy it back for about 10 cents). A risk reversal is similar to holding the belief that the market might form a lower low major trend reversal. The trader believes that the market is reversing up and is comfortable buying (being put the stock) if the market falls to a lower low.
FIGURE 23.4 The SPY Is a Good Market for Options
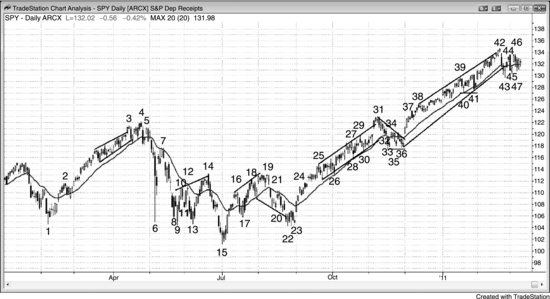
As shown in Figure 23.4, the daily chart of the SPY regularly offers opportunities to buy options.
The two-legged higher high up to the bar 4 bear reversal bar was a good put-buying setup for a test of the moving average. The market was forming a small double top with bar 3, so the odds were good that the bull trend was evolving into a trading range, in which case a test of the bottom of the range and the moving average was likely. Traders could have bought puts before the close, once they saw that the bar was likely to be a strong bear bar. Bar 3 was a buy climax and a breakout of a bull channel, and it was followed by a strong bear bar. This showed that the bears were willing to be aggressive. On the two-legged higher high up to bar 4, it was reasonable to think that the market would test the moving average again.
When bar 6 closed, many traders assumed its low was likely to get tested. Higher volatility increases option premiums, so put premiums were greatly inflated because the bar was so huge. Traders could have bought a put spread, buying the one-month-out ATM 113 put and shorting a put about four strikes lower. If the short put is too far below, its value is too small to be worth shorting. If the market quickly fell below 109, traders could have exited the spread with a profit. However, if they held and saw the rally to the moving average at bar 7, they could have bought back the short 109 puts, which would be worth much less, and continued to hold the 113 puts, even though they, too, were worth much less. However, the puts would have quickly increased in value over the next several bars, and traders could then have made a profit on both sides of the spread. This is called legging out of the spread, because you exit the two parts or legs at different times.
Bar 7 was a moving average test after the huge bar 6 bear spike. The odds favored a sell-off to at least the middle of the bear spike. Traders could have bought puts at the moving average or just before the close of the bar 7 strong bear bar, when they saw that the bar was probably going to be a strong bear bar.
Bar 9 was a strong bull trend bar and the second strong bull trend bar within three bars and therefore a sign of buying pressure. The big tail at the bottom of bar 6 was also a sign of strong buying at this price level. The odds were good for a test of the moving average, so traders could have bought calls going into the close of bar 9, once they saw that it was probably going to be a strong bull reversal bar.
Bar 13 was a second attempt to reverse up from below the huge bear spike and the bottom of a triangle, where bars 6 and 9 formed the first two legs down. It was also a bull reversal bar and another sign of buying pressure in the 105 area. Traders could have bought calls going into the close of the bar.
Bar 14 was a strong bear reversal bar, a moving average gap bar, and the top of a wedge bear flag, so traders could have bought puts going into the close once they saw that the bar was going to be a strong bear bar.
Bar 15 was a riskier call purchase setup because the momentum down was so strong, but it was the third push down from the bar 4 high, where bar 6 was the first and bars 8 through 13 formed the second. Once traders saw how strong the bull spike up to bar 16 was, they could have bought calls on the close of the strong bar 17 bull reversal bar for a second leg up after the large wedge bottom and strong bull spike.
The market was stalling during the five bars before bar 19, and the doji close was enough reason to buy puts at the top of the wedge (bars 16, 18, and 19) and the double top with bar 14.
Bar 21 was a two-legged pullback to the moving average after a strong bear spike, so traders could have bought puts on the close when they saw that there were two doji bars that failed to close above the moving average.
Bar 23 was the third bull bar in the past five bars, which was a sign of buying pressure. The market was trying to form a higher low after the rally to bar 19. This was also a spike and channel bear from bar 19 and a wedge bull flag with the low after bar 18 and then with bar 20. Traders could have bought calls on the bull close or on the close of the following day, which was a large bull trend bar with tiny tails and a close well above the moving average. This was part of a strong bull spike after a significant bottom and was likely to be followed by higher prices. If they were planning on holding for more than a couple of weeks, many would have bought call spreads instead of calls, to lessen the effect of time decay.
Bar 31 was a bear reversal bar after an upside breakout above a protracted bull channel, and at a minimum, the market should have tested the moving average and poked below the bottom of the channel. This was a good opportunity to buy puts. In fact, traders could have bought puts on the open when the market was above the high of the prior bar. Why was that a good trade? When the market breaks above a lengthy bull channel, it usually reverses to the bottom of the channel and the reversal generally comes within five bars. Therefore, buying puts above the third bar had limited risk.
There was a very unusual feature to this channel. Only once in the past 10 years did the market not touch the moving average for this many consecutive bars (bars 26, 28, and 30 did not touch it), and that one occurrence was followed by a test of the moving average after about as many bars. Extreme behavior offers a regression to the mean trade. If the market is doing something that it has not done in years, it will likely stop doing that very soon, and option traders can place a bet in the opposite direction. Whenever you see something that appears unusual, look back or test prior data to get a sense of how unusual it is. If you tested back over the past 10 or 20 years, you would find that more than 95 percent of the time when there were 30 or more consecutive gap bars, the market came back and touched the moving average within 10 bars. Traders who saw this started taking profits on longs and buying puts above the high of the prior bar for a bet on a test of the moving average. The odds were excellent that the market was going to touch the moving average soon, so buying puts here was a good trade, and traders could have taken profits on the bar 32 test of the moving average. For example, once the market formed a one-bar pullback before bar 31, traders would have bought puts on any move above its high, which happened on the next bar. The market sold off from the gap up open of bar 31. After a tight bull channel has gone on for a long time, bears begin to enter the market at the top of the channel above swing highs and above the highs of prior bars. When something rarely happens, it is unsustainable and therefore climactic and the ensuing pullback is usually deeper and lasts longer than what most traders expect, so the odds were that the bar 31 high would hold for at least several weeks and for at least a two-legged sideways to down correction. The size of the correction should be comparable in the number of bars and points to the prior legs on the chart, because the market tends to keep doing what it has been doing (inertia).
Similar strong, tight bull channels formed in the move up to bar 3, and from bar 36 to bar 39. Traders bought puts above the highs of prior bars and on the closes of strong bull trend bars, which were possible exhaustive buy climaxes, and on small bars that followed these big bull trend bars, expecting a test down for one to three days. Put buyers made from 50 cents to a dollar on these scalps on the daily chart.
Another example of extreme behavior came at bar 42. Although this SPY chart has a couple of small bear bars in the move up from bar 41, the Emini chart did not. Instead, it had 15 consecutive bull trend bars, which is something that had not occurred in many years. This means that it is extreme, and therefore climactic. Smart bears began to scale into put positions in the several bars before bar 42, expecting at least a 10-bar, two-legged correction that would likely fall below the moving average.
FIGURE 23.5 Buy Calls on Pullbacks to the Moving Average in a Bull Trend
When the market is in a strong bull trend, as it was on the 60 minute FCX chart shown in Figure 23.5, traders could buy calls on each poke below the moving average. About 80 percent of attempts to end a strong trend fail, so the odds were good that the calls would be profitable over the following days. Traders planning on holding for more than a week or two would have bought call spreads to reduce the effect of time decay.
After the three pushes up to bar 11 (bar 10 was the second push), the odds of a two-legged correction were good, so traders should not have bought calls during the leg down that followed.
Because bar 11 was the third push up in an overdone bull, it could have been followed by either a trend reversal or at least a trading range. Many traders who were long would have wanted to hold onto their stock, but protect themselves against a big sell-off. One strategy, which is beyond this book, is a cashless collar (traders “collar up”). A bull could have bought a one month out OTM 90 put for 2.00 and financed it by selling an OTM 105 call, also for 2.00. His net cost for the protection below 90 is zero (“cashless”). If the market rallied 5 percent, his stock would be called away, but he would make that additional 5 percent profit. Instead of collaring up, many traders would simply have sold a call (a buy write, or a covered call), instead of also buying the put, because the puts are disproportionately expensive and you have to give up too much upside to find a call equal in price to the put (the call is usually much closer to the money than the put).
FIGURE 23.6 Buying Calls for a Day Trade
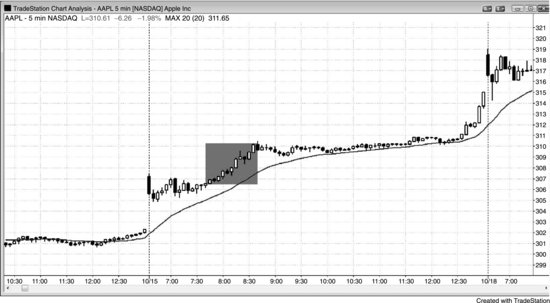
If you don't follow a stock closely but notice a strong bull spike after a big gap up on the 5 minute chart (see Figure 23.6), you can buy calls and hold them until the close. You can use an alert to tell you if the market dropped back below the price of the underlying at the time that you bought the calls and then exit with a limit order with a small profit. Otherwise, exit the calls just before the close.
FIGURE 23.7 Day Trade Runaway Trends with Options
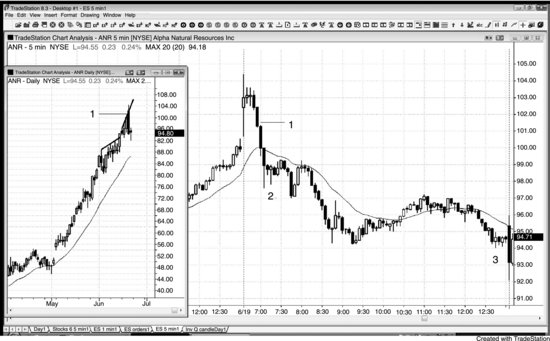
Runaway markets often offer profitable fades using options, and this type of trading doesn't cause too much distraction for day traders because the risk is limited. As shown in Figure 23.7, Alpha Natural Resources Inc. (ANR) was in a strong bull trend on the daily chart (insert) and broke out of the top of a wedge four days ago. Yesterday, it gapped above another trend channel line and above 100, a psychologically important number and therefore a magnet. As soon as the 5 minute chart started to come down, a test of 100 was likely. The one-month-out July 100 puts could have been bought for $7.20, and a reasonable worst-case exit would have been a trade above the top of the trading range at the open, risking maybe a dollar or so on the puts. At bar 2, those puts were worth $8.80. This first pause was a great place to take partial profits, because there could have been an opening reversal back up after testing below the moving average and below 100. However, the bear spike off the open was so strong that there was likely to be at least a channel down for a second leg. If traders moved their stop to around $7.30, it would never have been hit. The puts were worth over $10.00 by the close. Instead of placing a stop in the market, they could have their software alert them if ANR traded above maybe 102; if it did, they could have tried to exit the puts with a limit order. The problem with the protective stop is that if the market rallied strongly and no trades took place on the 100 puts, the stop would never have triggered even though the bid and ask were far above the stop.
On the daily chart, the day turned into an outside down day. In strong bull trends, there is usually not much follow-through on the next day (here, there was a small doji day), because the large outside down bar will likely be the start of a small trading range. However, a test of the rising daily moving average was likely in the near term. When a trader makes windfall profits off options, it is best to close the position and then look for other opportunities tomorrow. There was likely little left to be gained from this position, and holding it into the next day would have been a distraction from day trading.
FIGURE 23.8 In Volatile Intraday Moves, Consider Options
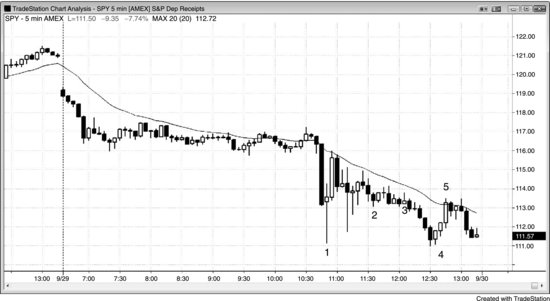
The Dow Jones Industrial Average was down 700 points today (September 29, 2008, shown in Figure 23.8) on the House of Representatives’ failure to pass a $700 billion Wall Street bailout bill. Because the Dow fell 430 points in just 10 minutes, the risk of order systems getting overloaded and locked up was real. As an alternative to Eminis and stocks, you could have purchased calls if you wanted to trade countertrend. For example, a SPY November 114 call could have been bought for about $6.00 at the close of bar 1 and then sold near the moving average for an 80 cent gain (that is a profit of $80 per contract, since each stock option represents 100 shares of stock).
If you bought the possible bar 3 double bottom bull flag (not ideal because you want a bull signal bar when trading against a strong bear trend), you could have bought the calls for $6.80. I tried to buy the QLD, which is an exchange-traded find (ETF) with twice the leverage of the QQQ, from one broker, but immediately canceled my order based on the bear signal bar. However, the broker's online order system did not let me cancel the order and it did not tell me if it was filled. I placed a stop order just in case, but now I had two orders that I did not know whether they were filled. I immediately hedged with another broker (all traders should have at least two brokers for this very important rare reason), and my hedge was twice the size, even though I did not know if the original long or the stop got filled. I kept checking, and 40 minutes later the first broker gave me my fill on my original trade and on my stop. I lost only 4 cents! For the hedge, I could have used a number of different instruments. I bought the QID, which is an ETF that is the inverse of the QQQ and twice the leverage, to offset my QLD. At the new low of the day, which was a lower low after a trend line break (the sideways action to bar 3 qualifies as a break of the bear trend), there was a bull inside bar. I exited my hedge with $1.40 profit and bought SPY calls for $5.80. I exited the calls on the test of the moving average with a 50 cent profit.
This is not how I like to trade, even though everything turned out well. My mistake was assuming that today's technology was good enough so that order systems would no longer lock up. It made much more sense to just trade calls, like at the bar 4 low, so that my risk would have been defined even if the order system locked up.
One final point about buying calls on huge days like this: The CBOE Volatility Index (VIX) hit 50 today, which is extremely unusual. Every 16 points in the VIX means that the S&P will have an average daily range of about 1 percent. A VIX of 50 means that the average daily range is about 3 percent, or over 3 points when the SPY is around 115. That means it is not sustainable. If you buy calls, their premiums will shrink rapidly, which makes them not great overnight trades. For example, the SPY was up $3.00 the next day, but the calls were up only about $0.50 due to the dramatic contraction in volatility. At-the-money calls normally move about $0.50 for every $1.00 move in the underlying, so clearly the risk/reward ratio is poor when buying options when the VIX is high.
FIGURE 23.9 AAPL Dropped on Earnings but Puts Did Not Rise
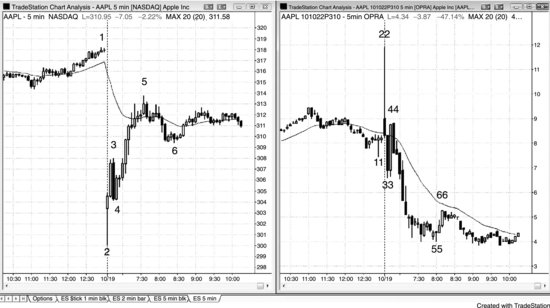
As shown in Figure 23.9, AAPL was up 40 percent in the past two months and earnings came out after the close yesterday. A trader who bought an OTM 310 put on the close yesterday for about $8.00 expected a windfall profit on the open when AAPL opened down $14.00. Instead, the put was only briefly profitable and it quickly fell to well below the purchase price even though AAPL remained down for hours. Premium is often so inflated before a catalyst that only a huge move will lead to a profitable trade. Traders need to be very careful when buying options before a catalyst and should not buy them when the volatility is too high, meaning that the options are too expensive.
Bar 2 in AAPL on the chart on the left corresponds to bar 22 on the chart on the right of the OTM one-month-out November 310 put.
At bar 5, AAPL was still down about $5.00, about 1.6 percent, yet at the same time the put at bar 55 was down $4.00 when put buyers were hoping that it would be up at least a dollar to $9.00 or more. This was because the puts were very expensive ahead of earnings, and once the earnings came out last night, the uncertainty evaporated and the premium got crushed.