PART III
The First Hour (The Opening Range)
I once had many online discussions with a trader who traded 100 Treasury bond futures contracts at a time, but he disappeared every day by 7:30 to 8:00 a.m. PST. He said that he studied his results and discovered that he made 85 percent of his profits in the first hour and decided that he just drained himself emotionally during the rest of the day, and sometimes this carried over into the next day. Because of this, he stopped trading after the first hour or so several years ago and was doing very well trading just the first hour.
Here are some of the characteristics of the first hour:
- What is referred to as the first hour is rarely an hour. It is the time before the first good swing begins and can be 15 minutes or two hours; it is often called the opening range.
- It is the easiest time to make money. Experienced scalpers know that reversals are common. These traders can often make many carefully selected scalps, betting that breakout attempts will usually fail, as is typical of breakout attempts at any time of the day. They look to buy low and sell high. In general, they avoid doji signal bars, but will often short below either a bull or a bear trend bar after a move up, or buy above a bull or a bear trend bar after a move down. Consecutive trend bars in the same direction often indicate the direction of their next scalp. Two consecutive, strong bull trend bars will usually make scalpers look to buy, and consecutive bear trend bars will bias them in favor of shorts.
- It is the easiest time to lose money. Beginners see large trend bars and are afraid of missing a huge breakout. They buy late, at the top of strong bull spikes, and short late, at the bottom of strong bear spikes, only to take repeated losses. There are more variables to consider, and the setups come faster. Because they often confuse swing and scalp setups, they end up managing their trades wrong. They should never scalp, especially in the first hour.
- When the bars are big, traders should use wider stops and trade smaller size.
- Yesterday's always-in direction going into the close often carries over into the open of today.
- Reversals are common, abrupt, and often large. If you can't read the price action fast enough, wait until the market slows down and the always-in direction becomes clear.
- The first bar of the day is the high or low of the day only about 20 percent of the time, so don't feel a need to enter on the second bar. In fact, there is no need to rush to take any trade, because before long the always-in direction will be clear, and the probability of a successful trade will be higher.
- Either the high or low of the day usually forms within the first hour, so swing traders patiently wait for a setup that can be one of the extremes of the day. The setup for the high or low of the day often has only a 40 percent probability of success. Since the reward can be many times larger than the risk, the trader's equation can still be excellent for a swing trade. Most traders should focus on a logical reversal in the opening range for their most important trade of the day. The trade often looks bad for five or more bars, but then suddenly breaks out and the always-in direction becomes clear to most traders. On most days, a trader will have to take more than one reversal before catching a successful swing, but even the ones that don't go far usually make a small profit or have only a small loss. This creates a favorable trader's equation for this particular type of relatively low-probability trade.
- The high of the day usually begins with some type of double top, although it is rarely exact. The low of the day usually begins with an imperfect double bottom of some type.
- Once the always-in direction becomes clear, traders can enter at the market or on any small pullback for a swing. Experienced scalpers look for pullbacks to scalp in the direction of the trend.
- Trading in the minutes after a report is dominated by computer programs, many of which get a nearly instantaneous numerical version of the report and use the data to generate trades. Other programs trade off statistics and not fundamentals. It is very difficult to compete in an environment where your opponent has the edge of being much faster at making decisions and placing trades. It is better to wait for a bar or two before entering.
- Gap openings are present on most days (see Chapter 20 on gap openings).
- The open often foretells the type of day. If the first bar is a doji or the first several bars overlap and have prominent tails, the day is more likely to have lots of two-sided trading.
There are often reports at 7:00 a.m. PST. Even if a report is not listed on the Internet, the market usually behaves as if there was a report. Computers have a clear edge in speed of analysis and order placement, and they are your competitors. When your competition has a big advantage, don't compete. Wait for their edge to disappear and trade when speed is no longer important.
The first hour or, more accurately, the opening range is the time when the market is setting up the first trend of the day, and it ends once that trend begins. It often lasts for a couple of hours and sometimes is as short as 15 minutes. It is the easiest time to make money, but is the easiest time to lose money as well. This is because many traders cannot process all of the variables fast enough, and the information is limited, since there are not many bars yet in the day. They have to decide on whether to treat a trade as a swing, a scalp, or both, and have to base the decision on the three trader's equation variables of probability, risk, and reward, in an environment when there are usually economic reports, where reversals and therefore decisions come often, and where the bars are often unusually large and therefore require them to adjust their risk to much larger than normal, as opposed to other times during the day when risk is a variable that is usually fixed at a certain size and does not usually require much thought. Get the picture? A trader has more to think about and less time to do the thinking. Computers have a clear edge in speed of analysis and order placement, and they are your competitors. When your competition has a big advantage, don't compete. If you are thinking, “Boy, I wish that I had the speed advantage that the firms using computers for program trading have,” then you realize that you are at a disadvantage. Wait for their edge to disappear and trade when speed is no longer important.
Trading is difficult enough and the edge is always small, and the added complexity of the first hour can push traders beyond their ability to trade effectively. If there are too many variables to consider to trade profitably, traders can increase their chances of success by reducing the number of variables. For example, they can decide to look only for high-probability scalps or for only likely swing setups, or they can wait until there is a clear always-in trade and then swing, or take scalps in that direction, entering on pullbacks. They can also trade half to a quarter of their normal size and use a protective stop that is beyond the signal bar, which often requires a stop that is two or more times larger than their usual size.
One of the biggest causes of losses is a trader's inability to distinguish between swing and scalp setups. From the trader's equation, readers know that scalpers generally have to win on 60 percent or more of their trades, since the risk usually has to be about the size of the reward. Scalp setups are much more common than swing setups, but most scalp setups do not have a 60 percent probability of success and should be avoided. However, reversals are common in the first hour, and traders often do not have enough time to adequately assess the trader's equation. If their default is to take every reversal and then do the math after they are in, they will lose over time. The high or low of the day often follows a setup that has less than a 50 percent chance of success, and is therefore a terrible setup for a scalp, but it can still be a great setup for a swing.
Experienced traders can usually find four or more scalps in the first hour and even make a living off those trades. For example, if they average two profitable scalps a day of two points each and trade 25 Emini contracts, they could make a million dollars a year. Since most traders cannot process the risk, reward, and probability reliably when they have to do it quickly and with only five or 10 bars of information, they should not scalp in the first hour when reversals come quickly and abruptly. Instead, they should wait patiently for a setup that is likely to lead to an always-in swing, or wait until the swing has begun and the market has a clear always-in direction, and then take a swing trade. They will then have a reward that is larger than their risk (it may be two or three times as large), and since the always-in direction is clear, they'll have a 60 percent or better chance of the market going at least as many ticks in their direction as they have at risk from their stop, at which point they can move their stop to breakeven.
Many experienced traders look for a strong trend bar or consecutive trend bars in the first hour, and then will scalp a pullback. For example, if there are two consecutive strong bull trend bars and then a doji bar, they might place limit orders to buy at or below the low of the doji bar. Since they see it as a weak reversal signal, especially after such a strong bull spike, they expect it to fail. This means that the bears who sold below the bar will have to buy back their shorts and probably won't want to sell again for at least a bar or two. This removes bears from the market and turns some bears into buyers, which gives the bull scalpers a good chance to make a profit. The protective stop size and target size depend on how large the bars are. If the Emini has had an average daily range of about 15 points and the bull trend bars are about two points tall, traders might risk about two points to make two points, if they believe that there is a 60 percent chance of success, which there often is in these circumstances. Other bulls might scale in lower and risk to below the bottom of the bull spike. Only very experienced traders should be fading breakouts of bars in the first hour, because the moves can be fast and go very far, and traders have to be very confident of their read and their ability to manage their trades in a fast, volatile market.
The moves in the first hour can be fast, and traders often get caught up in the excitement of big trend bars and enter late. They know that a trend will soon begin and are fearful of missing it, and instead get caught in a reversal. Since the market is searching for direction in the first hour, reversals are common. Traders might take a trade and think that they will swing it, only to discover that it reverses on the next bar. They then have to decide whether to exit or to rely on a stop beyond the signal bar. Invariably, as they are making that decision, they realize that the reversal trade is better than the trade they took, and they struggle with trying to figure out how to minimize their loss and get into a trade in the other direction. They hold too long, hoping for a pullback, and then exit with a larger loss than they planned on taking. Not only that; they are upset by the large loss and need to recover before taking the next trade. Once they are ready to trade again, the market has moved so far in the new direction that they are afraid to take the trade, even though the trend looks strong. At the end of the day, they print the chart out and cannot believe how clear the setups actually were. But hindsight is very different from real time.
Traders can also lose money on scalps that should be swings. If they lost several times earlier in the week on what they thought were good swing trades, they will be wary of swing trading on the open today. Assume that several times this week the market went far enough for a scalper's profit, but quickly reversed and stopped them out with a loss. Today, they decide to scalp every trade in the first hour. They lose on the first two scalps, but when they were stopped out on the second trade, the bar that hit the stop reversed into an outside bar and led to a very strong trend in the direction of the trade that they no longer held. Since they decided that they wanted to trade only scalps on reversals, they are on the sidelines as the market trends relentlessly, bar after bar. The trend runs for eight points before there is a pullback, and they suddenly realize that this one swing trade offered as much profit as four successful scalps.
After several days of losing when they tried to scalp because they took low-probability setups, and having given up on trying to swing because they got stopped out so often (only to miss a big trend after they gave up), they are confused and upset. They feel like they did everything right but still lost, and that trading is so unfair: “Why can other people do so well in the first hour, yet I lose no matter what I do?” It is because they are trying to do too much. They are buying at the top and selling at the bottom of the developing range, hoping for a successful breakout, denying the reality that most breakout attempts fail. They then do not take the best swing setup, because it looks weak and it looks like it will probably fail, just like the past five reversals in the past hour. When traders feel this way, they should take a break from trading the opening range until the always-in position is clear. Yes, they will be entering after the trend has already gone a couple of points and they stand to make less, but the chance of success is much greater. It is far better to win a little, but win frequently, than it is to lose several times a day while hoping to finally figure out how to trade the first hour profitably.
Traders who can scalp successfully often have to make adjustments in the first hour. In general, scalpers usually have to risk about as much as their reward, but since it is always best to begin by looking at what risk is required, they can set a reasonable reward after determining their risk. For example, if the bars in the Emini are usually about two points tall, but they are about four points tall today, a trader might have to risk about four points. The market is moving quickly and it is difficult to spend time doing exact math while trying to read the charts and to place orders. Scalpers should just quickly cut the position size in half or by two-thirds. It doesn't matter what they do. What matters is that they do it quickly, stop thinking about it, and concentrate on what is much more important: reading correctly and placing orders. If they are unwilling to use a larger stop when it is necessary, they should not take the trade. Also, once traders are in the trade and the market pulls back further than they think it should have (but does not hit their stop), and then the move resumes but looks weaker than they think it should, they have to be willing to get out at a smaller profit target. For example, the large bars might force them to risk four points instead of two on an Emini trade, but once the move has gone their way, it looks weak. If they believe that their premise is no longer valid, they have to be able to change their goal, and it is often worth exiting with just a point or two profit and then waiting for more information.
Only experienced traders, who can handle changing position, stop, and profit target sizes quickly, should attempt it. Because scalping usually requires a risk that is as large as the reward, and therefore a high winning percentage, most traders should avoid scalps, especially in the first hour. Most traders have a better chance of being profitable in the long run if they can wait for a clearly always-in market and then take a swing trade. This means that the probability of an equidistant move is 60 percent or more. They can then use a profit target that is at least as large as the risk, and preferably twice the size of the risk, and have a favorable trader's equation.
Because the first hour has many reversals, it is better to look to buy low and sell high until the market becomes clearly always-in long or short. Unfortunately, many traders do the opposite. They see large trend bars up or down and are afraid that they are missing a breakout, which almost always fails. They have to learn to wait for a confirmed breakout and a clear always-in market. Then they should switch to a swing approach and become willing to buy near the top when the market is always-in long, or sell near the bottom when it is always-in short. If traders cannot quickly distinguish swing setups from scalp setups, they should not make rash decisions. Instead, they should wait patiently for a clear always-in signal and then begin trading. Most traders cannot successfully scalp in the first hour, and certainly are unable to scalp initially and then switch to swing trading when the time is right. They should instead wait patiently for swing setups.
Since the first hour or two frequently provides setups that result in great swing trades, traders must be ready to take them. Although there is a tendency to think that the patterns are different in the first hour, the reality is that from a price action perspective, they are not. The setups are the same as during any other time of the day and on any time frame. What is different is that the volatility is often greater and therefore the patterns run further, and the reversals are often unexpectedly abrupt. It is common for reversals to look weak and have two or three weak doji bars before the trend breaks out. Realize that this is common and, if you entered and see this weakness, don't scratch out. Rely on your read because you will likely be right, and you stand to make a large swing profit.
One other difference about the open is that many trades set up based on yesterday's price action. There will often be a channel that develops in the final couple of hours of yesterday followed by either a breakout or a market gap well beyond that flag on today's open. In either case, watch for reversals and continuations. Remember, a channel is just a flag, so a bull channel is a bear flag and a bear channel is a bull flag. Also, if the market ended clearly always-in long or short, traders should assume that the trend will continue on the open until they see evidence to the contrary.
A final important difference is that the high or low of the day occurs in the first hour or so on most days, and it is beneficial to try to swing part of any trade that might be the high or low of the day. If you are in a trade with such potential and the market moves strongly in your direction, use a breakeven stop to allow yourself to collect the windfall profits that often happen off the open.
Although any reversal in the first hour or so can create the high or low of the day, the probability of any one particular reversal doing so is usually not more than 50 percent. If a trader instead waits for clear follow-through and a clear always-in move after the reversal, the probability that the reversal will be the high or low of the day is often more than 60 percent. The traders who wait for the always-in confirmation pay for that increased probability with smaller profits, but traders who prefer to take only high-probability trades are happy with the trade-off. Since the high or low of the day setup is often only 40 to 50 percent certain, it is usually a bad scalp setup, even though it has a strong trader's equation for a swing trade. The trend, as it begins, often starts slowly and does not look like a trend at all, but usually within five bars or so has a breakout into a clear always-in market. Most of the time, the setup for a bull trend day is part of a double bottom of some type, even though it is usually so imperfect that it does not look like a double bottom. Likewise, the setup for a bear trend day is usually part of an imperfect double top. For example, if there is a series of strong bull trend bars off the open and then a partial pullback that gets tested five to 10 bars later, this forms a double bottom flag entry and has a good chance of leading to a new high of the day. The breakout then might run for a measured move up and lead to a bull trend.
Traders often enter on the second bar of the day as it breaks beyond the high or low of the first bar, but the probability of a successful scalp is often under 50 percent, depending on the situation. That means that the trader's equation makes sense only for a swing, but traders often mistakenly treat the trade like a scalp, which is a losing approach when the probability is about 50 percent and the risk is as large as the reward. They convince themselves that they will swing and hold through pullbacks, but within a bar or two, they grab a small profit and feel relieved. They really intended to scalp but did not realize it, and they will wonder at the end of the month why they lost money. It is because they took a trade that had a losing trader's equation. Some reversals in the first hour have a 70 percent chance of reaching a scalper's target, but only a 40 percent chance of reaching a swing target. Traders have to know in advance how they plan to manage the trade before they take it, because changing goals after entering is a losing strategy. You can't have one premise and then manage the trade as if it was based on a different premise, but it is common for traders to confuse scalps and swings in the first hour when everything happens so quickly and the bars are large and have big pullbacks within the bars as they are forming.
The first bar of the day has about a 20 percent chance of being either the high or low of the day (except on days where there is a large gap opening, when the probability can be 50 percent or more if the bar is a strong trend bar). Also, the bar is often large, frequently about 20 percent of an average day's ultimate range. For example, if the average range in the Emini has been about 10 points and the first bar of today is two points tall, a trader who buys as the second bar breaks above the first bar has about a 20 percent chance of making eight points while risking a little more than two points. This is a losing trader's equation. If traders are very good at subjectively evaluating all of the variables and selecting trades with a higher probability, they can have a mathematical edge, but these high-probability trades based on the first bar of the day happen only about once a month. Even if traders take profits once the reward is twice the size of the risk, they will be successful only a couple of times a month, so looking for a swing entry on the second bar of the day is rarely worthwhile. However, since a reliable swing in the first hour, where the reward is twice the size of the risk, occurs on most days, if there is a strong reversal setup early on, traders should consider swinging the trade. Once the trend reaches about twice the size of their stop, they can move their stop to breakeven and swing part of the trade until there is an always-in reversal.
Sometimes the market trends for the first bar or two of the day and that first bar ends up as one of the extremes of the day. When the market trends from the open, it is important to enter early, but not necessarily on the second bar. This pattern is most common with gap openings, large or small. When you enter a trade where you might be at the start of a huge trend, it is particularly important to try to swing some contracts. If the pattern is very strong, you could swing most of your contracts and then quickly move your stop to breakeven.
However, if the strong opening is reversed (a breakout to a new extreme of the day in the opposite direction), then the day might trend in the opposite direction or it could turn into a trading range day. A strong trend off the open, even if it is reversed, still means that there were traders willing to trade aggressively in that direction, and they will be quick to trade again in that direction later in the day if the reversal falters.
If you think that a reversal down is not the high of the day, you should never be more than 30 percent certain, because you would then be at least 70 percent certain that it is not, and the market is never that certain when the opening range is forming. In fact, rarely is anything that certain at any time of the day. That edge is simply too large, and traders would quickly neutralize it long before it got that certain. Don't get too committed to an opinion, especially in the first hour, because even the strongest moves can reverse sharply on the next bar. However, although a reversal in the first couple of hours might have only a 30 to 40 percent chance of becoming the high or low of the day, if there is good follow-through, the odds can quickly increase to 50 to 60 percent.
Even though most early reversals are good for scalps and not swings, when one is particularly strong, a trader should try to swing at least half of the position. As mentioned earlier, there is a tendency for the first hour or two to be the most likely time of the day to find a trade where a trader can make two to three times the risk. In general, most traders should work very hard to take potential swing trades in the first hour or two because those trades have the best trader's equation combination of reward, risk, and probability.
Why does the market make a big move over the first several bars and then reverse? Why doesn't it simply open at the low or high of the day? The location of the open of the day is not set by any firm or group of firms; instead, it represents a brief equilibrium between buyers and sellers at the instant of the open, and it is usually determined by the premarket activity. For example, the Emini is basically a 24-hour market and trades actively, uninterrupted, for hours leading up to the open of the New York Stock Exchange. If the institutions have a large amount of buying planned for the day, why would the market ever open a stock above yesterday's close and then sell off before rallying to a new high? If you were an institutional trader and had a lot of buy orders to fill today, you would love the market to open above where you wanted to buy and then have a sharp move down into your buy zone where you could aggressively buy along with all the other institutions that likely also have lots of similar buy orders from their clients; you would then hope to see a small sell climax that will form a convincing low of the day. The lack of buying by the bullish institutions creates a sell vacuum that can quickly suck the market down into their buy zone, which is always at an area of support, where they will buy aggressively and relentlessly, often creating the low of the day.
If the reversal back up from that sell climax on the open is strong enough, very few traders will be looking to short, because there will be a general feeling that the upward momentum is sufficiently strong to warrant at least a second leg up before the low is tested, if it gets tested. Would there be anything that you, if you were an institutional trader, could do to make this happen? Yes! You could buy into the close of the premarket to push the price up and fill some of your orders. Not as much volume is needed in stocks to move the price before the 6:30 a.m. PST open. Then, once the market opens, you could liquidate some or all of your longs and even do some shorting. Since you want to buy lower, you will not start buying until the market falls to an area that you consider represents value, which will be at a support area. This is a vacuum effect. The buyers are there, but they will step aside if they think that the price will be lower in a few minutes. Why buy now if you can buy for less in a few minutes? This absence of buying despite the existence of very strong bulls allows the price to get sucked down quickly. Once it is in their buy zone, they see value and doubt the market will fall further. They appear as if out of nowhere and buy relentlessly, causing a very sharp bull reversal. The shorts will also see the support, and if they believe that the leg down is likely over, they, too, will become buyers as they take profits on their shorts.
Price action is very important. A trader wants to see how the market responds once it gets down to some key support price, like the moving average, or a prior swing high or low, or the low of yesterday, or a trend line or trend channel line. Most of the trading is done by computers, which use algorithms to calculate where these support levels are. If enough firms are relying on the same support levels, the buying will overwhelm the selling and the market will reverse up. It is impossible to know in advance how strong the buying will be, but since the support is always based on mathematics, an experienced trader can usually anticipate areas where reversals might occur and be ready to place trades. If the downward momentum begins to wane and the market starts to reverse up from the key price, institutions will liquidate any shorts and aggressively buy to fill their orders. Since most firms will have similar orders, the market will start to rally. If a firm believes that the low of the day might be in, it will continue to buy as the market rallies and will aggressively buy any pullbacks. Since its order size is huge, it doesn't want to buy all at once and risk causing a spike up and then a buy climax. Instead, it would rather just keep buying in an orderly fashion all day long until all of its orders get filled. As they get filled, the relentless buying causes the market to go up more, which attracts momentum traders who will also buy throughout the day, adding to the buying pressure.
Is this what actually happens? Traders at institutions know if this is what they do, but no one ever knows for certain why the market reverses on any given day. The reversal is due to countless reasons, but those reasons are irrelevant. All that matters is price action. Reversals often happen seconds after a report is released, but an individual trader is unlikely to understand how the market will respond to a report by simply watching CNBC. The market can rally or sell off in response to either a bullish or a bearish report, and a trader is simply not qualified to reliably interpret a report in the absence of price action. The best way to know how the market will respond is simply to watch it respond and place your trades as the price action unfolds. Very often, the bar before the report is a great setup that gets triggered on the report. If you feel compelled to trade on the release of the report, place your order and then your stop and trust your read. Since slippage can be significant on a report, it is almost always better to wait until after the report is released. If you enter on the report, you might find that you got a few ticks of slippage on the entry, and then the market violently reverses and you get additional slippage on your exit. What you thought was a trade with a risk of eight ticks ends up as a trade where you lost 16 or more ticks. If you trade thinner markets, your slippage could be much worse and you could be so far down in the first hour that you will not get back to breakeven by the close.
When the market rallies sharply on a 7:00 a.m. PST report, it is usually because the institutions were already planning on buying, but were hoping to buy lower. When the report appeared sufficiently bullish for them to believe that they would not be able to fill their orders lower, they bought on the report. If they have enough buying to do, they will continue to buy all day, and the day will become a bull trend day. If, on the other hand, their initial buying is overwhelmed by other institutions who were hoping for a rally that would allow them to short at a higher price, the upside breakout will fail and the market will trend down. These bears were invisible because they were waiting for a rally to short and their power became evident only once they began to aggressively short the rally and turn the market back down. Obviously, countless other factors are always in play, and there are huge momentum traders who have no opinion about a report and simply trade heavily in the direction of the move as it is unfolding. However, the institutional bias going into the report is an important component. The institutions already knew what they wanted to do before the report was released, although all would have contingencies if the report was a complete surprise.
About 70 percent of all trading is automated, and this computer-generated buying and selling will become increasingly important. Dow Jones & Company now has a news service called Lexicon that transmits machine-readable financial news to its subscribers. Lexicon scans all of the Dow Jones stories about stocks and converts the information into a form that the algorithms can use to make decisions to buy and sell stocks in a fraction of a second. Some of the algorithms are based on the fundamental components in the report. How many new jobs were created last month? What was the core consumer price index (CPI)? What was the bid-to-cover ratio in the bond auction? Other algorithms operate on a longer time frame and analyze stock performance and earnings statements, in addition to the news feeds, to make trading decisions. Still other algorithms are purely statistical, like if the Emini rallied 10 ticks without at most a one-tick pullback, then buy at the market and exit with a two-tick profit. Another firm might find a statistical reason to short that rally for a three-tick profit. It is impossible to know what any firm is doing, but if someone can think of an idea and it can be tested and found to be mathematically sound, their computers are probably trading it. Some firms might have algorithms that are hybrids of the fundamental and statistical approaches. Maybe if the economic number is favorable, the programs will buy immediately, but if they have statistical evidence that tells them that the Emini will then reverse to a new low after rallying three points on this particular economic number, the program might take profits and even reverse for a scalp.
Some programs use differential evolution optimizing software to generate data that is used to generate other data. They can continue to refine the data until it reaches some level of mathematical certainty, and then the result is used to automatically buy or sell stocks. Some orders are so huge that they take time to place, and algorithmic trading software breaks the orders into small pieces to conceal the trading from traders who would try to capitalize on the incipient trend. Predatory trading algorithms try to unravel what the algorithm trading programs are trying to hide. Everyone is looking for an edge, and more and more firms are using computers to find the edges and place the trades.
Since computers can analyze the data and place trades far faster than a trader can, and the computers are running programs that have a mathematical edge, it is a losing proposition to try to compete with them at the moment a report is released. These are very high-powered computers and are located very close to the exchanges, and can trade huge volumes in a fraction of a second. The result is price movement that is often too fast to read. In fact, the price movement can be so fast that your computer at home may be several seconds behind what is actually taking place. Too often the moves are very large in the first second or two, only to reverse a few seconds later, and then maybe reverse again. Traders simply cannot make decisions and place orders fast enough to trade this situation profitably. It is better to wait to see if a clear always-in move comes from the report and then trade in that direction. When your opponents have an edge over you—in this case, speed—it is better to wait for their edge to disappear before trading again. Most traders should not trade in the seconds after a report but should wait for the price action to return to normal, which often takes one to about 10 minutes.
No one knows in advance whether the sum total of all the buy orders at all of the major institutions would be enough to overwhelm the institutions that were looking to short, or whether the shorts represented vastly more dollars and would be able to drive the market down. On most days, the action is two-sided for a while as the bulls continue to buy and the bears continue to sell. The market probes up and down in buy and sell vacuums, looking for one side to take control over the market when the market reaches an extreme. When it is low enough, strong bulls, who have been waiting for the market to reach a level that they see as value, will buy aggressively. The market then races up to an area where the bulls no longer feel that the price represents good value, and they stop buying and begin to take profits. The strong bears, who have been waiting for higher prices to sell, appear out of nowhere and short aggressively. At some point, one side decides that they are unwilling to continue trading aggressively at the current price, and this creates an imbalance that allows the other side to begin to move the market in their direction. The losing side begins to cover, and this adds to the trend. The winning side sees the market moving their way and they add to their positions, creating a stronger trend. At some point, they will begin to take profits and this will result in a pullback. Once the market comes back far enough to represent value to these firms, they will once again begin to add to their positions and the result will usually be a test of the trend's extreme.
Sharp reversals are common on economic reports, and the reversals may not make sense to you, but that is irrelevant. How can a bullish report lead to a rally and then seconds later be followed by a new low of the day? If the market was so bearish a couple of minutes ago, how can it be so bullish now? Don't give it any thought. Instead, just look for standard price action setups and trade them mindlessly without giving any consideration to the reasons why the reversal is taking place. All that you need to know is that it is in fact taking place and you must enter. You don't need to understand it, but it is important to realize that it can happen quickly and you might not react fast enough to avoid losing money.
Although the 5 minute chart is the easiest to read and the most reliable, the 3 minute chart trades well, particularly in the first hour. However, it is prone to more losers, and if you like the highest winning percentage and don't want the negative emotion that comes from losing, you should stick to trading the 5 minute chart and work on increasing your position size.
As a trader, it is best to keep your analysis simple, especially in the first hour when the market is moving quickly. The vast majority of opens are related to the price action of the final hour or so of the prior day and take the form of a breakout, a failed breakout, a breakout pullback, or a trend from the open, and any of these can move very fast.
One of the most difficult aspects of day trading is maintaining focus. Most traders simply cannot stay intensely connected to the market for the entire session, and they succumb to boredom and distractions and often suspect that this is a major obstacle to them becoming consistently profitable. And they are right. The first hour provides you with a great opportunity to remedy this problem. Even if you think that watching every tick or at least every 5 minute bar is impossible for you for an entire day, you might believe that you can do it for an hour. This has to become one of your primary goals because it is a great way to make money. The volume is huge and there are several trades every day in that first hour. If you simply trade the first hour and increase your position size once you become consistently profitable, you might discover that the intensity is needed for only that hour. Then, for the rest of the day, just look for two or three major reversals, which you can almost always anticipate 10 or more minutes in advance, especially if you are waiting for second entries (once you see the first one, get ready to take the second, which will usually follow within a few bars). Once you can trade the first hour well, look to trade the first two hours, which usually provide the best trading of the day and can very often give you all of the profit that you expect from the entire day.
When trading around holidays like Christmas week and the week of the Fourth of July, the first hour is often very important because often that is the only time when the market behaves like a normal day. It then frequently enters a tight trading range for the rest of the day. If you want to trade around holidays, you have to be particularly alert to setups in the first hour.
When trading the 5 minute chart, it is easy to not be thinking about the many institutional traders who are also paying attention to 15 minute charts. The first 15 minute bar closes at the close of the third 5 minute bar and therefore activity around this third bar will influence the appearance of the first 15 minute bar. For example, if the first two bars of the day move in one direction and then the third bar is a smaller pause bar, the breakout of the bar will determine whether there is a 15 minute breakout or there could be a failure. Therefore, trading the breakout of the third bar of the day often leads to a big move. Do not place a trade on the third bar alone on most days, but be aware of its extra significance. If it is an important bar, there will usually be other price action to support the trade, and that additional information should be the basis for the trade.
Similar logic can also be used for the last 5 minute bar of the 30 and 60 minute charts (for example, the 60 minute chart is made of 12 bars on the 5 minute chart, so the final one closes when the 60 minute bar closes), but focusing on such longer time frames and their infrequent entries increases the chances of missing one or more profitable 5 minute trades and therefore is not worthwhile.
Barbwire represents two-sided trading, and when it develops in the first hour, it often will be followed by a day where bulls and bears alternate control of the market. If there is a trend after the barbwire, there will usually be a tradable countertrend setup at some point.
The first bar of the day often shows what the day will be like. If it is a doji in the middle of a tight trading range from the final hour of yesterday and the moving average is flat, the odds favor a trading range day. If the bar is a trend bar but has prominent tails, it is a one-bar trading range. Since most trading range breakouts fail, the market will probably not be able to move above or below the bar for more than a bar or two before there is a reversal. Some traders fade the breakouts of the first bar if it has prominent tails, and they will scale in once or twice. For example, whether the market gaps up or down or has a bull or bear body, if the tails are fairly prominent, many traders will short above the bar and buy below the bar for a scalp, since they know that reversals usually dominate the first hour and that the breakout of a trading range, even if the trading range is a single bar, is likely to fail. Therefore, they bet that it will fail and trade in the opposite direction. Since they see that bar as a one-bar trading range, they are in trading range mode, which means that they will usually scalp most or all of their position.
The next several bars can also show the bias of the day. If dojis continue and there are five reversals in the first hour, the odds of a trading range day go up. If there is a large gap opening and the market trends for the first four bars, the odds of a trend day are good. Traders will be ready for a trend from the first bar trend, and those first bars might be the spike of a spike and channel trend day. However, they will be ready if the first pullback becomes a small final flag. This can lead to a spike in the opposite direction, a breakout of the opposite end of the opening range, and then a trend in the opposite direction.
The strongest swing trades in the first couple of hours come from a confluence of patterns, but the patterns are sometimes subtle and traders should look for them before the open and think about what might happen. Always consider both the bull and bear case for everything, because there is smart money on both sides. As always, traders are looking for breakouts and failed breakouts. For example, was there an 18-bar long bear flag at the end of yesterday that pulled back to the bear trend line, and if so, did today open just below the bear flag and below the moving average, creating a breakout of the flag, but then rally for two bars to the moving average where it formed a bear reversal bar? If so, this is an opening reversal down at the moving average and a breakout pullback short, after a test of the bear trend line, with a good signal bar, creating a high probability swing (and scalp) short. The more factors that are present, the higher the probability, and when there is a swing setup with a high probability, the setup is very strong. Alternatively, did yesterday end with a bull breakout from a 25-bar long trading range in a three day weak bull trend that had a wedge shape, and was the market near the top of a two week long trading range, and did the breakout have two legs up and did the market close at the trend channel line above the three day wedge rally? Is so, did today open a few ticks below the close of yesterday, trade up, and then reverse down into a strong bear reversal bar, creating a second entry sell signal on the failed breakout above yesterday's high and the trading range (a likely final flag) and above the top of the wedge bull channel? If so, this is a high probability swing (and scalp) short.
FIGURE PIII.1 Failed Early Reversal

The market often abruptly reverses after the first few bars, but always be prepared for the reversal to fail and set up a breakout pullback. As shown in Figure PIII.1, bar 1 was the third bar of the day and it was a small bull reversal bar. It reversed up from the moving average and a swing low from yesterday. This was a great opening reversal long entry, and it also prevented the first 15 minute bar from being a strong bear trend bar.
The market had four consecutive bull trend bars starting at bar 1. After the second one, some bulls started placing buy limit orders at the low of the prior bar, expecting the first attempt to reverse down to fail. They were filled on the small bear bar that formed three bars after bar 2.
The next day, bar 3 also reversed a swing low from the day before and led to a scalper's profit, but the bull entry bar reversed down in a two-bar reversal for a short entry. Note that bar 3 was a bear trend bar and not a strong reversal bar, so this was not a good countertrend long setup. The bulls were hoping for a wedge reversal, where the first two pushes occurred in the final couple of hours of yesterday. However, bar 3 and the bar before it were small trading range bars. The bars were too small and lacked sufficient bullish strength to have much chance of reversing that strong sell-off. The bulls tried to create that strength on the bar after bar 3, but the bears quickly reversed the market down with an even larger bear trend bar.
The break below the bar 3 low was also a break below the first 15 minute bar of the day on a day with a large gap down, increasing the odds of a tradable downswing.
Notice that yesterday's close was just below its open and well below the high of the day. This created a reversal bar on the daily chart, even though it had a small bull body. Some traders who trade off of the daily chart would then have placed sell stops to go short if today fell below yesterday's low. Because there were so many traders willing to sell down there, the market gapped down today and traded below yesterday's low on the first bar, triggering the sell signal on the daily chart. The breakout attempted to fail at bar 3, but the reversal up failed and created a double top bear flag and breakout pullback short, with an entry below the bar 4 two-bar reversal.
FIGURE PIII.2 The First Few Bars Can Set the Tone
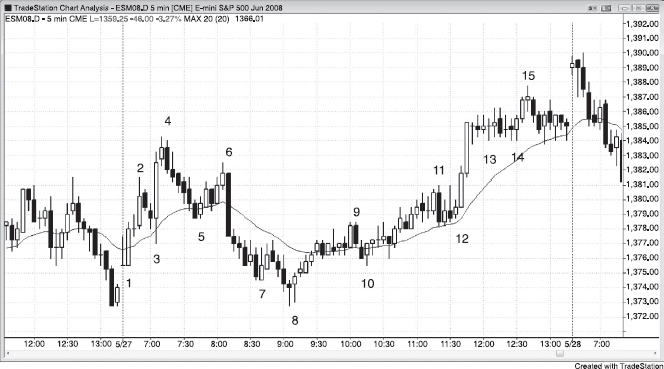
As shown in Figure PIII.2, the price action in the first several bars often foreshadows what happens later. The rally from the open to the bar before bar 4 had several large bull bars and only two small bear bars, showing that the bulls were willing to be aggressive. This was something to remember later in the day in case another buy setup appeared. Keeping that in mind, traders should have been more willing to swing part of their longs because the trend was more likely to resume.
The high of the day usually comes from some kind of double top that rarely looks like a double top. Here, bar 6 was the end of a second test up and therefore was the signal for a double top short. Bar 4 became the possible high of the day. Bar 8 was a double bottom with the closing low of yesterday, and it formed the low of today. Even though the probability of a successful swing on an opening reversal might be only 40 percent, many of the trades result in a small profit or a small loss. These small trades usually balance out, and the 40 percent that reach four or more points become the source of a trader's profit. Trading these opening moves should be a cornerstone for most traders as they try to build a business in day trading.
Experienced scalpers expect most breakout attempts to fail, and look to buy low and sell high in the first hour or two. Possible scalps included: selling above the first bar, which was a doji bar, and scaling in higher (exiting the first entry at breakeven and the second and third entries with a profit); buying above the bar 1 bull trend bar; shorting below the bear inside bar that followed bar 2 (a failed breakout above the trading range of yesterday); buying on bar 3 as it broke above the high of the prior bar (since the spike up to bar 2 was strong and was likely to be followed by a second leg up); shorting below the two-bar reversal that followed the bar 3 breakout to a new high of the day (a low 2 short); and shorting below the bar 6 bull trend bar, since it was a two-legged breakout of the bear micro channel down to bar 5 and the bottom of the strong bear micro channel down to bar 5 was likely to be tested.
Bar 8 was a successful second attempt to reverse the breakout to a new low of the day and a double bottom with the close of yesterday, so it was likely to lead to a rally that had at least two legs. In fact, the two-legged rally only had a small sideways pause and therefore the move up was mostly in a channel. When a rally is mostly in a channel, even if there is a pause and a small second leg, most traders will see the entire channel as the first leg and expect a more obvious second leg to follow. The move up to bar 11 was just an extension of that channel with no significant pullback, and therefore many traders would have considered the rally from bar 8 to bar 11 to be just one leg. However, as with most channels, there were many overlapping bars, prominent tails, and bear trend bars. A bull channel is a bear flag, so traders were looking for a downside breakout, which could have led to a pullback that was large enough to make traders believe that the first leg up was clearly over. They then needed to decide whether a second leg up was still likely or the correction had lasted long enough for the bears to feel that the market would not go much higher, thereby convincing them that this was a good price level to again aggressively short. Instead of breaking to the downside, the market broke strongly to the upside and the bears who had been shorting for the past couple of hours had to quickly buy back their shorts. The bulls saw how strong the bull spike was, and they bought at the market all of the way up because when a spike is this strong, the odds favor higher prices.
Bar 12 was a high 2 buy for a second larger leg up, which also had two smaller legs.
FIGURE PIII.3 Don't Scalp Stocks with Small Ranges
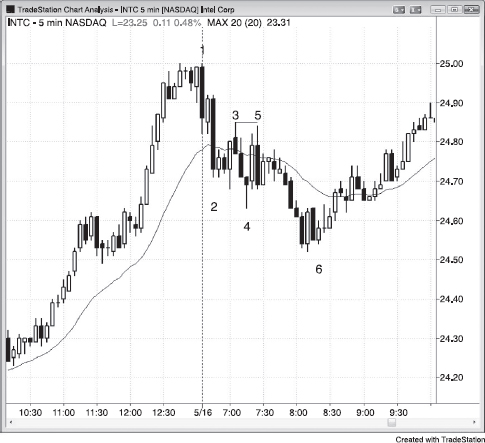
Traders should not often scalp stocks with average daily ranges under a dollar, but price action entries still work. As shown in Figure PIII.3, Intel (INTC) had two large bear trend bars in the first 15 minutes and then formed a double top bear flag (bars 3 and 5). This is a reliable pattern that often leads to a bear trend day, and here it led to a spike and climax bear trend. Yesterday's bull trend was so strong that today's two-legged selling reversed back up at bar 6, likely at the moving average on the 15 or 60 minute charts, but it was good for at least a 10 cent scalp.
Whenever the moving average is as steeply up as it was yesterday, any strong sell-off below it will almost always be followed by a tradable rally back up. Bar 6 was the signal for a double bottom bull flag with yesterday's 11:35 pullback from a strong spike up. It then formed an even stronger bull spike into the close and the entire move up became a spike and climax bull trend. Since the second spike is comparable to the channel in a traditional spike and channel bull trend, its bottom usually gets tested, as it did here.
FIGURE PIII.4 Early Barbwire Often Leads to a Trading Range Day
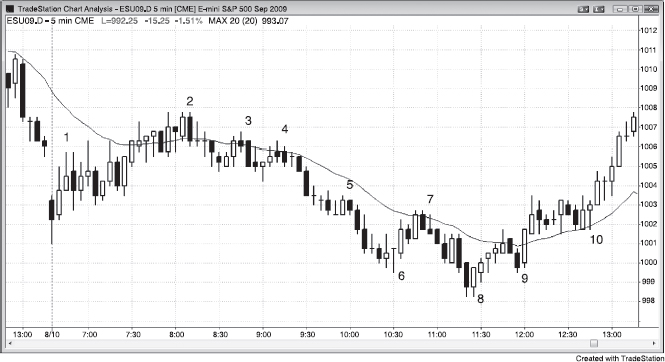
Barbwire type (tight trading range with big tails and big bars) of trading with prominent tails, overlapping bars, and many reversals for the first 90 minutes of the day is a sign of intense two-sided trading and uncertainty, and the day usually becomes a trading range day. As shown in Figure PIII.4, today was a trending trading range day, but since the market closed at the top of the upper trading range, it was also a bull reversal day.
When barbwire develops at the open, it is usually followed by tradable swings in both directions at some point in the day. By the third bar of the day, barbwire was likely because about half of its range was overlapped by the prior bar and it closed in its middle, meaning that the following bar would also likely overlap about half of its range. The barbwire continued right through the entire weak rally to bar 2. It was followed by a break of the bear trend line, a lower high, and then a second entry to the lower high at bar 4, which formed a double top with bar 3. The breakout to the downside over the next several bars made a trending trading range likely, especially since the range to that point was only slightly more than half of that of recent days and was likely to increase in a channel down after the spike. Traders were looking for a downside breakout and then a measured move down for their swing shorts. The downside breakout made the market always-in short, and follow-through selling was likely. The channel down to the bar before bar 6 was likely the start of a trading range. Bar 9 was the first of a two-bar bull spike after the higher low, and once that spike completed, most always-in traders would have concluded that the market was then always-in up.
The rally to bar 7 broke the bull trend line and was followed by a lower low and a two-bar reversal buy entry at bar 8, and then the bar 9 higher low rally into the close.
The two consecutive bull trend bars at bar 1 were enough for some bull scalpers to place buy limit orders at the low of bar 1 and protective stops below the bull bar before it. They got long on the bear bar that followed and could have scalped out with one or two points of profit over the next couple of bars.