3
Salvation from Small Stocks
History is a better guide than good intentions.
—Jeane Kirkpatrick
Lucky for us—given the rather meager prospects for the S&P 500—the market is made up of more than large-cap stocks. Small-cap stocks are the little engines that could, and as we’ll see in this chapter, hold much greater promise than large-cap stocks in the coming twenty years. Traditionally, small-cap stocks are those with market capitalizations between $200 million and $2 billion. Stocks with capitalizations below $200 million are micro-caps, which most institutional portfolio managers remove from consideration when buying small-cap stocks because of their large bid-ask spreads and resulting trading illiquidity. Typically, once a stock’s market cap rises above $200 million, bid-ask prices decline and liquidity improves dramatically.
Table 3–1 breaks down the equity market by market capitalization and shows the number of issues available in each category. The list includes only stocks with enough liquidity to be broadly purchased. Interestingly, while large-cap stocks make up nearly 75 percent of the market’s capitalization there are only 368 stocks in the category, but there are thousands of stocks in the small-and mid-cap categories that make up the remaining 25 percent of the equity market.
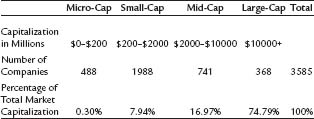
TABLE 3–1 INVESTABLE U.S. STOCK UNIVERSE: ALL STOCKS IN COMPUSTAT DATABASE WITH AVERAGE LIQUIDITY OF $500,000 PER DAY, APRIL 2005
If you wanted your portfolio to simply mirror the market, you would invest 75 percent in large-cap stocks, and 25 percent in small-and mid-cap issues. Most investors’ portfolios are even more heavily skewed to large-cap stocks, with just a tiny percentage invested in the more populous small-and mid-cap categories.
Small Stocks Generally Outperform Large Stocks
In the past, small-cap stocks have performed significantly better than their large-cap brethren. Happily, we also have historical data on small-cap stocks, enabling us to analyze their performance in the same way we analyzed the performance of large-cap stocks. To study the performance of smaller stocks, I use the Ibbotson U.S. inflation-adjusted Small Stocks Index. (Details on how this index is constructed and calculated can be found in the note at the end of this chapter.)
Figure 3–1 shows the terminal value of one dollar invested in both large-and small-cap stocks from June 30, 1927, through December 31, 2004. As in chapter 2, I am using real, not nominal returns, thereby taking the effects of inflation into account. Over those seventy-eight years, small-cap stocks did approximately four times better than large-cap stocks, turning one dollar into $1,058, a real average annual compound return of 9.4 percent. The higher returns, however, come at a price—small stocks are historically more volatile than large stocks, making investors suffer through a wilder ride as payback for the higher returns.
Why Small Stocks Have a Performance Advantage
Small-cap stocks have a performance advantage over large stocks for a variety of reasons. Primary among them is the neglected firm effect. Because there are thousands of stocks in this category, many are not widely followed by Wall Street’s analysts. Smaller stocks are therefore less likely to be as efficiently priced as the more exhaustively researched large-cap stocks. When you have fewer analysts researching a company’s or industry’s prospects, it’s much more likely for great earnings and growth potential to go unnoticed. This, in turn, creates buying opportunities for savvy investors.
Another reason small-cap stocks outperform larger stocks is simply because they are smaller. A company with $200 million in revenues is far more likely to be able to double those revenues than a company with $200 billion in revenues. With large companies, each increase in revenues becomes a smaller and smaller percentage of overall revenues. Small stocks, on the other hand, have a much easier time delivering great percentage growth in revenues and earnings.
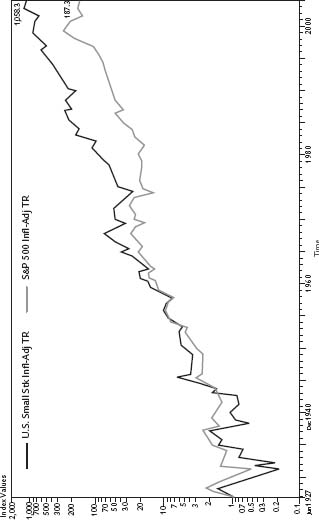
FIGURE 3–1
Figure 3–2 shows the real twenty-year average annual compound returns of large-and small-cap stocks between June 1947 and December 2004. As the graph shows, small-cap stocks traditionally outperform large-cap stocks in most twenty-year periods. The average small-cap real rate of return for all twenty-year periods analyzed is 10.42 percent. The best twenty-year real rate of return of 17.91 percent occurred during the twenty years ending June 30,1952. The worst twenty-year real rate of return was 3.62 percent, which occurred during the twenty years ending November 30, 1948.
Note how much better the worst-case scenario is for small-cap stock returns. Large-cap stocks had two twenty-year periods where they did little better than break even, yet the worst twenty-year period for small-cap stocks still doubled an investor’s money. Small stocks so consistently beat large stocks that researchers have come to believe that there should be a premium paid to people who invest in small-cap stocks. For example, over the 691 rolling twenty-year periods, small stocks outperformed the S&P 500 84 percent of the time.
The Small-Cap Premium
When you look at all rolling twenty-year periods between 1947 and 2004, you see that on average small-cap stocks compound at a premium of 3.12 percent over large-cap stocks. That may not sound like much, but it really adds up over time. For example, assume two investors have $10,000 IRA accounts; one invests in large stocks and the other invests in small stocks. Over the next twenty years each investor earns an average return for each group(7.3 percent for the large stock investor and 10.42 percent for the small stock investor). After twenty years, the large stock investor would have a portfolio worth $40,926 but the small stock investor would have $72,603! See? That 3.12 percent adds up.
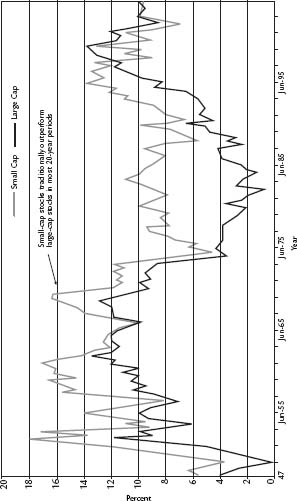
FIGURE 3–2 REAL ROLLING 20-YEAR AVERAGE ANNUAL COMPOND RETURNS, LARGE STOCKS AND SMALL STOCKS, JUNE 1947–DECEMBER 2004
But as figure 3–3 also shows, the small-cap premium has historically been quite variable—while it averages 3.12 percent for all twenty-year periods, it has been as low as-3.09 percent and as high as 8.89 percent. Looking at figure 3–4, we see that the small-cap premium has an inverse relationship with large-cap stocks’ total returns: when large stocks are doing particularly well, the small-cap premium is low or negative, and when large stocks are performing poorly, the small-cap premium is usually above its long-term average. For example, during the market bubble in the mid-1960s, the small-cap premium was nonexistent, with small stocks doing worse than large stocks over the previous twenty years. Conversely, if you look at the early 1980s when large stocks were struggling to offer any returns whatsoever, the small-cap premium was above 8 percent.
This point is extremely important to keep in mind when projecting where small stocks might go over the next twenty years. When you look at figure 3–4, you see that, on a relative basis, the twenty years ending March 31, 1999, was the worst period for small-cap stocks in history, with the largest gap between large stocks’ returns and the small-cap premium ever. Reversion to the mean suggests that these two paths will cross again, as large stocks’ performance heads down toward its historical mean and small-cap stocks’ performance heads back up toward its historical premium. This has already begun—as of December 2004, the small-cap stock premium is once again in positive territory.
Further proof can be found during the period between 1968 and 1982, the last time large-cap stocks did poorly for an extended period of time. Over that same time period, small-cap stocks held their own. Between December 31, 1968, and December 31, 1982, an investment in the S&P 500 had a real rate of return of-1.06 percent per year, turning a one dollar investment made at the end of 1968 into just 86 cents fourteen years later. An investment in small stocks, however, compounded at a real rate of 3.65 percent over the same period, turning one dollar into $1.66 by the end of 1982.
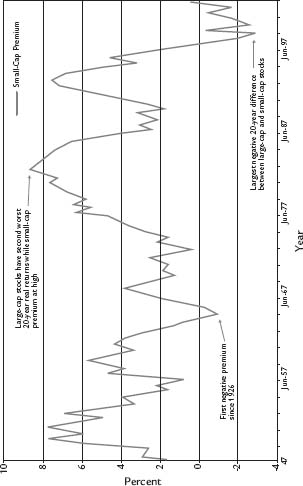
FIGURE 3–3 REAL SMALL-CAP PREMIUM: EXCESS RETURN OF SMALL-CAP STOCKS LARGE-CAP FOR ALL ROLLING 20-YEAR PERIODS, JUNE 1947–DECEMBER 2004

FIGURE 3–4 REAL SMALL-CAP PREMIUM VERSUS REAL TOTAL RETURNS FOR LARGE-CAP STOCKS. ROLLING 20-YEAR RETURNS, JUNE 1947–DECEMBER 2004
The Pitfalls of Real Time
It’s much easier singing the praises of small-cap stocks in 2005 than it was in 1999, however. I issued my first call for the excellent long-term prospects of small-cap stocks on January 1, 1999, in an article published on my company’s Web site called “Looking Back to the Future: History Says Buy Small Stocks Now.” Back then, small stocks had performed abysmally compared to the sizzling performance of large-cap growth and technology stocks. They were truly the ugly ducklings of most investors’ portfolios. Many respected advisors thought that investors would be better off totally excluding small-cap stocks from their portfolios! Here’s what I wrote then:
Since 1994, the stock market has been extraordinarily biased toward big-cap growth stocks. Virtually all of the returns generated by the S&P 500 this year are due to the stunning performance of just a handful of big growth stocks—the top 10 performers in the index accounted for 56% of the S&P 500’s returns through the end of November. If your large-cap stock wasn’t a Microsoft, Pfizer or Lucent, chances are it was flat for the year. As for stocks outside the big-cap growth arena, this year’s market has been a virtual wasteland. Value and small-cap stocks have suffered terribly…. And if you want to see really bad, all you have to do is take a look at small-cap stocks. Those laggard big-cap value strategies look positively wonderful when compared to the plight of small-cap stocks. The small-capRussell is down more than 7% as of December 24, 1998. And even that figure masks the true shellacking the average small stock has endured—25% of the stocks in the Russell are down more than 50% from their highs this year! And if you look at our O’Shaughnessy Small-Cap Universe (7,964 stocks with market-caps below $1 billion), you’ll see a median loss of 15.07% between January 1, 1998 and November 30, 1998.
With this sad state of affairs in the value and small cap categories, some wonderful opportunities have been created. The PE differential between the Russell and the S&P 500 is at an historic low of .78 (it usually trades at a much higher premium of 1.1 or more). This means small-cap stocks are extremely cheap compared to large-cap growth stocks. Unfortunately, most investors focus on the trees rather than the forest. They look at what has performed best recently—and expect the trend to continue. Rarely do they study the past—and look what happened after big stocks have had their run. And that is the strategic investor’s crucial advantage. By looking at history, we know that the last time large stocks outperformed small stocks for a-20-year period, the small fry went on to dominate for years. Since 1928, there were only four 20-year periods (out of a possible 51) when small stocks lagged large stocks. Someone understanding this important historic relationship between small and large stocks would see that small stocks are a great opportunity right now.
Let’s say you know that, over 20-year periods, small stocks almost never do worse than large stocks. And let’s say you use such an occurrence as a signal to buy small stocks aggressively. The first time small stocks lagged large stocks for 20 years was in 1964. Over the ensuing 4 years, small stocks’ performance exploded. Look at these returns:
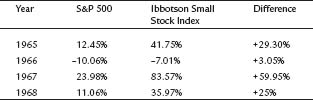
Someone investing $10,000 in small stocks at the start of 1965 would have $32,901 at the end of 1968, a gain of 229% in just four years! The same $10,000 invested in the S&P 500 returned a comparatively modest 39%, with $10,000 growing to just $13,926.
I find the current valuations of small stocks extremely compelling. But no one rings a bell and announces it’s time for us to move from big-cap growth stocks to small-cap stocks. It takes foresight and courage to buck the big-cap growth trend, yet that is what history is telling us to do. So, as if on cue for our investment philosophy, Winston Churchill said: “The further backward you can look, the farther forward you are likely to see.”
While I will address the psychological ramifications of this article in chapter 6, its important message is that small stocks had no popular support from investors at the time, having seriously disappointed them over the prior twenty years ending in 1999. Investors’ mind-sets at the time made it nearly impossible for them to buy small-cap stocks, much less buy them with enthusiasm. Anyone who understood the importance of mean reversion would have seen 1999 as a screaming buying opportunity, yet after the article’s publication the response I received from investors was a big yawn. They were so focused on what had been working recently in the market—i.e., large-cap growth stocks—that they were blinded to the opportunity. As you try to make good investment decisions for the future, you will be confronted by this situation time and again. Say that by the time you read this, small stocks are in a short-term downtrend. I can virtually guarantee that you will be very tempted to ignore the long-term data and be more enticed by those stocks that have been performing well most recently. If so, you will be missing a wonderful opportunity, just as investors did in 1999.
Small-Cap Stocks Ascendant
The good news for long-term investors is that even with their recent strong performance, small-cap stocks are still a great opportunity. As we saw in figure 3–4, they are emerging from the largest performance gap from large-cap stocks in history. While large-cap stocks were recently dangerously above their long-term average, small-cap stocks are in the Promised Land—emerging from a twenty-year period in which their performance was one standard deviation below their long-term average.

TABLE 3–2 RETURNS AFTER EXTREME 20-YEAR REAL RETURNS
As I did with large stocks, I’ll segregate the small-cap stocks by one standard deviation of return and look at the times when they were well above or below their long-term average, then examine their returns twenty years later. Over all rolling twenty-year periods, the average real annual compound return for small stocks is 10.42 percent. The standard deviation is 2.94 percent, so I’ll look at the times when small stocks returned less than 7.48 percent and more than 13.35 percent over the previous twenty years. Table 3–2 and figures 3–5 and 3–6 summarize the results.
For the sixty-two overlapping rolling twenty-year periods when small stocks compounded at 7.48 percent or less, twenty years later the minimum return was 11.76 percent, the maximum 16.75 percent, and the average 14.03 percent. As figure 3–5 details, twenty years after turning in low returns for investors, small stocks returned more than 13 percent per year over the next twenty-year period 68 percent of the time! And they always provided returns in excess of the twenty-year average after low return periods. Conversely, after the 112 times when they turned in returns much higher than their long-term average, the minimum return twenty years later was 4.69 percent; the maximum was 12.15 percent and the average 8.38 percent. Figure 3–6 shows that twenty years after great performance, returns from small stocks fell between 4 and 11 percent 98 percent of the time.
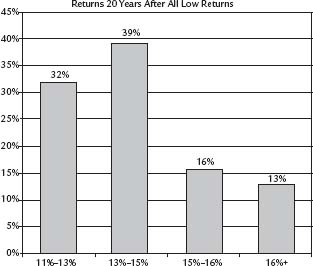
FIGURE 3–5 REAL RETURN DISTRIBUTIONS 20 YEARS AFTER SMALL-CAP STOCK RETURNS ARE ONE STANDARD DEVIATION BELOW LONG-TERM AVERAGE
The good news is that as recently as March 2003, small stocks’ returns were in the historically low range: their returns over the twenty years ending in March 2003 were 6.91 percent, more than one standard deviation below their long-term mean. This means that if they are to revert to their longer-term mean over the next twenty years, small stocks have an excellent chance of doing substantially better than large stocks. For now, I will take a conservative position and simply assume that they will deliver their historic 3.12 percent premium, plus a 1.50 percent premium to account for the fact that their recent twenty-year return was more than one standard deviation below their seventy-eight-year average.
My resulting forecast for small-cap stocks is an annual real rate of return between 7.6 and 9.6 percent over the next twenty years. If that doesn’t sound particularly impressive, compare the terminal value of a twenty-year investment in large-cap stocks earning between 3 and 5 percent annually and small-cap stocks earning between 7.6 and 9.6 percent. If you invested $10,000 in large-cap stocks and earned 3 percent per year, your portfolio would be worth $18,061 in twenty years. If, however, you invested the same $10,000 in small-cap stocks and earned 7.6 percent a year, your $10,000 would grow to $43,437. If you earned the higher forecasted returns for each, the large-cap stocks would grow to $26,533 and the small-caps to $62,776. In chapters 8 and 9 I’ll show you how to further enhance the performance of a small-cap portfolio. For now, keep in mind that all these return assumptions are quite conservative and approximate what I expect broad small-cap indexes like the Russell 2000 to compound in the years ahead.
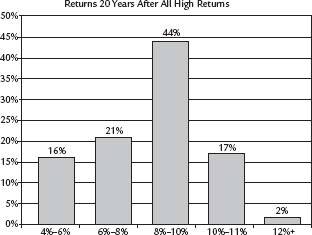
FIGURE 3–6 REAL RETURN DISTRIBUTIONS 20 YEARS AFTER SMALL-CAP STOCK RETURNS ARE ONE STANDARD DEVIATION ABOVE LONG-TERM AVERAGE
New Methodology
It’s important to note that I’ve changed my methodology since last publishing my research. In my previous books, I averaged the historical returns for the strategies I advocated, then simply assumed that you could earn similar returns into the future, provided your investment horizon was a long one. In light of this new work, my earlier approach appears naïve. I now feel it is better to look at how much better or worse any given investment performs in relationship to its benchmark, and then make forecasts based upon this difference. For example, I am projecting that the large-cap stocks that make up the S&P 500 will compound at 3 to 5 percent per year over the next twenty years, then add the 3 to 5 percent to the expected small-cap premium to forecast small-cap performance.
This method allows us to make forecasts that take current market dynamics into account, rather than simply assuming that we will be able to earn the average returns that we’ve seen over long periods in the past. After all, we’ve just lived through a tremendous bull market, and it would be foolish to assume that we can continue to generate double-digit returns in a far more trying market environment.
Chapter Three Highlights
- Small-cap stocks traditionally outperform large-cap stocks, with average returns 3.12 percent higher in any rolling twenty-year period.
- To maintain a neutral exposure to market capitalization, 25 percent of your portfolio should be invested in small-and mid-cap stocks and 75 percent should be in large-cap stocks. However, given my forecasts for large and small stocks over the next twenty years, this may not be an optimal allocation of assets.
- The small-cap premium is inversely proportional to the total returns generated by large-cap stocks. When large stocks are doing particularly well, the small-cap premium is low to negative, whereas when large stocks are doing poorly the small-cap premium is above average. We are just now coming off the largest differential between the two in history. Expect both to continue reverting to their long-term means.
- In the sixty-two periods in which small stocks did substantially worse than their long-term average, the average return twenty years later was 14.03 percent and all returns were higher than the long-term average. On March 31, 2003, small stock returns were 6.91 percent per year for the prior twenty years, one standard deviation below their long-term average.
- Our most conservative forecast for small stocks over the next twenty years is 7.6 to 9.6 percent per year—nearly double that of large-cap stocks. We’ll see in later chapters how investors willing to use specific investment strategies within the small-cap category can further enhance their expected returns.
Note
To calculate his Small Stocks Index, Roger Ibbotson used multiple sources: For the period between 1926 and 1981, he used the historical series developed by Professor Rolf W. Banz. This is composed of stocks making up the fifth quintile (i.e., the ninth and tenth deciles) of the NYSE, which are the smallest 20 percent of stocks by market capitalization. The portfolio was first formed and ranked as of December 31, 1925, and held for five years, with value weighted portfolio returns calculated monthly. Every five years, the portfolio was rebalanced to again include stocks falling in the ninth and tenth deciles by market capitalization. This process enabled Ibbotson to avoid survivorship bias by including the return after a delisting or failure of a stock. From 1982 to 2004, Ibbotson uses the Dimensional Fund Advisors (DFA) Small Company 9/10 Fund. The fund is a market value weighted index including the ninth and tenth deciles of the NYSE, plus stocks listed on the AMEX and OTC with similar market capitalizations. The fund’s returns include transaction costs.