8
Roll Your Own: Using Stock Selection Strategies to Improve the Odds
Take the course opposite to custom and you will almost always do well.
—Jean-Jacques Rousseau
Having made my case for the wisdom of investing in small-cap stocks and large-cap value stocks over the next twenty years, let’s now review how you may further enhance a portfolio of these broad categories of stocks. In my book What Works on Wall Street, I examined fifty-three years of data to see which stock selection strategies consistently outperformed the market. My research revealed that there were many strategies that provided far higher returns than simple indexes like the S&P 500 or a small-cap index like the Russell 2000. In this chapter, I will examine two large-cap value strategies, a large-cap growth strategy with a value parameter, and two small-cap strategies. This will give you the ability to concentrate your portfolio in the styles that should work best over the next two decades while improving returns by utilizing superior strategies. I will also look at an all-capitalization strategy that has historically provided excellent returns with low levels of risk. Readers interested in a more thorough evaluation of a full spectrum of strategies should consult the third edition of What Works on Wall Street.
Just like when we reviewed the rolling twenty-year real rates of returns of the S&P 500 and the Fama/French–style indexes, it is vital to examine as much data as possible for these stock selection strategies. For all but three, we have fifty-three years of annual data and forty-one years of monthly data. Remember that because of the “noise” generated through shorter-term market gyrations, it is only the fullness of time that allows superior strategies to reveal themselves. It’s vital to understand that the day-to-day ups and downs of a strategy have little bearing on how it will perform over longer periods of time. I am always looking for strategies that have outperformed their indexes over all rolling three-, five-, ten-, and twenty-year periods. And to show you how certain strategies can serve as excellent proxies for the indexes we examined, let’s start with the one for which we have the most data.
The Dogs of the Dow: An Excellent Ten-Stock Proxy for the Fama/French Large Value Index
The first strategy we’ll look at is the “Dogs of the Dow,” which is made up of stocks from the Dow Jones Industrial Average. Created in 1928 by the editors of the Wall Street Journal, the modern DJIA consists of the thirty companies that the editors deem to be the best representatives of large, well-known U.S. corporations. Currently, it includes such household names as American Express, Citigroup, Coca-Cola, GE, GM, Intel, and Microsoft. The average is continually updated to include the largest titans of corporate America. Because of its long history, we have a hefty seventy-six years of data to examine for the Dogs of the Dow strategy. I published my original research on this strategy in Barron’s in 1992 in an article entitled “High Yields, High Rewards: An Uncomplicated Way to Beat the Market.”
The strategy is as simple as they come. Once a year, you rank the thirty stocks in the Dow by their dividend yield and buy the ten stocks with the highest yields. After doing so, you wait one year, re-rank the stocks by dividend yield, and replace those stocks that have fallen off the list with the new highest-yielding stocks. Despite its utter simplicity, this ten-stock strategy has beaten the S&P 500 in all but three rolling ten-year periods between 1929 and 2004, and even then it only slightly underperformed the S&P 500. Better yet, the strategy outperformed the S&P 500 in all rolling twenty-year periods. Its returns are extremely similar to those of the Fama/French Large Value Index reviewed in chapter 4.
Over the seventy-six years between December 31, 1928, and December 31, 2004, the Dogs of the Dow strategy provided a real average annual return of 8.63 percent, turning one dollar invested at the end of 1928 into $541.50 by the end of 2004. Over the same period, the Fama/French Large Value Index provided a real average annual return of 8.24 percent, turning one dollar into $410.84, and the S&P 500 had a real average annual return of 6.29 percent, turning one dollar invested into $103.43. As measured by the standard deviation of return, the risk of the Dogs of the Dow strategy was 21.06 percent, similar to the 20.04 percent risk of the S&P 500. Thus, on risk-adjusted basis, the Dogs of the Dow strategy is more attractive than the Fama/French Large Value Index, which had a standard deviation of return of 27.05 percent. Figure 8–1 shows the real growth of one dollar for all three strategies.
Now look at the Dogs of the Dow strategy’s twenty-year rolling returns. The lowest return was 2.92 percent; the highest was 14.35 percent and the average for all rolling twenty-year periods was 10.07 percent. Note that with large-cap value strategies like this, you can buy as few as ten stocks and still have an adequately diversified portfolio. (With the smaller capitalization strategies we’ll look at later in the chapter, you’ll need to own more stocks in order to reduce volatility.) Figure 8–2 shows the rolling twenty-year real rate of return for the Dogs of the Dow and Fama/French Value Index. Note here that because we only have annual data for the DJIA back to 1928, the graph is less inclusive than those using monthly data featured earlier in the book.
Dogs of the Dow Twenty-Year Outlook
The Dogs of the Dow strategy is an extremely effective way to buy out-of-favor blue-chip stocks that also offer high dividend yields. Because its historical returns are very similar to those of the Fama/French Large Value Index, my forecast for the high-yielding Dow stocks is the same as that for large-cap value stocks, specifically a real rate of return between 6.03 and 8.03 percent over the next twenty years. As I write this in the summer of 2005, the stocks include GM, Verizon, Merck, Citigroup, and Coca-Cola and the ten-stock list sports a current dividend yield of 4.1 percent. I’ll explain how you can find and buy the high-yielding Dow stocks in chapter 12.
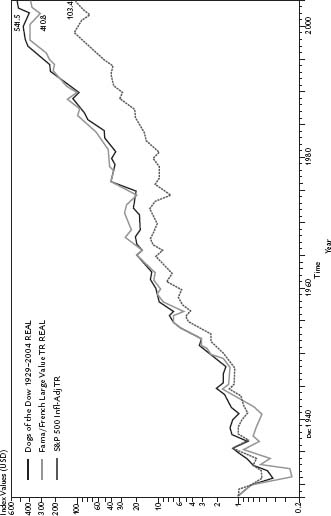
FIGURE 8–1 TERMINAL VALUE OF $1 INVESTED IN 1929
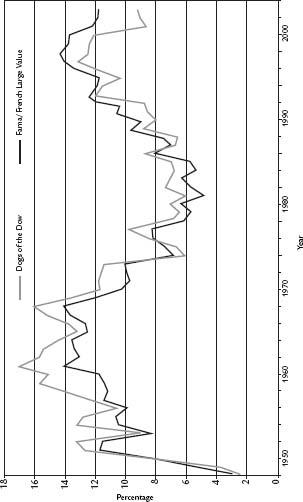
FIGURE 8–2 REAL ROLLING 20-YEAR AVERAGE ANNUAL COMPOUND RETURNS, 1948–2004 1950
Improving on Large-Cap Value Returns
I’ll now look at another simple strategy that has offered significantly higher returns than the simple Dogs of the Dow dividend yield strategy. Because it was created using the S&P COMPUSTAT database, I only have data going back to 1951 for this strategy. Featured in What Works on Wall Street, this Market Leaders Low Price–to–Cash Flow strategy buys the ten market-leading companies with the lowest price–to–cash flow ratios. I define market-leading companies as nonutility stocks with greater than average market capitalization, shares outstanding, cash flow, and sales 50 percent greater than the average stock. Applying these factors to the COMPUSTAT database I used for What Works on Wall Street leaves just 6 percent of the stocks from the entire COMPUSTAT universe qualifying as Market Leaders. It is important to note that Market Leaders allow the inclusion of American Depository Receipts (ADRs), which are dollar-denominated overseas shares that trade in the United States. Thus, giant companies like Germany’s Deutsche Telekom, Japan’s NTT, and the United Kingdom’s British Petroleum are available for consideration. This is an important distinction, especially when comparing performance with the S&P 500 and the French and Fama Value Index, which are made up of only U.S. companies. In the new global economy, the ability to purchase shares of companies domiciled outside the United States might be an advantage. Indeed, the number of ADRs in the Market Leaders universe has grown considerably over time—in 1995, they made up approximately 20 percent of the universe, whereas at the end of 2004 they accounted for approximately 35 percent.
After creating the universe of market-leading companies, we sort the universe by price–to–cash flow and buy the ten stocks with the lowest price-to-cash flow ratios to create the Market Leaders Low Price–to–Cash Flow portfolio. Once a year, we update the strategy, replacing any stocks that have fallen off the list with the new lowest price–to–cash flow large-cap stocks. Over fifty-three years this strategy has significantly outperformed simple large-cap value indexes.
For the fifty-three years between December 31, 1951, and December 31, 2004, the strategy provided a real average annual compound return of 14.33 percent, turning one dollar invested in 1951 into $1,211.06 at the end of 2004. That’s significantly higher than the return of the Fama/French Large Value Index, which earned a real average annual compound return of 9.69 percent over the same period. One dollar invested in the Fama/French Large Value Index grew to $134.74 over the same period. For comparative purposes, the S&P 500 earned a real average annual compound return of 7.43 percent over the period, turning one dollar invested in 1951 into $44.68 at the end of 2004. Figure 8–3 shows the returns for each of the strategies. Risk, as measured by the standard deviation of return, was higher for this strategy than the Fama/French Large Value Index: this strategy’s standard deviation was 25.55 versus 21.93 for the Fama/French series.
Twenty-Year Rolling Results Better than Fama/French Index and Forecast
When we extend the holding period to twenty years, we see that Market Leaders Low Price–to–Cash Flow has consistently done much better than both the S&P 500 and the Fama/French Large Value Index. Remembering that we have more limited data and must start the rolling twenty-year real compound returns analysis in 1971, we see that the minimum return was 6.64 percent per year; the maximum return was 17.91 percent per year and the average real average annual compound return was 12.47 percent. Figure 8–4 shows the rolling twenty-year real compound returns for the strategy and the Fama/French index. On average, this strategy did 3.33 percent better than the Fama/French index for all rolling twenty-year periods. Adding this premium to our forecast for the Fama/French Large Value Index (between 6.03 and 8.03 percent annually over the next twenty years), I arrive at an expected rate of return for stocks meeting the Market Leaders Low Price–to–Cash Flow requirements of between 9.36 and 11.36 percent through 2022–2025.
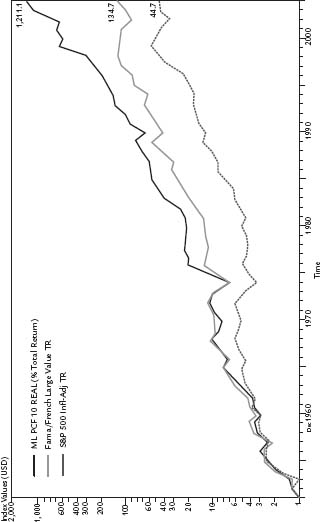
FIGURE 8–3 TERMINAL VALUE OF $1 INVESTED IN 1952
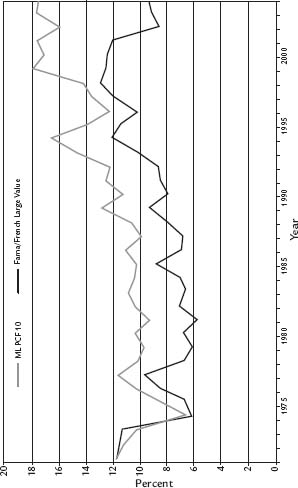
FIGURE 8–4 REAL ROLLING 20-YEAR AVERAGE ANNUAL COMPOUND RETURNS, 1971–2004 1975
Caveats for Concentrated Strategies
Things look much improved when you use style-specific strategies, but each strategy comes with several caveats. First, even though these are all large-cap stock strategies, when you own only ten stocks you should expect greater volatility than you would experience with a more broadly diversified index. For example, year-to-year volatility can be high, as 1990 demonstrated—in a year when value stocks did poorly, this strategy lost 26.69 percent while the S&P 500 dropped a more modest 8.74 percent. If you have a true twenty-year time horizon, you should be prepared for dispersion like this. Happily, however, this dispersion is found more often at the other extreme, as in 2003 when this strategy’s stocks soared 87.7 percent compared to a more modest rise of 26.32 percent for the S&P 500.
The second caveat is that these types of strategies tend to choose companies that appear rather ugly to investors at first blush. For example, the current list is concentrated in the rather dowdy and unappealing automobile and steel companies. You’ve got to get used to buying stocks like GM, U.S. Steel, Korea Electric Power Corporation, POSCO, and Mittal Steel Company if you want to reap the rewards from this strategy.
Finally, you will face many shorter periods of time when this strategy is out of favor and styles like large-cap growth are on fire. It will take a huge amount of willpower on your part to stay the course over the short term. Do not discount the need for this fortitude should you decide to enhance your returns with individual strategies.
A Large Capitalization Growth Strategy: Market Leaders Growth
Even though my forecast for traditional large-cap growth stocks is the lowest of my estimates, I still believe you should invest a portion of your portfolio in large-cap growth stocks. Why? Because as we advance through the next twenty years, there will invariably be short periods when large-cap growth stocks are on fire, and we will want to be able to participate in those returns. Time and again my research has shown that you can do significantly better than traditional large-cap growth indexes and mutual funds if you add valuation constraints to the portfolio. One of the reasons all of those large-cap growth stocks lost more than 90 percent after the bubble was that their price valuations had hit the stratosphere. The 90 percent drop can be compared to the hangover that follows a wild night on the town. Many of the popular stocks had no earnings, and when they did their PE ratios often exceeded 200 times earnings. As we’ve learned, those types of stocks have very sexy stories, yet they inevitably come crashing back to earth. Therefore, we’ll look at a large-cap growth strategy with an all-important value component in an attempt to avoid that nasty hangover.
We start with the same Market Leaders universe, but now we will add the following considerations:
- 1. Price-to-sales ratios must be less than the average for Market Leaders;
- 2. Earnings for the prior twelve-month period must exceed those of the prior year;
- 3. Buy the ten stocks that have the best twelve-month price appreciation.
This leads us to a selection of market-leading companies that have both earnings and price momentum, but nevertheless are still reasonably priced.
Since we are adding one year with the earnings requirement, we can only review fifty-two years of data and our rolling twenty-year real return analysis will start in 1972. For the entire period between December 31, 1952, and December 31, 2004, the ten-stock Market Leaders Growth strategy earned a real average annual return of 13.24 percent, turning one dollar invested into $641.60 at the end of 2004. The same investment in the Fama/French Large Growth Index earned a real average annual return of 6.47 percent, with one dollar growing to just $26.05. Risk was higher with the Market Leaders Growth strategy—it had a standard deviation of return of 24.42 percent compared with 18.84 percent for the Fama/French Large Growth Index. For comparative purposes, the S&P 500 returned a real average annual rate of 7.25 percent, with one dollar growing to $38.08. It also had the lowest risk of the three: 17.94 percent. Figure 8–5 graphs the returns for each of the strategies.
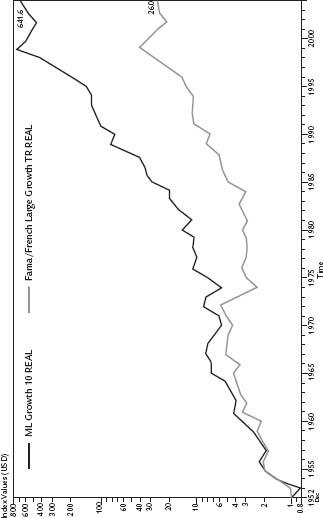
FIGURE 8–5 TERMINAL VALUE OF $1 INVESTED IN 1952
Twenty-Year Rolling Results Better than Fama/French Index and Forecast for the Next Twenty Years
The strategy’s rolling twenty-year returns are also very strong. The worst return the Market Leaders Growth strategy experienced over twenty years was a real annual return of 5.39 percent per year, the best was a real annual return of 23.35 percent, and the average was 12.49 percent. The average return for all rolling twenty-year periods was 7.4 percent higher than the 5.1 percent return of the Fama/French Growth Index over the same period. This becomes our forecast for this strategy over the next twenty years. In chapter 4 I forecasted returns for traditional large-cap growth stocks through 2022–2025 between 1.97 and 3.97 percent, so I will add this strategy’s average 7.4 percent premium over large-cap growth to come up with a forecast of average annual returns between 9.37 and 11.37 percent over the next twenty years. Figure 8–6 shows the rolling twenty-year returns for the strategy and the Fama/French Large Growth Index.
It is worth noting that this forecast is virtually identical to that of the large-cap value Market Leaders Low Price–to–Cash Flow strategy, perhaps because it includes a value parameter. In the next chapter we’ll see that the two strategies are often out of sync with one another, with one soaring while the other swoons. Prudent asset allocation will allow us to eke even more return out of each strategy.
Small Capitalization Strategies
Now let’s look at some small-cap strategies that have also significantly enhanced index returns. I’ll review an extremely aggressive micro-cap strategy that looks for value stocks on the mend and a less aggressive small-cap value and growth strategy. Like our large-cap growth strategy, all of the small-cap growth strategies will feature value carburetors to prevent us from paying too much for a stock. Also, to tame the inherent volatility of small-cap strategies, we’ll need more diversification than with the large-cap variations, so here we will look at twenty-five-stock rather than ten-stock portfolios.
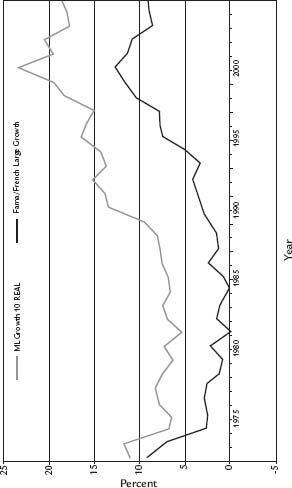
FIGURE 8–6 REAL ROLLING 20-YEAR AVERAGE ANNUAL COMPOUND RETURNS, 1972–2004 ML Growth 10 REAL
Tiny Titans
Tiny micro-cap stocks have several unique features that make them ideal for aggressive investors. First, as with small-cap stocks, it’s virtually impossible for Wall Street analysts to give adequate coverage to micro-cap stocks. It’s not worth their time to do deep research on such a large number of tiny-cap stocks. As a result, they also offer the highest upside. Second, micro-cap stocks have lower correlations with other capitalization categories. For example, while small stocks in general have an average correlation with the S&P 500 of 0.74 between 1952 and 2004, micro-caps have an even lower correlation of 0.66. This means that the performance of the S&P 500 has much less impact on micro-caps than it would on other stocks. Finally, micro-caps are extremely volatile and best suited to investors willing to accept dramatic ups and downs in their portfolios.
Let’s start with the most aggressive strategy, which I call the “Tiny Titans.” It buys stocks with market capitalizations between $25 million and $250 million that are both cheap and moving in price. To generate the twenty-five Tiny Titans stocks, you start with all stocks with market capitalizations between $25 million and $250 million. From this list, you remove any stocks that have a price-to-sales ratio greater than one. Finally, you buy the twenty-five stocks that have the highest twelve-month price appreciation and equally weight them. Like all of the strategies featured here, you hold them for one year and then repeat the process.
Tiny Titans is a very simple strategy that packs quite a wallop—for the fifty-three years between December 31, 1951, and December 31, 2004, the strategy had a real average annual return of 18.92 percent, turning one dollar invested in 1951 into $9,734.85 by the end of 2004! Our small-cap index offered a real average annual return of 10.44 percent per year over the same period, turning one dollar invested in 1951 into $192.85 at the end of 2004. One reason that this strategy performs so well is that you are unlikely to have heard of any of the companies it selects. I had heard of only one from the current list—Owens Corning—and that’s because it used to be a big company that got sued into bankruptcy over asbestos claims. The others include Able Energy, Rural/Metro Corp., Core Molding Technologies, and the enigmatically named ENGlobal.
Before you rush out the door to put all of your money into the Tiny Titans strategy, I must emphasize the enormous risk that it entails. Its standard deviation of return is a whopping 38.83 percent, compared to 24.94 percent for our small stock index. That means that 95 percent of all annual returns from the strategy will fall between a loss of 53.04 percent and a gain of 102.28 percent! Yes, the strategy has offered awesome returns over the last fifty-three years, but you must ask yourself if you could realistically stomach a loss of more than half of the value of your portfolio in a single year. As I repeatedly point out in my other books, for most people the answer is no. In any event, as I’ll cover in the next chapter, this strategy should only make up a small percentage of your overall portfolio. Figure 8–7 shows the returns of the strategy compared with our small-cap index.
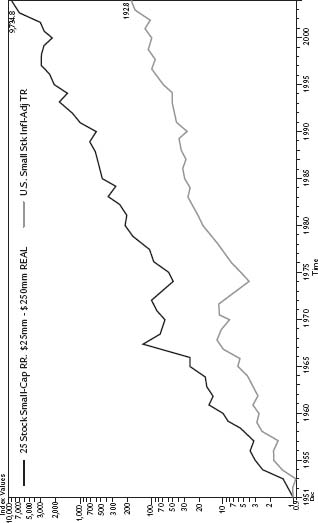
FIGURE 8–7 TERMINAL VALUE OF $1 INVESTED IN 1951
Twenty-Year Rolling Results Better Than Small Stocks Index and Forecast for the Next Twenty Years
The Tiny Titans strategy turned in some stunning numbers over all rolling twenty-year periods between 1971 and 2004—the lowest twenty-year real average annual compound return was 8.44 percent per year, the highest was 25.63 percent, and the average was 16.35 percent. In contrast, the rolling returns for our small capitalization index for the same period found a minimum return of 4.68 percent per year, a maximum return of 14.12 percent per year, and an average of 9.26 percent per year. Figure 8–8 shows the strategy’s rolling twenty-year real rates of return compared with our small-cap index.
Thus, the Tiny Titans strategy outpaced standard small-cap returns by 7.09 percent per year for all rolling twenty-year periods. Since my forecast for small-cap stocks is an annual real rate of return between 7.6 and 9.6 percent over the next twenty years, the forecast for this strategy is between 14.69 percent and 16.69 percent per year through 2022–2025. Chapter 12 will cover how you can find stocks meeting these criteria should you want to put together your own portfolio.
A Small Capitalization Growth and Value Strategy
In the world of small-cap stocks, we’ve found that a strategy with both value and growth characteristics works very well. Here, we will be looking at the more traditional small stocks with capitalizations between $200 million and $2 billion. These stocks are less volatile than micro-caps, and offer excellent returns by combining value and growth. With this strategy, we will require that:
- 1. Market capitalization is between $200 million and $2 billion (inflation-adjusted) at the time of purchase;
- 2. Price-to-sales ratio is less than 1.5;
- 3. Earnings are higher than in the previous year;
- 4. From 1963 forward, three-and six-month price appreciation is above average;
- 5. We buy the twenty-five stocks with the best twelve-month price appreciation.
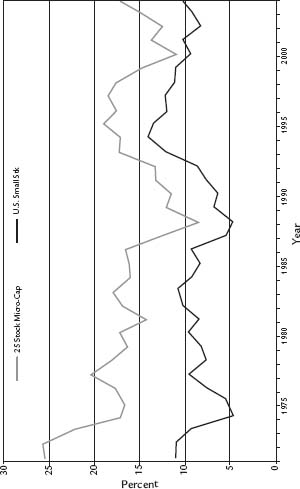
FIGURE 8–8 REAL ROLLING 20-YEAR AVERAGE ANNUAL COMPOUND RETURNS, 1971–2004 25 Stock Micro-Cap
This strategy essentially focuses on cheap stocks on the mend. They are cheap because we won’t pay more than 1.5 times sales; they are on the mend because their earnings are higher than in the previous year and their prices are rising. Because we require that stocks have earnings higher than in the previous year, we lose one year of data and therefore will be looking at the fifty-two years between December 31, 1952, and December 31, 2004. During that time, this Small-Cap Growth strategy provided a real average annual return of 15.55 percent, turning one dollar invested in 1952 into $1,839.50 by the end of 2004. Our small-cap index had a real average annual return of 10.60 percent over the same period, turning one dollar into $188.33. The risk of this strategy was slightly higher than that of the small-cap index, with a standard deviation of return of 27.58 percent compared with 25.14 percent for the index. Figure 8–9 shows the real returns for the strategy compared with our small-cap index.
Twenty-Year Rolling Results Better Than Small Stocks Index and Forecast for the Next Twenty Years
Like the micro-cap strategy, this Small-Cap Growth strategy has excellent rolling twenty-year real rates of return. The minimum real twenty-year rate of return for the strategy during the 1972–2004 period was 7.88 percent, the maximum was 18.63 percent, and the average was 14.11 percent. Over the same period the minimum real twenty-year real rate of return for the small-cap index was 4.68 percent, the maximum was 14.12 percent, and the average was 9.20 percent. Figure 8–10 shows the real rolling twenty-year rates of return of each.
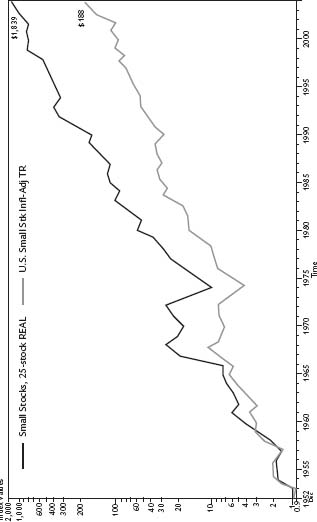
FIGURE 8–9 TERMINAL VALUE OF $1 INVESTED IN 1952
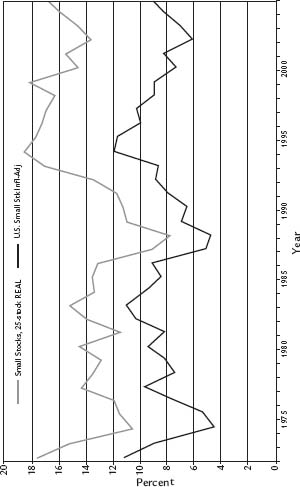
FIGURE 8–10 REAL ROLLING 20-YEAR AVERAGE ANNUAL COMPOUND RETURNS, 1972–2004 1975
Thus, for all rolling twenty-year periods, this Small-Cap Growth strategy had a performance advantage of 4.91 percent over the small-cap index. Adding this to my forecast for small-cap stocks gives us a forecasted real gain between 12.51 and 14.51 percent per year through 2022-2025.
A Less Volatile All-Cap Value Strategy with a Growth Twist
The final strategy we’ll look at is a combination strategy that requires a stock to have several characteristics in common. I developed this strategy in an effort to reduce the overall variability of a portfolio’s return. This All-Cap Value with a Growth Twist strategy is the first all-capitalization strategy we’ll review, and is a good addition to pure-play small-to large-cap strategies. With data back to December 31, 1956, we only have forty-eight years of annual data to analyze for this strategy. Nevertheless, it demonstrates excellent performance with much lower risk than the micro-cap strategy.
We begin with all stocks in the COMPUSTAT database with market capitalizations exceeding an inflation-adjusted $200 million. That gives us a universe of liquid, easy-to-trade names. From this group, we will only consider stocks that:
- 1. Are in the bottom three deciles by price-to-sales ratios the 30 percent of stocks with the lowest PSR);
- 2. Are in the bottom three deciles by price–to–cash flow ratio (the 30 percent of stocks with the lowest price-to–cash flow ratios);
- 3. Are in the top three deciles by dividend yield (the 30 percent of stocks with the highest dividend yields);
If more than twenty-five stocks make it through the first three criteria, we will then buy the twenty-five stocks with the best twelve-month price appreciation.
As with the other strategies, we will hold the names for one year, and annually rebalance the portfolio.
Between 1956 and 2004, this All-Cap Value with a Growth Twist strategy provided a real average annual return of 12.66 percent per year, turning one dollar invested on December 31, 1956, into $305 at the end of 2004. Our small-cap index provided a real average annual compound return of 10.15 percent over the same period, with one dollar growing to $103.50 over the same period. By comparison, the S&P 500 returned a real average annual return of 6.28 percent per year, with one dollar invested at the end of 1956 growing to $18.58 by the end of 2004.
What’s more, this strategy took less risk than the small-cap index, providing the superior returns with a standard deviation of return of 22.14 percent, compared to 24.97 percent for the small-cap index. Thus, its risk-adjusted rate of return was dramatically higher than that for the small-cap index or the S&P 500. Figure 8–11 shows the returns for each strategy.
Twenty-Year Rolling Results Better Than S&P 500 and Forecast for the Next Twenty Years
The good news for this All-Cap Value with a Growth Twist strategy is that it never had a twenty-year period when it underperformed the S&P 500. Between 1978 and 2004, the minimum real return was 9.08 percent per year, the maximum was 15.93 percent, and the average was 12.31 percent. Over the same period and using annual data, the minimum return for the S&P 500 was 0.84 percent, the maximum was 13.34 percent, and the average was 6.03 percent.
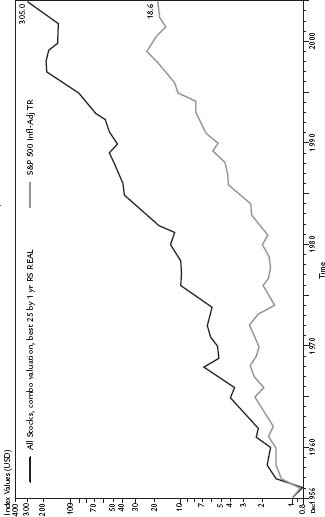
FIGURE 8–11 TERMINAL VALUE OF $1 INVESTED IN 1956
Thus, adding this average advantage to my projection for the S&P 500, we arrive at a twenty-year forecasted rate of return for this strategy between 9.28 and 11.28 percent.
Using Stock Selection Strategies Instead of Indexes
The stock selection strategies covered in this chapter can significantly enhance your portfolio’s returns. You must, however, understand that there will be times when any given strategy will do significantly worse than its benchmark index and other strategies. For example, I used to run the O’Shaughnessy Cornerstone Growth Fund, a mutual fund that utilized the Small-Cap Growth strategy featured in this chapter. (The fund is still available through the Hennessy Funds.) During Wall Street’s speculative fever between 1996 and 2000, the fund’s small-cap stocks weren’t keeping up with the technology and growth stocks dominating the big-cap S&P 500.
I received many dismaying e-mails and phone calls from investors who were upset that the fund was lagging the S&P 500 and NASDAQ indexes. And while the fund was doing significantly better than the Russell 2000, its appropriate benchmark, investors were still disgruntled by its performance compared to that of the large-cap indexes.
The most important thing to remember with any carefully chosen investment strategy is that there will always be times when they underperform other strategies or other segments of the market. It is only those investors who can keep their focus on the very long term who will be able to reap the rewards of a long-term commitment to an intelligent strategy. Successful investors must keep their guard up and resist the urge to let what the market is doing today influence their investment decisions.
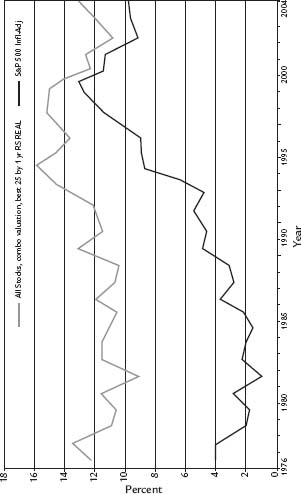
FIGURE 8–12 REAL ROLLING 20-YEAR AVERAGE ANNUAL COMPOUND RETURNS, 1978–2004 1976
Chapter Eight Highlights
- You can significantly improve your returns from each investment style by using stock selection strategies that have demonstrated superior returns over long periods of time.
- Concentrated portfolios are acceptable with large-cap strategies. With small-cap strategies, you need to own a greater number of stocks to reduce overall volatility. With the large-cap strategies, you can use ten-stock portfolios. Small-cap strategies require a minimum of twenty-five stocks to achieve adequate diversification.
- Growth strategies that include value parameters do much better than traditional growth stocks alone, because they exclude overvalued and overhyped stocks. Traditional growth strategies are extremely volatile because they allow very high valuation stocks to be purchased. Historically, this has led to significant underperformance.
- Each of the strategies covered here can be used to meet the allocations recommended in this book.