11
Allocating Your Assets: The Best Portfolios for the Next Twenty Years
To be conscious that you are ignorant is a great step to knowledge.
—Benjamin Disraeli
It is now time for us to put our new knowledge to work. How you allocate your portfolio can make a material difference to your total future returns. We’ve analyzed both the trends that will likely unfold over the next twenty years and the types of investment vehicles available; let’s now build portfolios that take maximum advantage of each. In this chapter I’ll show you how to use the allocations in any account, be it a 401(k), IRA, or regular brokerage account. I’ll also explain how you can use the stock selection strategies from chapter 8 to build a custom portfolio. You can also work with your advisor to use the suggested allocations as a framework for your equity portfolio allocations. Remember that a good advisor may offer additional investments like foreign equities, commodities, and hedge funds that will enable you to further diversify your portfolio and enhance returns over the next twenty years.
We’ll first look at what your portfolio might be worth if you simply leave it invested in a classic mix of large-cap core stocks (like the S&P 500) and large-cap growth stocks (still the dominant holding for many investors), thereby ignoring the trends I believe will unfold over the next two decades. We’ll then look at two separate allocations designed to maximize returns over the next twenty years, one for more conservative investors and one for more aggressive investors seeking to maximize their returns. I will refer to this more aggressive portfolio as the preferred allocation, as it is the one that I believe takes the fullest advantage of the trends identified in this book. Finally, we’ll see how much better you can do if you use the stock selection strategies featured in chapter 8, and how simple changes in asset allocation can affect your portfolio.
Assumptions
For the sake of clarity, I will make some simplifying assumptions here. First, I assume a steady-state forecasted return over the next twenty years. While this is certainly not what will happen, it is the best way to analyze portfolios over the long term. In reality, returns are quite variable over time. You will see style and capitalization groups move in and out of favor, and those short-term gyrations will test your mettle. I’m also quite certain that at some point in the next twenty years, the allocations and strategies I recommend here will be near the bottom of the pack over shorter periods of time. Never underestimate the regret you will feel in times like these or the strength of will that staying the course will require.
Second, I’ll be looking at gross returns, not returns net of fees and taxes. Since taxes and fees will be different for everyone, there is no truly accurate way for me to take them into account in this discussion. That does not mean taxes and fees aren’t very important factors to consider—they are. As we saw in chapter 10, taxes can wreak havoc on your portfolio’s final value, so if you are using a taxable account, you should adjust your expectations accordingly. You should also try to take long-term rather than short-term gains, as they are taxed at a far lower rate. All of the stock selection strategies featured in chapter 8 use a one-year holding period, but if you sell a holding after one year plus one day, it will be considered a long-term gain. I also exclude management fees in this gross return analysis. Obviously, if you are a do-it-yourselfer you are going to pay lower fees than someone working with an advisor; in either case you’ll want to adjust the gross returns featured here to reflect your own situation. Keep in mind that if you are using traditional mutual funds, you should deduct the fund’s expense ratio from your expected return, just as you should deduct any advisor fee. Many advisors and mutual funds now show pro forma analysis net of fees—ask for it.
Finally, I’ll be looking at the returns to a lump-sum investment of $100,000. Obviously, this is not the way that a majority of investments are made, and it will tend to understate the returns you might actually earn. This is because a lump-sum calculation does not take any ongoing contributions into account. If you are using a 401(k) or IRA you will in all likelihood be making yearly investments, typically buying less when stock prices are high and more when they are low (the central tenet of dollar cost averaging). Nor does the lump sum calculation reflect the advantages of cash flow into your portfolio when the time comes to rebalance. The brilliance of rebalancing is that it forces you to take money away from the previous year’s strongest performing asset classes and put money into those that have performed the worst. This enforces a buy-low, sell-high methodology which is actually intensified when you continually add money to your portfolio. I will give an example of this effect later in this chapter.
Equity Allocations
Let’s first look at portfolios that are just invested in stocks. Since I believe that stocks will outperform bonds over the next twenty years—even with the lower forecasts for certain equity sectors—you should invest the bulk of your portfolio in equities to maximize your returns. Later in this chapter we’ll look at when you should include bonds, which may become more attractive investments if bond yields rise in years to come.
A Conventional Allocation
For the first allocation, let’s look at a portfolio rooted in traditional allocations of the past. It will invest 50 percent in large-cap core stocks (we’ll use the S&P 500 as a proxy), 40 percent in large-cap growth stocks, and 10 percent in small-cap stocks. We’ll rebalance the portfolio annually to keep this mix constant. Figure 11–1 shows the constant balance the portfolio will hold over the period.
Between June 30, 1927, and December 31, 2004, a portfolio with this 50-40-10 mix would have earned a real annual return of 7.09 percent, with an overall standard deviation of 21.71 percent. One dollar invested in this portfolio in 1927 would have been worth $201.45 at the end of 2004. From a rolling twenty-year perspective, the lowest twenty-year real return this allocation ever experienced was a real gain of 0.89 percent per year; the highest was 14.03 percent and the average was 7.36 percent.
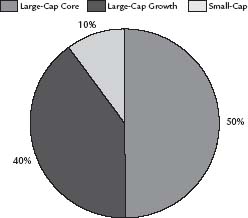
FIGURE 11–1 TRADITIONAL EQUITY ASSET ALLOCATION
Let’s now look at how this allocation is likely to perform over the next twenty years. Remember that our forecasted real return for the S&P 500 (core large-cap equities) is a mere 3 to 5 percent, for large-cap growth it is 1.97 to 3.97 percent, and for small-cap stocks it is 7.62 to 9.62 percent. Given these expectations, let’s look at what might happen. If this traditionally allocated portfolio achieved returns in line with our minimum expectations, it would be worth $182,373 in twenty years (in 2005 dollars) but worth $267,868 if returns came in at the high end of expectations. That’s a real annual return of between 3.05 and 5.05 percent for the portfolio. Notice that this return is nearly the same as a portfolio that was 100 percent invested in the S&P 500. That’s because the 10 percent allocation to the higher-returning small-cap stocks is not large enough to make a meaningful difference to the portfolio’s overall performance.
Remember that this 50-40-10 allocation is a classic portfolio that millions of investors currently use to save for their retirement or other goals. I think that many of these investors would be shocked to learn of their portfolio’s limited potential over the next twenty years. If you’re forty-five years old and have $100,000 in your 401(k) invested in a similar fashion, it is sobering indeed to think that in twenty years you will have only earned $82,000. Let this serve as a wake-up call and an incentive to choose a better allocation for the future.
The Conservative Portfolio Allocation
If my arguments about mean-reversion and where the markets are headed have convinced you, but you still worry about the volatility of the more promising small-cap stocks, you can still take advantage of the twenty-year trends by moving 25 percent of your portfolio to small-cap stocks and 75 percent to large-cap names. This is the more conservative path. The difference between the conservative and preferred portfolio allocations is the percentage invested in small-cap stocks. While they have the highest expected rate of return over the next twenty years, they also have the highest volatility. This means that along with a larger allocation to small-cap stocks comes increased risk and increased potential reward. Note that with both the conservative and preferred portfolio allocations, I limit the large-cap growth exposure to 15 percent, with 60 percent of the large-cap allocation going to value stocks. Recall that I expect large-cap growth to underperform in the coming two decades. It is, however, prone to short bursts of strong performance, so a 15 percent allocation is high enough to have a meaningful impact on a portfolio when large-cap growth is in favor, yet small enough to prevent any significant drag on performance.
For the conservative portfolio allocation, we will take advantage of the higher expected returns from large-cap value stocks rather than the more volatile small-caps. The conservative portfolio mix is 25 percent small-cap stocks, 60 percent large-cap value stocks and 15 percent large-cap growth stocks. Figure 11–2 shows the allocation. As before, we’ll annually rebalance the portfolio to maintain these percentages. Historically, this mix earned a real annual return of 8.77 percent between 1927 and 2004. Over this period, one dollar invested grew to $673.12, with a fairly high standard deviation of return of 27.72 percent. From the perspective of rolling twenty-year returns, the worst twenty-year period for this conservative allocation was a real annual return of 2.50 percent; the best was 16.33 percent and the average 9.97 percent. Reviewing our twenty-year forecasts for each category, we see that large-cap value stocks should earn between 6.03 and 8.03 percent, large-cap growth stocks between 1.97 and 3.97 percent, and small-cap stocks between 7.62 and 9.62 percent.
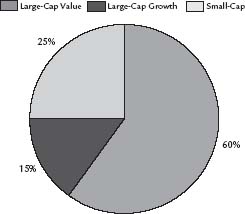
FIGURE 11–2 CONSERVATIVE ALLOCATION
By using these forecasted returns, we see that this conservative mix offers a much improved expected return over the next twenty years. Should we earn returns consistent with the minimum expected forecasted returns, the $100,000 lump-sum portfolio would be worth $310,911 (in 2005 dollars) in twenty years’ time, a real annual return of 5.84 percent. If we earned returns at the maximum expected returns, the portfolio would be worth $452,109, a real annual return of 7.84 percent, some 60 basis points higher than the S&P 500’s twenty-year rolling returns over the last seventy-five years. When we get to the allocations using specific stock selection strategies, we’ll see that you can earn even higher returns with lower volatility. The important lesson here is that with this conservative mix of mostly large-cap value stocks, you can expect to earn a return slightly higher than that of the S&P 500 in all rolling twenty-year periods.
The Preferred Portfolio Allocation
The only difference between the conservative and preferred allocations is the percentage of small-cap stocks in the portfolio, now with a 35 percent rather than a 25 percent allocation. We will lower the large-cap value stocks’ allocation to 50 percent and maintain the 15 percent large-cap growth allocation. Figure 11–3 details the portfolio allocation. This 10 percent increase in small-caps has a good effect on performance. Historically, this allocation offered a real annual return of 9.11 percent, turning one dollar invested in 1927 into $860.04 at the end of 2004. Its volatility is slightly higher than that of the conservative allocation, with a standard deviation of 28.90 percent. From the perspective of rolling twenty-year returns, the worst twenty-year return was 3.26 percent; the highest was 16.65 percent and the average return for all twenty-year periods was 10.15 percent.
Let’s look at the potential of this preferred portfolio allocation, using the same forecasts as with the conservative allocation. If returns come in at our minimum expectations, this $100,000 preferred portfolio would grow to $320,215 in twenty years, a real annual return of 5.99 percent. With returns at the maximum of our expected forecasts, the portfolio would be worth $465,384, a real annual return of 7.99 percent. Simply adding 10 percent more small-cap stocks improves returns without significantly increasing risks.
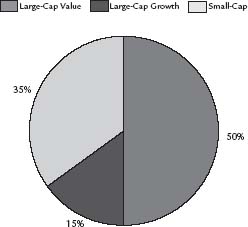
FIGURE 11–3 PREFERRED PORTFOLIO ALLOCATION
So, you might ask, why don’t we increase the small-cap allocation even further? Rather surprisingly, if you increase the small-cap allocation to 45 percent, you actually reduce the performance while increasing risk! That’s because of the underlying volatility of small-cap stocks; a 35 percent allocation manages to wrest the greatest possible value from core small-cap holdings.
Flexibility Is Key
You can easily implement both the conservative and preferred portfolio allocations in your 401(k), IRA, or brokerage account by using ETFs and mutual funds. For the conservative allocation, you would invest 25 percent of your portfolio in the iShares Russell 2000 Index, 60 percent in the iShares Russell 1000 Value Index, and 15 percent in the Vanguard Growth Viper Fund. For the preferred portfolio allocation, you would invest 35 percent in the iShares Russell 2000 Index, 50 percent in the iShares Russell 1000 Value Index, and 15 percent in the Vanguard Growth Viper Fund. Make sure to annually rebalance each portfolio to the target allocations, which allows you to harvest money from the strategy that has performed the best and direct it to the strategy that has done the worst. While this may sound counterintuitive, this allows you to funnel some money away from the hottest style and into the one that is just heating up. These two simple portfolios are a great way to maintain broad exposure to all of the investment styles and capitalization categories while periodically harvesting the best performers. If your 401(k) does not have ETFs, use the guidelines from chapter 9 to select the mutual funds with characteristics most closely aligned with each category.
Using Stock Selection Strategies to Allocate Your Portfolio
Now let’s look at using the stock selection strategies featured in chapter 8 to build a portfolio that takes advantage of the trends I believe will emerge over the next twenty years. Here, we will allocate a bit more to the large-cap growth category, since we can use a growth strategy that includes value parameters. Thus, we will do a single allocation that should serve as a good core domestic equity holding over the next twenty years. We’ll use all of the style-specific strategies featured in chapter 8 to build a portfolio with exposure to micro-cap and small-cap stocks, as well as to large-cap value and growth names that also include a value carburetor. Here’s the allocation:
- 10 percent in Tiny Titan micro-cap stocks;
- 15 percent in the Cheap Stocks on the Mend Small-Cap Growth strategy;
- 25 percent in the Dogs of the Dow;
- 25 percent in the Market Leaders low Price-to-Cash Flow strategy;
- 25 percent in the Market Leaders Growth strategy.
Figure 11–4 shows the allocation that we will maintain over the next twenty years. Thus, we maintain a mix of 75 percent large-cap stocks and 25 percent small-and micro-cap stocks by annually rebalancing the portfolio to maintain that mix. Here we can afford to allocate 25 percent of the portfolio to large-cap growth stocks since we can employ a more finely tuned strategy than the Vanguard Viper Growth Fund uses. This larger allocation gives us a greater chance of benefiting from those periods when large-cap growth stocks are performing well.
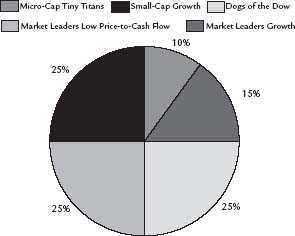
FIGURE 11–4 CUSTOM ALLOCATION USING STOCK SELECTION STRATEGIES
Historical Performance and Twenty-Year Rolling Returns
Historically, this customized portfolio allocation has dramatically outperformed a 75 percent S&P 500 allocation and a 25 percent small-cap allocation. Between December 31, 1952, and December 31, 2004, this portfolio mix had a real annual return of 14.46 percent, turning one dollar invested in 1952 into $1,121 by the end of 2004. By comparison, a 75 percent S&P 500 and 25 percent small-cap stock portfolio grew at a real rate of 8.32 percent over the same period, turning one dollar invested in 1952 into $64 at the end of 2004. The two strategies had similar risk, with the custom allocation sporting a standard deviation of return of 20.65 percent, versus 18.59 percent for the S&P 500/Small Stock allocation.
For all rolling twenty-year periods between 1972 and 2004, the worst this custom strategy ever performed was a real annual return of 8.95 percent and the best was a real annual return of 18.92 percent. The average for all rolling twenty-year periods was a real annual return of 13.15 percent. Over the same period, the worst the S&P 500/Small Stock portfolio ever performed was a real annual return of 3.01 percent; the best was 12.93 percent and the average for all rolling twenty-year periods between 1972 and 2004 was 7.05 percent.
Forecast for the Next Twenty Years
For all rolling twenty-year period average returns, our custom allocation did 6.10 percent better than the S&P 500/Small Stock combination. The forecasted return over the next twenty years for a portfolio 75 percent invested in the S&P 500 and 25 percent invested in small stocks would be a return between 4.15 percent and 6.15 percent. Thus, I forecast that for this custom strategy, real returns over the next twenty years should be between 10.25 and 12.25 percent. (I arrive at this estimate by adding the average 6.1 percent twenty-year excess return of the strategy to the minimum and maximum expected return of the S&P 500/Small Stock combination.)
Rather than adding that 6.1 percent premium to the S&P 500/Small Stock portfolio, let’s try to be a bit more exacting and build this custom portfolio from the ground up, using the forecasts for each of the substrategies. By doing this the minimum forecasted return would be 9.54 percent and the maximum 11.54 percent. We’ll use these slightly lower forecasts to look at the growth of $100,000. If we achieved a return consistent with the low forecast, $100,000 would grow to $618,664 in twenty years, whereas if we achieved returns consistent with the high forecast, $100,000 would grow to $888,409. This is significantly higher than the returns we can achieve using the simpler conservative and preferred portfolios that utilize the Russell indexes and the Vanguard Viper Growth Fund, and reinforces the value of using stock selection strategies whenever possible. The significantly stronger performance of this custom portfolio could serve as a catalyst to hiring an advisor or setting up an IRA at an online broker specializing in basket trades so you can do it yourself.
Let’s take a closer look at the custom portfolio. It currently holds eighty different stocks with a median market capitalization of $1 billion and has an average market capitalization of $20.5 billion. This large disparity between median and average market capitalization is due to the fact that the portfolio holds fifty tiny stocks, but the thirty big stocks still dominate the portfolio. Thus, even though 75 percent of your money is invested in large-cap stocks like Ford, GM, Merck, Intel, and Hewlett-Packard, the overall portfolio looks much different because of the inclusion of the much smaller stocks.
If you review the list of stocks meeting the portfolio’s criteria at any given time, you’ll likely see that there are many stocks you’ve never heard of, and those you are familiar with are probably out of favor on the street. While the obscurity and relative unpopularity of the stocks in this portfolio may give you pause, keep in mind that one of the key reasons this strategy works so well is precisely because it selects these types of stocks. Popular stocks are the easy bets that appeal to most investors. Remembering what we learned in chapter 6, it’s in our very nature to prefer a stock that has the approval of other investors and the financial media. Those stocks tend to be overpriced and overhyped, typically sporting dangerously high PE ratios. You pay an enormous price for popularity and a cheery consensus, which could be seriously detrimental to your portfolio’s health in a low return market environment.
The Benefits of Rebalancing and Annual Contributions
Let’s look at the importance of annually rebalancing your portfolio. Table 11–1 shows the performance of the custom stock selection strategy portfolio over the past twenty years. Since we are looking at the returns for the strategies during the recent bull market, note that the portfolio’s total return is much higher than we expect to see in the next twenty years. Each year the portfolio was rebalanced to the target allocations. You can see that even with lump-sum investing, rebalancing is vital; it has you remove money from the strategies that have been the most successful in the previous year and allocate it to those that have been the least successful. Look at the end of 2000: the micro-cap Tiny Titan strategy lost an atrocious 40 percent, whereas the Dogs of the Dow had a relatively strong year, gaining 2.91 percent during a bear market. Most investors would look at the great Dogs return and put more money into it, relegating the Tiny Titans to the wayside. Rebalancing forces you to do the opposite, taking money away from the Dogs and bringing the Tiny Titans allocation back up to 10 percent. In 2001 this move was richly rewarded, with the Tiny Titans up an impressive 58.7 percent compared to a loss of 6.35 percent for the Dogs of the Dow.
We’ve been looking at the results of making a lump-sum investment and then letting the market compound your portfolio over time. You can enhance your returns further by making ongoing contributions to your portfolio. Assume the example above was a 401(k) plan and you were able to make annual $15,000 contributions for the next twenty years. Look at the difference in your portfolio’s final value in table 11–2. Instead of the $1,878,892 you’d have at the end of 2004 with a $100,000 lump sum investment made twenty years earlier, you would have a portfolio valued at $3,622,097! All from making annual $15,000 contributions for nineteen years! This additional $285,000 in contributions would add $1,458,205 to your portfolio’s final value. Clearly, this is one of the best things you can do to ensure that you maximize your portfolio’s potential, particularly in a low return environment.

TABLE 11–1 RETURNS FOR CUSTOM ALLOCATION
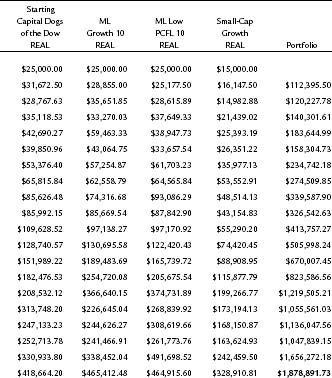
WITH LUMP SUM INVESTMENT OF $100,000

TABLE 11–2 RETURNS
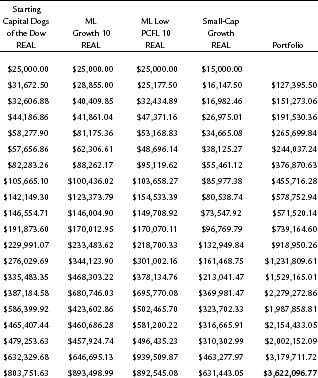
WITH ANNUAL $15,000 CONTRIBUTION INCLUDED
What About Bonds?
For investors looking to maximize their returns over the next twenty years, bonds are currently a poor choice. Remember that the inflation-adjusted twenty-year Treasury is currently yielding only 1.70 percent, hardly a rate that will build a healthy retirement portfolio. That doesn’t mean that bonds can’t have a place in your portfolio, particularly if you’re nearing retirement or wish to reduce your portfolio’s volatility. It simply means that the returns you will earn for this reduction of volatility will be quite low if you invest in them now. My advice is to begin your investment with a 100 percent allocation to equities and watch bond yields. When the yield on the TIPS surpasses the forecasted growth rates for the various equity classes covered in this book, begin to shift a portion of your portfolio into bonds.
For example, if the yield on the inflation-protected Treasury goes above 4 percent, consider reducing your equity allocation by 15 percent, the amount we currently have allocated to large-cap growth stocks. Keep in mind that you would not stop investing in that category, but rather reducing the equity allocation of your portfolio by 15 percent and investing that percentage in bonds. Thus, if you have $200,000 in your portfolio when the yield exceeds 4 percent, you would move from a 100 percent equity allocation to 85 percent equities and 15 percent bonds, with $170,000 invested in equities and $30,000 in bonds. As the bond yield increases, you might continue to increase your portfolio’s fixed income allocation.
Should bond yields get very high again—a distinct possibility given the underlying demographic trends and the government’s needs to finance the retirements of 78 million baby boomers—it would be prudent to increase your bond allocation. For example, if bond yields went higher than our forecast for large-cap value stocks, you would shift to an allocation that was mostly fixed income.
Other Allocations
In this chapter, my intention was to give you basic core equity allocation advice. For most investors, equities make up the bulk of their portfolio. I hope my allocation advice is flexible enough so as not to matter what type of investment account you have. Obviously, there are many additional asset classes and styles you can consider as the next twenty years unfold. The most important (that are beyond the scope of this book) are international equities and bonds, domestic alternative investments such as long-short hedge funds, private equity and venture capital, emerging market equities, and commodities. If you work with a good investment advisor, he or she should discuss these with you. They might also show you add-on strategies such as writing covered call options to increase the income in your portfolio. All of these can make sense depending upon your age and how much time you have left until you need to begin consuming your portfolio’s capital.
I’ve also left domestic real estate out of the investment mix, as many of us already own a home and for the most part should be using it as shelter rather than for speculation. As I mentioned in chapter 2, the huge spurt in housing prices that we have seen over the last six years is unlikely to continue. Housing’s long-term real rate of return in the United States has been just slightly better than an investment in U.S. T-bills. That’s because housing prices have remained closely aligned with incomes, with the percentage of income allocated to housing remaining remarkably stable over time. The increase in U.S. home prices over the last six years is due to low interest rates and innovative mortgage structures that allow for interest-only adjustable rate mortgages. Because rates are so low, a home buyer with an average income is able to buy considerably more house than in the past. When rates shift, however, that trend will end. Many of the people who stretched to meet payments under the lower rates will be unable to continue making those payments, which will lead to a housing glut. Increased supply will drive prices down, ending the speculative trend. At the time of this writing, single family homes are near the top of their return cycle and are unlikely to continue their upward ascent. Historically, real estate is a distant second to equities, and that relationship is likely to continue in the future.
Big Differences from Asset Allocation
In this chapter, I hope I’ve demonstrated how important it is to carefully allocate your portfolio as we move into the low return environment of the next twenty years. Simply by shifting from the currently popular mix of core large-cap strategies like the S&P 500 and large-cap growth stocks you can materially improve the value of your portfolio twenty years from now. By just moving to the preferred portfolio that invests 35 percent in small-cap stocks and 65 percent in large-cap stocks with a value bias, you can potentially increase the value of your portfolio from $182,373 to 320,215, and this is if we only achieve the minimum of my forecasts for the next twenty years. If you’re willing to do the little extra work that using our stock selection strategies entails, you could push this to $618,664 at the end of twenty years (still assuming the minimum forecasted returns). That’s a huge advantage and only requires a few hours of work each year to rebalance your portfolio. I doubt you could find any job that pays you so well on an hourly basis! The point is clear—over the next twenty years, allocation will be extremely important to your financial well-being.
Chapter Eleven Highlights
- How you allocate your portfolio will profoundly affect your portfolio’s performance over the next twenty years. If you maintain the traditional 50 percent large-cap core, 40 percent large-cap value, and 10 percent small-cap allocation currently adhered to by millions of Americans, your total real rate of return over the next twenty years will probably fall between 3.05 and 5.05 percent per year.
- The conservative allocation maintains a portfolio mix similar to the overall market: 75 percent in large-cap stocks and 25 percent in small and mid-size companies. To take advantage of the coming twenty-year trends, you should have more large-cap value than large-cap growth stocks. All of my recommended allocations include a large-cap growth component to take advantage of those periods when large-cap growth stocks are in favor.
- The preferred allocation increases the small-cap stock allocation to 35 percent. Increasing it further has little effect on total return but increases the portfolio’s volatility. You can use both the conservative and preferred portfolio allocations in your 401(k), IRA, and traditional brokerage account using ETFs and mutual funds.
- By using specific time-tested stock selection strategies, you can dramatically improve your portfolio’s expected real rate of return. The recommended allocation increases the investment in large-cap growth stocks, since you are able to include a value parameter that reduces the likelihood of buying overvalued stocks. You will need a brokerage account or an advisor account to implement these strategies.
- Investors seeking the highest total return should begin with a 100 percent equity allocation. As bond yields increase, move money from equities to bonds. Thus, if bond yields exceed our long-term forecast for large-cap growth stocks, move 15 percent of your portfolio to bonds and maintain the balance in equities. If yields continue to rise above other equity forecasts, move that percentage from stocks to bonds.