11
Process Mapping and Indicators
Federico Olivo and Guido Orzes
11.1. Processes, Functions, and Procedures
The process approach is one of the main innovations introduced by ISO 9001:2000 and further emphasized by ISO 9001:2015 (Hoyle, 2017). The change compared to ISO 9001:1994 is significant and marks the transition from product control to process management (Pamploni Scarpa & Conca, 2003).
Companies tend to organize themselves according to specialist functions (departments) with individual responsibilities and clearly defined tasks to facilitate the management of different activities and to secure the chain of command. The functional approach generates a search for partial profits and for “artificial” performance optimization within each function (department), which rarely leads to the overall optimum for the company. In this type of organizations, each function aims in fact at independent objectives that might not be aligned with the overall goals of the company and may not target at customer satisfaction. In this situation, time-to-market and lead times tend to be higher and interfaces among functions have lower efficiency (Pamploni Scarpa & Conca, 2003). Often, no one controls activities as a whole and the management of interfaces among the various functions is particularly inadequate (De Risi, 1999). The excessive focus on vertically organized structures might overshadow sets of activities that create added value (CEI, 2002).
The process approach offers a comprehensive vision of the activities within the company: it looks at the final results that the company wants to achieve from a single process, combining the individual requirements with the overall objectives of the company. In summary the process approach pursues an “overall” optimization of business performances, trying to integrate all the activities and the actors involved in them. Process management is not alternative but complementary to functional management.
The procedure is the way in which an individual operates when performing a task (Hoyle, 2001): it is the description of the most suitable operating mode. A procedure consists of a sequence of stages, each potentially comprising a series of activities, which in turn may be broken down into sequences of actions. The goal of a procedure is thus to illustrate the arrangement of the actions that different actors should carry out (Berger & Guillard, 2009).
To identify and describe a process, it is useful to refer to a model that details all its components. An example is provided in Fig. 11.1.
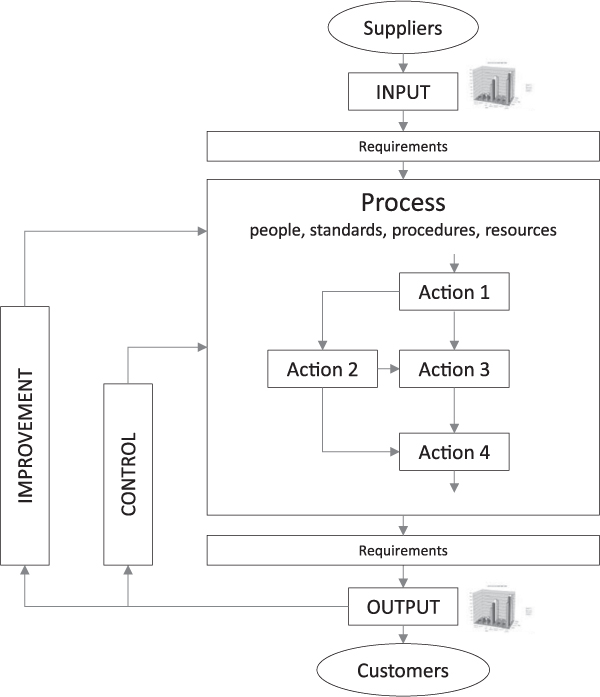
Fig. 11.1: Process Model. Source: Adapted from Leonardi, Meacci, Bergoglio, Raiteri, and Bini (2001).
11.2. Process Identification
Several methods can be used for process identification. One of the most frequently adopted methods involve the integration of “top-down” and “bottom-up” approaches. The top-down approach is essentially a description phase, which gradually becomes more and more detailed and comprehensive, that is, from the general to the particular. The bottom-up phase includes instead verification and control and goes in the opposite direction.
Process identification, description, and optimization require considerable resources. It is therefore important to concentrate efforts (at least initially) on the most important processes for the company (critical processes).
It is easier and more efficient to start with the top-down approach because it begins from a more general vision. Going from the general to the particular allows to organize the work in a more organic, systematic, and structured way. The bottom-up approach would focus instead on the analysis of many simple/small activities, which need to be linked to each other, and this is rather difficult.
The top-down approach starts with the identification of the most important processes within the company; it then moves on to explore how they operate and can be developed, to identify process managers, activities, sub-processes and their associated responsibilities, and finally to define in detail all stages involving workers and/or operating personnel. The question that should be considered during the top-down phase is “how” (e.g., how a specific process or activity is performed).
Once achieved the desired level of detail,1 the bottom-up approach is adopted to look for inconsistencies between the model (representation) develop by the managers/analysts and the real situation, highlighting and redefining the supposed (or desired) relationships between them. The question leading this phase is “why” (e.g., why a specific process or activity is performed).
As pointed out by Leonardi et al. (2001), every change in a company generates fears, which may in turn hinder the progress of a project: that is why at the beginning a training program is essential to motivate all the staff involved (and in particular the managers). Being trained on new methods together with colleagues from other departments favors the shaping of cross-functional teams, essential for implementing the process approach. The foundations are laid for a new common language, according to which the work of each individual is fully comprehensible and usable by others.
The fundamental steps to identify and describe processes are described by Hoyle (2001) (see Fig. 11.2).
Objectives, strategies, and system boundaries are identified with the support of mangers, defining an initial map of processes divided into macro-categories, highlighting the most important relationships and responsibilities. Hoyle (2001) emphasizes the importance to define business boundaries and limitations clearly, to determine where process mapping should begin and end.
Together with process managers, development teams for detailed process analysis are then created. From consultations with operational staff, non-formalized optimizations or practices non-conforming to the required procedures are highlighted, pointing out differences from what was originally planned. The discussion will provide managers with useful elements for an optimized process redefinition, at the same time leading operators to a greater awareness of their role and of the overall goals. The bottom-up phase will finally lead to a revised final map of processes.
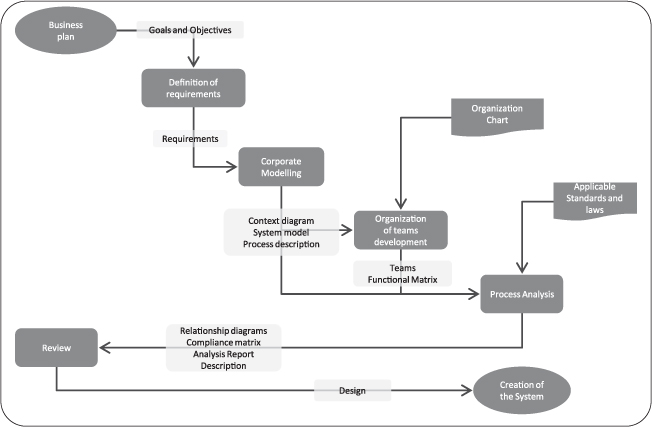
Fig. 11.2: Design of Process Identification System. Source: Adapted from Hoyle (2001).
11.3. Organization Modeling
At the basis of process management lies the clear identification of business objectives. These objectives, defined by the senior managers, are the key elements to identify the processes of a company and understand the most important one (critical processes), that is, those which allow to achieve the objectives.
It is important to remember that, in most cases, objectives will not have equal importance for the company. Therefore, it is appropriate to clearly define the relative importance of objectives, in accordance with the market and the business strategy (De Risi, 1999). This can be done through an objective evaluation matrix, in which the score 1 is assigned when the objective in the row is more important than the objective in the column (see Table 11.1). The sum of the scores of each row of the matrix provides a measure of the relative importance of each objective.
Brainstorming is a technique that can be very useful to identify the processes within a company.2 Depending on the size of the company, all or some of the managers can be involved (for maximizing the effectiveness the upper limit is 8–10 people). During the brainstorming a way to facilitate process identification is to note down proposals on post-its and group them into macro-groups to create a macrostructure.
Pamploni Scarpa & Conca (2003) suggest using a process criticality matrix to determine which processes are more important and should be mapped first (see Table 11.2). The objectives and their importance (obtained for instance through the objective evaluation matrix presented in Table 11.1) are arranged in the columns of the matrix, while the processes are arranged in the rows. Some managers (for instance, three in the example reported in Table 11.2) state their own evaluation about how each process contribute to each objective (for instance, on a scale 1–10). The evaluation must be carried out independently and must not be disclosed to colleagues. Evaluations are then filled in the general matrix. This allows also to compare the perceived importance of processes among members of the working group and highlight potential inconsistencies. At the end, it is possible to identify (through the use of an algorithm) a relevance indicator for each process and to define various categories, according to implementation priority.
Table 11.1: Example of an Objective Evaluation Matrix.
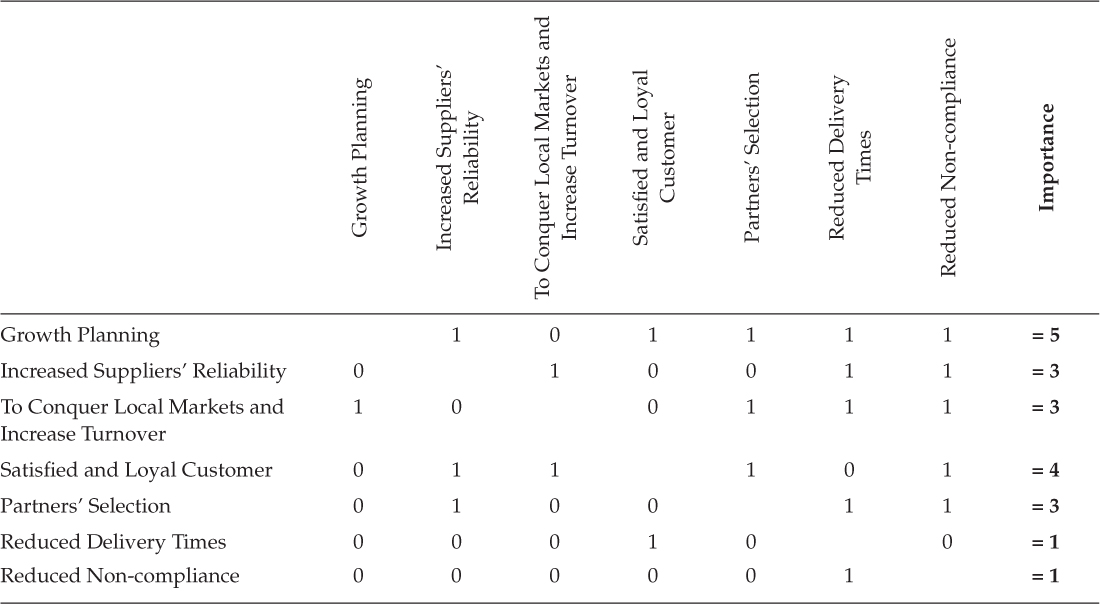
Table 11.2: Example of a Process Criticality Matrix with Rating by Three Different People (i.e., A-B-C).
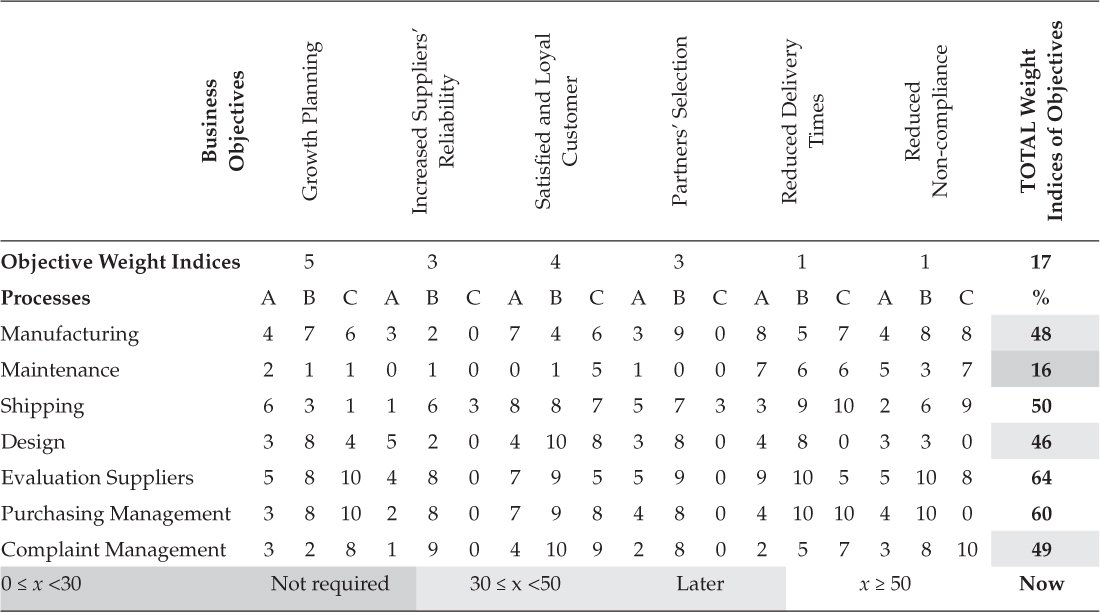
Source: Adapted from Pamploni Scarpa & Conca (2003).
11.4. Development Team and Process Owner
Since processes are cross-functional, the development teams involved in the process analysis must be cross-functional too.
A major difficulty lies in the identification of a “process owner,” that is, the person in charge of the process. The identification of this figure must take into account several considerations: the importance of the role of the person in the process, his/her position in the organizational chart,3 and his/her inclinations and personal characteristics. It is not necessary to set up a matrix organization, which, in some cases, would be too complex to manage. A good criterion could be to select the person who carries out the largest number of activities related to the process (e.g., De Risi, 1999; Pamploni Scarpa & Conca, 2003).
11.5. Operational Tools and Practical Guidelines
To allow teamwork efficiency and consistency, it would be useful to introduce rules, methods and tools that everyone must follow. People may have different training, experiences and cultural backgrounds, but they must be able to relate to colleagues through a common language. A number of practical measures can be helpful, such as the definition of:
project name;
reference place (where to leave binders, folders, and posters on the walls);
time of regular meetings for the project team;
meetings modes (length, typical phases, and people in charge); and
sheets, data collection cards, folders, models, and saving structure of project files.
Processes can be analyzed through a series of actions (Berger & Guillard, 2009):
activity description (interview with one or more team members);
analysis of responsibilities (identifying them from the interview);
building a flowchart (identifying the actions from the interview);
defining criticalities/controls/action plans (e.g., process FMEA);
identification and definition of performance indicators;
identification of relationships (identifying inputs and outputs from the interview); and
identifying tools/means/resources (identifying them from the interview).
The result of this first phase of description can be reviewed and verified. For each activity one may ask himself, for example:
Is the goal clear?
Are responsibilities and duties consistent with skills and authority?
Does the activity provide added value, that is, is it useful to achieve the objective of the process?
Is it possible to evaluate its performance?
Has an effective method of evaluation been defined?
Are there any results indicating that task performances allow the goal to be achieved?
Was the result achieved at the appropriate stage of the process?
Is this the only process to generate this result?
To discover the characteristics underlining the effectiveness of a task it is possible to perform a comprehensive analysis through the Six Ws method (also called Five Ws and one H): What? Why? Who? When? Where? How? (Hoyle, 2001).
To verify the accuracy of the flow chart, it is useful to assess the following aspects:
Are the main aspects of each process/activity clear (see the reference model for a process in Fig. 11.1)?
Can the points of the reference model be clearly recognized?
Are standards, laws, internal, and customer requirements followed? (A requirements–processes matrix can be used to check this.)
Is the result consistent with the guidelines for quality management system (QMS) development outlined by management?
Were previous reports approved?
Considering each process as a “black box,” it is possible to highlight the actual inputs and outputs and compare them against what is defined in the top-down phase. This check allows to highlight inconsistencies, misunderstandings, and to complete the relationships (and information) map between processes.
If any activity, document, or process appears to have no incoming or outgoing connection it is possible that:
(1) It needs to be deleted because it brings no added value.
(2) Unidentified relationships need to be uncovered (Hoyle, 2001).
11.6. Obstacles and Benefits of the Process Approach
The most common criticism to the process approach originates from the incorrect belief that it is just a matter of writing down the activities carried out and because of this, it is useless. However, the graphical representation of processes goes well beyond this and brings many important advantages which make it really useful. The simple graphical representation of a process often highlights in fact inconsistencies and misunderstandings. This is normal and, if managed properly, is a useful and important first step toward the improvement of the system (and of the company).
There are several obstacles that might undermine a process mapping project (see for instance, Berger & Guillard, 2009). The obstacles/difficulties should be taken into consideration and suitable measures for mitigating them should be adopted. Table 11.3 provides a set of levers and solutions that might help in doing this.
The study of Berger and Guillard (2009) – which focuses on the graphical representation of processes – highlights that during a project it is possible to find documents that are irrelevant, illegible or too complex, and cumbersome.
Table 11.3: Obstacles/Solutions in a Process Management Project.
Obstacles/Objections |
Levers/Solutions |
Not needed/I write down what I do |
Motivating and training staff and management
Highlighting successes and improvements |
Cost/missed production |
Management training
Successful examples
Sample processes to implement first
Classification of processes importance |
Loss of power |
Training, motivation, new tasks/responsibilities |
Too complex/abstract |
Defining rules, provide tools, train staff |
There’s no time |
Project planning
Defining milestones
Fixed dates/appointments planned well in advance
Continuous updating of the project Gantt chart |
I do not know what to do |
Defining rules, providing tools, and training staff |
I do not understand what others have done |
Defining rules, providing tools, and training staff |
Times are getting longer |
Setting the timing control system
Acting immediately in case of delays
Defining protocols with deadlines, tasks, and responsibilities for each meeting |
Source: Adapted from Berger and Guillard (2009).
The refinement of the process description often lasts more than expected, with the risk of triggering dangerous dynamics for the continuation of the project.
Two fundamental concepts should be taken into account:
a document must be operational, used and alive, and therefore clear, readable, easy to understand and use; and
optimization is achieved through use.
The main benefits of process approach can be summarized as follows (Berger & Guillard, 2009):
• Sharing |
processes and their relationships more effectively |
• Organizing |
who does what, effectiveness, coherence |
• Structuring |
information, bring together/distribute tasks |
• Saving |
the know-how is stored within the enterprise |
• Training |
essential support for staff training |
• Learning |
organization, responsibilities, information |
• Understanding |
clearer and less “changeable” than oral explanations |
• Communicating |
shared and known language and form |
• Normalizing |
shared methods, trend toward best practices |
• Evaluating |
effectiveness of what has been formalized |
• Improving |
changing what formalized |
• Digitizing |
at the basis for specifications of management |
11.7. Textual and Graphical Representations
One of the main causes that prevent the use of a document is often its format.
Berger and Guillard (2009) point out that textual representations are characterized by a sequential and linear structure; reading all contents is therefore essential to understand the document. Many users are consequently forced to read information that does not concern them directly. It is demonstrated that most people can better understand a specific activity if it is presented in graphical form.
The flow chart representation is a simple but very useful tool, which envisages the description of the situation through predefined graphic symbols. Working on this representation forces the analyst to reason objectively and this allows him/her to make changes to the organization when still formalizing it. These improvements are the outcome of a more abstract and global vision allowed by the graphical representation. The analyst is in fact able to better identify critical paths and isolate unnecessary actions. The model is reduced to a series of symbols, which allow a consistent and clear view. The end user can easily make choices while looking at the diagram and navigate easily from one action to the other.
Forms and symbols used have their own figurative meaning, which allows an immediate overview of several information. The graphical language allows to represent complex systems in a simple, natural, and easy to understand way. Just like our brain, a graphical language offers a comprehensive and systematic view of processes, proceeding by association of ideas and eliminating redundant paths. Thanks to the dynamic nature and the simplicity of the approach, a graphical language facilitates participation and understanding by all.
11.8. Methods, Tools, Languages, and Rules
Tonchia and Tramontano (2004) developed a systematic analysis of many software, methods, and tools for the graphical representation of processes. There is probably no best method, but one aspect is crucial: the application of precise rules makes the graphical language easier to read and understand, since process analysts only need to focus on content, not on form, and users are facilitated in the unambiguous understanding of information.
The Qualigram method (Berger & Guillard, 2009) provides practical support to the implementation of a process-oriented QMS within the company. It uses the graphical concept and a simple and operative language, based on a well-defined graphic vocabulary to avoid interpretation misunderstandings or uncertainties.
At the basis there are the classical elements of relations diagrams, that is, entities, actions, and information, with a level of customization. This method is also supported by a precise grammar and syntax and by well-defined structure rules. The structuring is based on three levels of modeling, which reproduce the classic pyramid principle of a breakdown structure. Each level features different approaches, levels of analysis, documents, rules, layouts, and development strategies, as shown in Fig. 11.3.
The Qualigram method allows the “navigation” of the graphical representation on IT devices and makes finding the information needed easier even for those who are not very familiar with system. The index of accessibility to information grows significantly after the implementation of this method.
The Qualigram method has also led to the development of a specific software tool: PYX4. This tool, designed by the French Globalliance, is web-based and not bounded to any specific operative system. It is particularly powerful in the application of the methodology and it represents a valid alternative to Business Process Management Software tools when the focus is getting people understanding processes rather than automating them. It also allows an interesting synergy between process, roles, and document management, combined with risk-based thinking. This tool is widespread in France, North America, and Switzerland and is gaining increasing interest in the rest of the world.
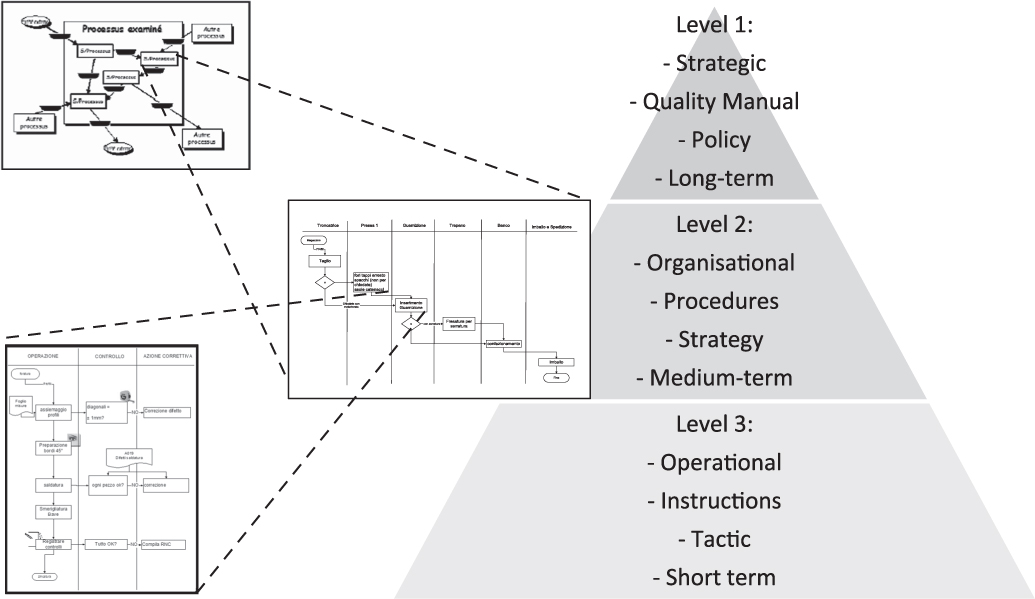
Fig. 11.3: Qualigram Pyramid. Source: Adapted from Berger and Guillard (2009).
11.9. Process Mapping and Risk-Based Thinking
To graphically represent a process, it is necessary to break it down into its elementary actions, identifying the sequence of such actions, relative responsibilities, inputs and outputs, tools, and procedures applied. This information is very useful for the risk-based thinking4 approach. It is sufficient to consider the relative risks and opportunities for each individual action, taking into consideration the analysis of the context and the other identified elements of the process. One possible approach is to set up a FMEA table containing elementary actions.
11.10. Process Indicators
In line with the principles of quality,5 the process model proposed in this chapter also requires the definition of a set of process management indicators. An indicator is a key part of the process, since it determines its dynamicity. Without an indicator, it is very likely that the process remains static and with no improvement mechanisms according to kaizen principles (Imai, 2012).
Indicators make it possible to decide based on factual data, avoiding blind operations, and allow timely and correct interventions as well as the forecast of future trends (by means of trend analysis).
It is possible to develop a matrix with the list of processes/subprocesses in the first column and the objectives in the first row (see Table 11.4). Each cell of the matrix represents a relationship between an objective and a business process. During a brainstorming meeting with the process managers, these relationships can be searched and, if they exist, it is possible to design indicators that can measure the effectiveness of the individual process in achieving the general objective. If no contributions are identified for a specific objective, the cell can be left empty or, for practical reasons, blackened to highlight the absence of relationship.
Table 11.4: Example of a Matrix for the Identification of Process Indicators.
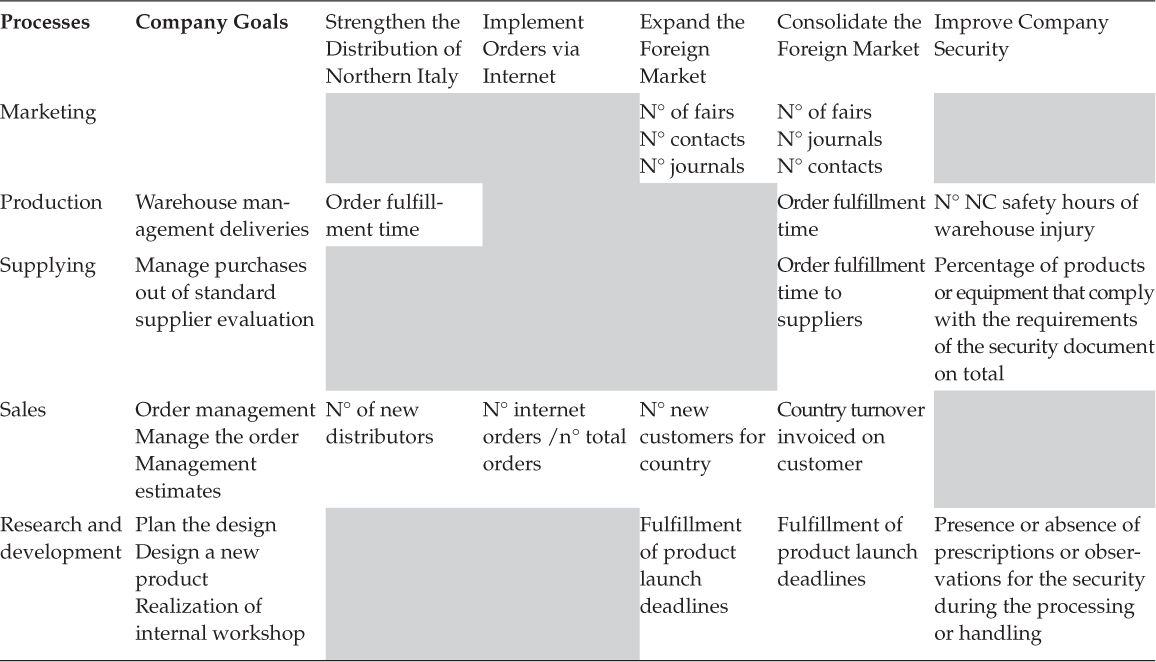
This matrix might highlight the presence of processes with no added value (processes with empty lines) and allows a verification of the relationships between processes (through the search for indicators).
Once the indicator has been identified, target values (process objectives) can be set. By construction, the achievement of each process objective will contribute to the achievement of corporate objectives. An algorithm can then be defined to take into account the importance and weight of the various subprocess goals, to find an overall performance index for the company or an index connected to one of the overall objectives.
11.11. Choice of Indicators
The analysis phase normally identifies many indicators and it would be wrong to choose to implement all of them at once: implementing and maintaining an indicator takes in fact time and resources. There is therefore the need to select the most important indicators to be implemented first.
A criterion could be to define a ranking of importance in relation to the objectives and to implement them following this order.6
The matrix is also a validation tool and an objective demonstration of the application of the principles of quality, against which no auditor can complain. It is therefore suggested to apply to indicators the same method described in Section 11.3 for the processes.7
11.12. Building an Indicator
A good strategy for developing an indicator is to start by looking at examples. But even with a large number of examples, what can drive choice and definition of an indicator? An indicator must be objective, measurable, simple, accurate, clear, concise, shared, readable, relevant, practical, and economical (CEI, 2002). Building an indicator does not simply mean to define a formula, an algorithm. A detailed definition is needed, otherwise it is very likely that something goes wrong, and the indicator does not work. An example of a comprehensive definition of an indicator is reported below:
Indicator |
integrity correspondence ordered delivered |
Formula/calculation |
objections number/orders number |
Measurement unit |
report |
Target value |
0.5 |
Limit values |
2 |
Detection data responsible |
responsible for the product distribution |
Data collection rate |
monthly |
Collection mean/method |
fill in M112 at check-in |
Communic. mean/method |
monthly envelope |
Data processing |
quality |
Process. means and method |
excel spreadsheet |
Process. frequency |
bimonthly |
Representation |
trend line graph |
Evaluation |
direction |
Evaluation frequency |
quarterly |
Historical trend management |
archive direction |
11.13. The Representation of Indicators
Through a correct representation, many information can be conveyed immediately and effectively, beyond the basic numerical value of the indicator: intervention thresholds, historical trend, compared trends, general trends, etc.
The choice of representation is so significant that it can substantially alter the perception of the information. In choosing the type of representation many factors should be considered: what should be highlighted/emphasized, who is the recipient, how many data are available, etc. As a general rule, simplicity should be privileged to make data and information more understandable. Data will vary with time; therefore, it is recommended to choose representations capable to handle changes in the monitored values, allowing trend assessments and the establishment of preventive actions, in line with the prevention, appraisal, and failure model for quality cost reduction (Beecroft, 2003).
11.14. Implementation of the Indicator System
For the implementation of the indicator system, the following actions are needed:
Training operators and enabling them to interpret indicators correctly and suggest corrective actions and/or improvements;
starting gradually;
choosing those with greater chance of success first;
validating indicators;
reporting on improvements, results, and objectives;
publishing results, analyses, charts, and trends; and
analyzing the causes of any deviation and activate corrective actions.
11.15. Indicators Development and Maintenance
The validation of indicators is necessary to verify their effectiveness and the management framework. The validation is performed by collecting the observations of the people involved, adjusting the system, adjusting or replacing indicators that are no longer significant, and proving their adequacy in relation to the initial requirements.
With a predefined frequency, a dedicated check (validation) would be desirable, since the situations where companies operate are also variable and remarkable changes can occur.
To validate indicators, a checklist can be developed, to assess what follows (CEI, 2002):
Is the referral process under control?
Are goals realistic?
Are data collected on time?
Is the chosen frequency adequate?
Is processing fast and easy?
Does communication work?
Is representation effective?
Could I predict and correct based on performance?
Is the indicator cost acceptable?
An important note concerning the use of the tools proposed in this chapter is that they should be interpreted in a dynamic sense: it is necessary to review the process mapping and the indicators according to changes of importance, the modification of the objectives, and the achieved results. The model should in fact not be static but dynamic and changeable as the reality where the companies operate. The market situation can change, or an indicator may be found to be not effective or uneconomical. By entering new data in the matrices, the system can be updated. Finally, the matrices and the proposed methods are also likely to undergo adaptations, improvements, and changes.
References
Beecroft, M. D. (2003). The executive guide to improvement and change. Milwakee, WI: ASQ Quality Press.
Berger, C., & Guillard S. (2009). Qualigramme method (Business mapping methodology) – A graphical language for business analyst. Paris, France: Association Française de Normalisation (AFNOR).
CEI. (2002). Guida CEI 0-12 Approccio per processi e indicatori della qualità per le aziende del settore elettrotecnico ed elettronico – Linee guida generali all’applicazione delle Norme ISO 9000: 2000. CEI – Comitato Elettrotecnico Italiano.
De Risi, P. (1999). Management by processes (Italian title: La gestione per processi). Roma, Italy: Nuovo Studio Tecna.
Hoyle, D. (2001). QMS Conversion: A process approach. New York, NY: Elsevier Science.
Imai, M. (2012). Gemba Kaizen: A commonsense approach to a continuous improvement strategy. New York, NY: McGraw Hill.
ISO 9001. (2015). Quality management systems – Requirements, Genève, Switzerland: International Organization for Standardization, Retrieved from https://www.iso.org/standard/62085.html
Leonardi, E., Meacci, S., Bergoglio, R., Raiteri, F., & Bini, S. (2001). Knowing the ISO 9000:2000: change, client, processes and continuous improvement. (Italian title: Conoscere le ISO 9000:2000, cambiamento, cliente, processi e miglioramento continuo.) Milano, Italy: UNI.
Pamploni Scarpa, A., & Conca, M. G. (2003). Management by processes (Italian title: Gestione per processi). Milano, Italy: Il Sole 24 ORE.
Tonchia, S., & Tramontano, A. (2004). Process management for the extended enterprise. Berlin, Germany: Springer.
1 The level of detail should be consistent with the characteristics of the process (criticality, complexity, and the difficulty of activities) as well as with the aim of the process analysis (strategic vs operational).
2 For insights on the use of Brainstorming in process mapping see Pamploni Scarpa & Conca (2003) and Leonardi et al. (2001).
3 Organizational charts are often not reliable and conceal serious organizational problems. Often QMS projects simply detail what is communicated by managers, but the organizational chart verification is very important and should be entrusted to specialists such as coaching or process counseling experts.
4 ISO 9001:2015 - 6.1 Actions to address risks and opportunities (ISO, 2015)
5 ISO 9000: 2015 - Quality management systems - Fundamentals and vocabulary
6 The point 9.1 of the ISO 9001:2015 leaves freedom in defining what is worth to monitor.
7 The tools presented are not intended in a static sense; they should be examples to start developing models considered more appropriate for the needs of the specific organization.