Chapter 2. Driver Control Theory
From Task Difficulty Homeostasis to Risk Allostasis
Ray Fuller
Trinity College Dublin, Dublin, Ireland
Control theory is predicated on the assumption that driver-control actions are dependent on perceptual processes that select information that is compared to some standard. Resultant discrepancies motivate counteractive responses in a negative feedback loop. The principal aim of this chapter is to describe developments of one such control theory, the task–capability interface model, which assumes a process of task difficulty homeostasis. These developments take account of the evidence that drivers may modify their reference standards, on the one hand, and that risk feeling may be central to driver decision making in mediating avoidance responses and signaling deviations from driver safety goals, on the other hand. As a result of these changes, the revised model has been given a more apposite name: risk allostasis theory. Different reference standards have also been proposed by Vaa in his “monitor model” and Summala in his “comfort zone model,” and so this chapter concludes by exploring whether these other standards can be assimilated within risk allostasis theory.
1. Introduction
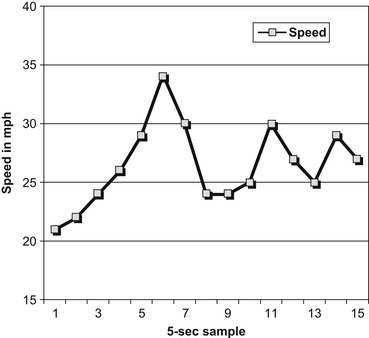
Driving may be described as a control task in an unstable environment created by the driver’s motion with respect to a defined track and stationary and moving objects. The task includes requirements for route choice and following, coordination of maneuvers in support of navigational objectives, and ongoing adjustments of steering and speed (Allen, Lumenfeld, & Alexander, 1971). Figure 2.1 shows speed adjustments by a driver on a winding country lane, sampled at 5-s intervals. A fundamental issue in understanding driver behavior is the nature of the control process that produces such variations in speed.
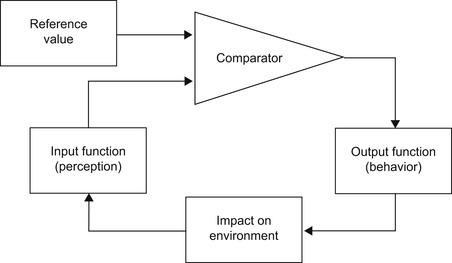
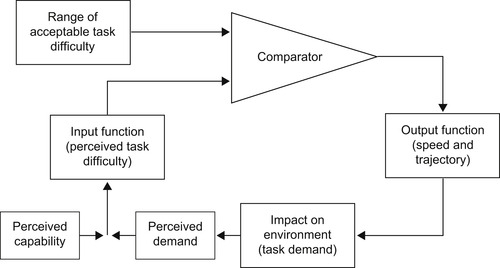
Control theory is predicated on the assumption that driver control actions are dependent on perceptual processes that select information that is compared to some standard or standards. Drivers act to keep resulting discrepancies within acceptable limits in a negative feedback loop as the means of control in their goal-directed behavior (Figure 2.2). Ranney (1994), in his review of the evolution of models of driving behavior, makes a distinction between motivational and cognitive models and by implication includes control theory (e.g., Wilde’s risk homeostasis theory; Wilde,1982) within his motivational rubric. However, as can be inferred from the previous description, control theory encompasses both motivational (setting of standard) and cognitive (perceptual process) dimensions and is a characteristic not just of risk homeostasis theory (RHT) but also of zero-risk theory (Summala, 1986), Vaa’s (2007)“monitor model,”Summala’s (2007)“comfort zone model,” and the task–capability interface (TCI) model (Fuller, 2000). It is with such models that we have seen the most evolution in recent years. All these models differ, however, in terms of their claims regarding what is the reference standard(s) in the control system. The principal aim of this chapter is to describe developments in how the TCI model conceptualizes these standards. It concludes by exploring whether, in the interests of theoretical parsimony, the different reference standards that have been proposed by Vaa and Summala can be assimilated into the developed TCI model.
2. The Task–Capability Interface Model
The TCI model is an attempt to understand what motivates driver decision making, with a particular emphasis on implications for performance safety. It starts from a recognition that driver perceptual processes and control actions both have rate limitations. Thus, the driver needs to continuously create and maintain conditions for driving within these limitations. That is, he or she must ensure that the demands of the driving task are within his or her capability (Figure 2.3). Loss of control occurs when, for a multitude of possible reasons, drivers allow task demand to exceed their capability. It is the identification of these reasons that promises to shed light on how safety might be more reliably achieved as a concomitant outcome of our seemingly insatiable desire for greater mobility.
 |
| FIGURE 2.3 |
From the perspective of the driver, the statistical probability of loss of control and collision (or road run-off) is not some potentially variable phenomenon and influence, as implied, for example, in RHT (Wilde, 1982). Once a driver begins to move his or her vehicle, the statistical probability of collision is essentially one. It is a certain outcome unless, of course, the driver continuously makes adjustments to avoid collision (or road run-off). For this reason, my original theoretical explorations of driver decision making focused on the concept of threat avoidance (Fuller, 1984a). However, that concept provides only a partial account, as has been discussed elsewhere (Fuller, 2005a and Michon, 1989).
2.1. Driving Task Difficulty
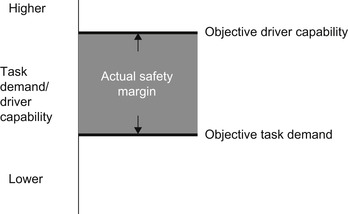
The difficulty of the driving task is inversely related to the degree of separation between the demands of the task and the driver’s available capability. In principle, the greater that capability is, relative to task demand, the lower the difficulty of the task and vice versa. In general, the separation between demand and capability is equivalent to concepts such as spare capacity and safety margin (Figure 2.4). Where capability is more-or-less stable, changes in task demand will directly influence task difficulty. In this typical situation, task difficulty will be equivalent to workload and may in part be operationalized in terms of time-to-collision and time-to-line crossing, assuming resource demand (in terms of speed of information processing and response) to be inversely related to the time available (Wickens & Hollands, 2000).
 |
| FIGURE 2.4 |
As task demand or workload increases, the margin of available capability to deal with additional demands decreases, and the driver becomes more vulnerable to the consequences of a performance error and to acute high demands such as in an emergency situation. Young, Mahfoud, Walker, Jenkins, and Stanton (2008) demonstrated this phenomenon in a simulator study of the effects of eating and drinking on driving. They found that although these activities increased subjective ratings of physical workload, initially there was no effect on driving performance measures. However, when a pedestrian unexpectedly walked in front of them, there was a reduced ability to avoid collision. The authors concluded that although drivers may be able to cope with eating and drinking during normal driving, it is the response to a sudden peak in demand that is affected by the additional activity.
2.2. Driving Task Demand
Driving task demand has both information input and response output characteristics, corresponding to the requirement to determine the situation ahead and the requirement to maneuver the vehicle appropriately. It arises out of a number of factors, including vehicle performance and information display characteristics, route choice, physical characteristics of the environment (e.g., visibility and road surface), and the presence and behavior of other road users. From a safety perspective, one can think of task demand in terms of the difficulty of information acquisition along dimensions of discriminability and flow rate and the number of potential conflicts for space in the driver’s trajectory. One can also think of it in terms of controllability associated with vehicle handling (but see Section 2.3), road surface quality, and the time available for decision making and response (which for any given situation decreases with increases in speed).
2.3. Driver Capability
Driver capability arises from the driver’s basic physiological characteristics, education, training, and experience. These provide conditional rules for action as well as a real-time mental representation or simulation of the situation that enables top-down or feed-forward control decisions (see Section 2.4.3). This capability arms the driver with strategies for information acquisition and the capability of preadaptation to anticipated changes in task demand. It is ultimately expressed in speed and directional control of the vehicle. One could also include vehicle control functions that enhance the driver’s capability, such as antilock brake systems, electronic stability control, and global positioning system support for route and lane choice. Nevertheless, it makes little difference to the basic formulation: Such vehicle control supports can also be construed as reducing task demand (as in earlier formulations of the model) rather than as increasing capability.
Fastenmeier and Gstalter (2007) have used task analysis to develop a typology of both road/traffic situations and driver behavioral requirements that they call SAFE (Situative Anforderungsanalyse von Fahraufgaben—situational analysis of behavioral requirements of driving tasks). A road/traffic situation is defined as “a bounded section from traffic reality that the driver experiences as a unit in time and space.”
Behavioral requirements are a specification of relevant cognitive and psychomotor performances linked to successful negotiation of each situation. Fastenmeier and Gstalter (2007) support a distinction between a conscious information processing system, which is a sequential processor of limited capacity and speed and underpins reasoning and decision making, and a subconscious processor, which operates as a parallel, distributed system to perform a continuous, dynamic simulation of the environment and the individual’s position within it. This simulation provides the basis for a feed-forward control of the driver’s actions as well as a reference for detecting deviations from intended outcomes.
The work of Fastenmeier and Gstalter (2007) provides important first steps in identifying at a micro and measurable level both the nature of driving task demands and the capabilities required of the driver to meet those demands. It is important to note, however, that capability is vulnerable in real time to a range of human factor variables, such as emotion and fatigue.
2.4. Task Difficulty Homeostasis
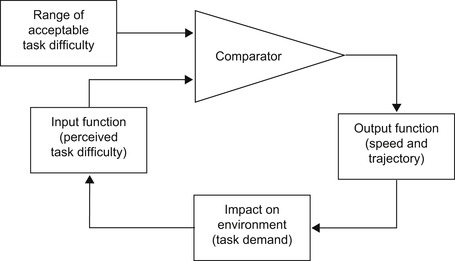
The control theory concept at the center of the TCI model is the hypothesis of task difficulty homeostasis (Fuller, 2005a), the proposition that drivers continuously make real-time decisions to maintain the perceived difficulty of the driving task within certain boundaries, mainly (but not necessarily exclusively) by adjusting their speed (Figure 2.5). Thus, for example, increased task difficulty arising from snow and sleet and darkness additively reduces speed (Kilpeläinen & Summala, 2007). High proportions of drivers state that they drive more slowly than usual when task difficulty increases, such as in fog (98%), heavy rain (96%), and on unfamiliar roads (88%) (Campbell & Stradling, 2003). Drivers also typically reduce speeds while negotiating intersections, but more so while simultaneously completing car phone tasks (Liu & Lee, 2005). They also choose to drive more slowly on a narrower version of the same road (Lewis-Evans and Charlton, 2006 and Uzzell and Muckle, 2005). In Lewis-Evans and Charlton’s simulator study, ratings of difficulty and of subjective risk were higher for the narrower road, but drivers were not aware of the road feature that mediated these differences, suggesting that decision making was occurring at a preconscious level.
Occasionally, speed is not the only variable that drivers can adjust in order to control the level of perceived task difficulty. For example, in a following situation, time headway may similarly be used. In a study of the effects of prolonged driving on truck drivers, it was found that as drivers’ ratings of drowsiness increased, so did their time headway (Fuller, 1984b).
The corollary to this is that when task difficulty decreases, such as when roads are empty at nighttime, speeds increase (Broughton, 2005 and Lam, 2003). Compensatory increases in speed have also been found by Larsen (1995), who measured the free speeds of drivers on different road segments in a 50 km/h zone. He observed an 11 km/h range from 49.2 to 60.2 km/h, with the highest mean speeds associated with what Larsen rated as the easiest driving conditions.
2.4.1. Calibration
We need to modify the representation of the control process illustrated in Figure 2.5 to show that perceived task difficulty arises out of the interface between perceived task demand and perceived capability (Figure 2.6). Accuracy of driver perceptions is referred to as the driver’s calibration accuracy. Clearly, if drivers either underestimate task demand or overestimate their capability, the perceived level of task difficulty will be less than is objectively the case. Unfortunately, both of these conditions pertain to novice drivers in general (de Craen, 2010 and Fuller et al., 2008), and their poor calibration may explain in part the overrepresentation of this group in collision statistics. Harré and Sibley (2007) demonstrated that the disposition of young male drivers, in particular, to believe they are more capable than others occurs with both a traditional explicit measure of attitude and with a new implicit measure. In this latter, participants associated words indicating themselves with words indicating driving ability or driving caution more quickly than they associated words referring to other people with these same positive driving characteristics. The advantage of this implicit measure is that it avoids possible social desirability influences.
Younger drivers also appear to be less well calibrated with regard to estimating the effects of distracting events on their performance or taking account of behavioral variables that may undermine capability. Horrey, Lesch, and Garabet (2008) asked younger and older drivers to complete a handheld or hands-free cell phone task while navigating a closed test track in an instrumented vehicle. Although drivers generally (correctly) rated their performance as poorer when distracted, across all driving measures subjective estimates were not related to the magnitude of the distraction effect. Some drivers who estimated the smallest effects actually exhibited the largest, and these were typically younger males. A review of young driver crashes (Organisation for Economic Co-operation and Development, 2006 and Organisation for Economic Co-operation and Development/European Conference of Ministers of Transport, 2006) concluded that the rate of inattention-related crashes and near crashes is four times higher for 18- to 20-year-old drivers than for those older than 34 years.
Poorly calibrated drivers, who overestimate capability or underestimate task demand, will typically operate with less spare capacity and visit the boundary where task demand meets capability more frequently. Evidence for this in less experienced drivers derives from a study by Patten, Kircher, Östlund, Nilsson, and Svenson (2006) in which a secondary peripheral detection task in real driving was performed. Less experienced drivers had significantly longer reaction times to the peripheral stimuli and higher miss rates (although these results may have been confounded in part by familiarity with the route and sex of participant).
2.4.2. Evidence for Task Difficulty Homeostasis
The concept of task difficulty homeostasis is not exclusive to the TCI model, and Summala (2007, p. 194) has argued a similar case. With reference to time-to-line crossing, he cites evidence that on a wider road, more time is available and hence drivers allow longer glances and more time for subsidiary tasks (Wikman et al., 2008 and Wikman and Summala, 2005). Similarly, on a road with a series of bends, available spare capacity diminishes and subsidiary tasks typically drop out (Summala, 2007).
Evidence for the proposition that drivers try to keep task difficulty more or less constant over the short term derives from the work of Godthelp (1988), who instructed drivers in open road conditions to correct their path only at the moment when it could still be corrected comfortably (to prevent lane boundary crossing). Godthelp found that over a wide range of speeds, time-to-line crossing at the point of decision was essentially constant. In a field study, van der Horst (2007) asked drivers to brake hard at the last moment at which they thought they could stop in front of the simulated rear end of a stationary passenger car. He similarly found that time to collision appeared to be independent of approach speed. In addition, in a simulator study of car following, Van der Hulst, Meijman, and Rothengatter (1999) found that when drivers expected decelerations in the lead vehicle, they maintained the same minimum headway irrespective of whether the lead vehicle decelerated or not, implying that they were maintaining a consistent safety margin (time to collision).
2.4.3. Hysteresis and Top-Down and Feed-Forward Control
There is evidence that under certain conditions there can be a hysteresis effect (i.e., response delay) in this homeostatic process, in which drivers’ adjustments lag behind changes in task demand. Thus, for example, Andrey, Mills, Leahy, and Suggett (2003) found that the first snowfall days of the year were especially prone to increased accidents.
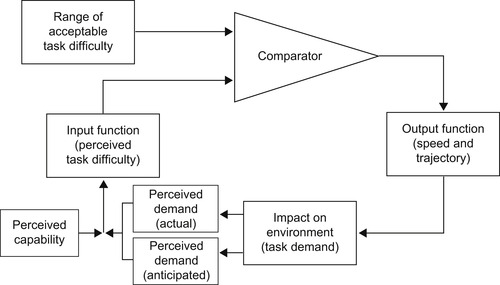
On the other hand, a key component of driver capability is a valid mental representation of what may happen next. It is this that enables top-down or feed-forward control decisions, where drivers’ adjustments to changes in task demand can anticipate those changes. We can represent this process in the model by including not only actual perceived demand but also perceived demand as immediately anticipated (Figure 2.7). Evidence that less experienced drivers have poorer anticipatory adjustment to changes in task demand derives from the work of Saad, Delhomme, and Van Eslande (1990), who found that younger drivers adjusted their speeds less (than older drivers) when approaching an intersection, and in that of de Craen (2010), who demonstrated that recently qualified drivers performed worse than experienced drivers in a test measuring adaptation of speed to increases in task demand. Real challenges for research and development are how to accelerate novice driver progression to this kind of anticipatory task difficulty management and how to sustain it in the face of frequent feedback that it was not actually necessary.
In addition, the driver’s action creates, by and large, the future with which he or she has to deal. This is why the driver needs to know the effects of those actions in the context of the unfolding road and traffic situation ahead. Evidence of poorer knowledge of this type in less experienced drivers is clearly exemplified in their higher involvement in single-vehicle crashes.
2.4.4. Boundaries of Preferred Task Demand
The lower boundary of a driver’s preferred task demand will be determined by a minimum consistent with making satisfactory progress and providing sufficient stimulus to avoid boredom and perhaps prevent a progressive decline into drowsiness and sleep. The upper level will be determined by such variables as the driver’s perceived capability, motivation to put effort into the task, and goals of the journey in question. Journey goals may, of course, have a direct influence on choice of speed; however, if the choice of speed is higher than would normally be preferred, perhaps because the driver is running late and needs to make up lost time, this will raise the level of task demand and require the driver to operate with a higher level of task difficulty.
2.4.5. Task Difficulty as Risk Feeling
One further point in the elaboration of the TCI model is that drivers appear to experience task difficulty in the same way as they experience feelings of risk (Fuller, McHugh, & Pender, 2008). In the study by Fuller et al., participants were asked to rate video sequences of the same segments of a roadway traveled at a wide range of speeds that were systematically varied. Ratings were recorded of task difficulty but also of feelings of risk. Estimates of the statistical risk of loss of control and collision were also obtained. In several replications, it was found that ratings of task difficulty and feelings of risk covaried very closely: The typical correlation between the two variables was on the order of r=0.97. However, such ratings were independent of estimates of statistical risk at lower levels of rated difficulty and risk feeling. Thus, risk feeling and statistical risk estimates are not the same thing, but risk feeling can behave as a surrogate for task difficulty. This finding has since been replicated by Kinnear, Stradling, and McVey (2008) and Lewis-Evans and Rothengatter (2009). The pivotal role of risk feeling in driver decision making is discussed further in Section 5.
That feelings of risk should be so closely associated with perceived task difficulty should come as no surprise given that the outcome of loss of control of the task may be potentially so punishing. If we consider how task difficulty may be represented in the “comparator” element of the task difficulty homeostasis model, one possibility is that it involves a meta-cognitive process that is sensitive to the degree of deviation from subgoals of the driving task. Relevant subgoals that relate to speed choice, because they are time critical, are the maintenance of directional control (adhesion to road), sampling and processing of required information, and enabling of required response. Thus, deviations from these subgoals, such as loss of directional control, loss of time to sample needed information, and loss of time to enable response execution, may trigger a fear or anxiety response because of the potentially punishing consequences. It is a question for future research to determine whether or not the degree of fear felt is systematically related to such measurable variables as time-to-line crossing, or time to collision, or is triggered in an all-or-nothing manner (i.e., driven by possibility rather than probability; see Loewenstein, Weber, Hsee, & Welch, 2001).
2.4.6. Individual Differences in Preferred Task Demand and Difficulty
Accumulating evidence reveals that drivers vary in their individual dispositions to adopt a particular level of task demand. In a study with Steve Stradling’s group at Napier University (project HUSSAR—high unsafe speed accident reduction), we interviewed a national sample of British drivers, and in part of this we presented respondents with a picture of a single carriageway rural road and asked them about two speeds: What speed would they normally drive and what speed would put them right at the edge of their safety margin? There was wide variation in preferred speed: 81% of the sample were distributed over a range of nearly 30 mph (36–64 mph). Furthermore, 7% indicated a speed lower than 36 mph and 11% a speed higher than 64 mph. There was similarly wide variation in what speed they thought would put them right at the edge of their safety margin. A majority (61%) said that a speed less than 65 mph would do so. Twenty-two percent said a speed of 65–74 mph, 11% said a speed between 75 and 84 mph, and 6% said a speed of 85 mph or faster would do so (Stradling et al., 2008).
Despite this wide individual variation in preferred and in edge-of-safety margin speeds, there was a consistent relationship between the two speeds: Edge-of-safety margin speed represented a 14% increase over preferred speed. Furthermore, feelings of risk and stress did not vary with speed chosen: The feeling of risk was similar, whether one was a slow or a fast driver on the same segment of roadway. This suggests that despite variations in speed choice, perceived task difficulty may have been much more equivalent among drivers.
Project HUSSAR also confirmed, on the basis of a 12-year literature review, the national survey, and four focus groups, earlier findings by Musselwhite (2006) that there are four distinguishable groups of drivers. We have labeled them low risk threshold, high risk threshold, opportunistic, and reactive (Fuller, Bates, et al., 2008). Risk threshold in this context refers to the upper limit of task difficulty a driver will accept (i.e., the smallest separation between perceived task demand and capability).
Low risk threshold drivers comply with speed limits, reduce their speed if they realize they are traveling faster than the speed limit, and are unlikely to change their driving behavior in a 30 mph (50 km/h) zone as a result of momentary influences, including if they are in a hurry. They are typically older, more experienced, and represent approximately 40% of male and female drivers.
In marked contrast, high risk threshold drivers have positive attitudes to high-risk behavior and a thrill-seeking and expressive use of their car (Machin & Sankey, 2008), often as part of a youth subculture that exploits driving as a recreational activity that is functionally related to their life situation (Møller & Gregersen, 2008). They drive at higher speeds; commit more, and more extreme, speed limit violations and other forms of dangerous driving behavior; and have more convictions. Not surprisingly, they are more involved in collisions. Members of this group are typically young, inexperienced, and male, and they are poorly calibrated. They represent approximately 14% of drivers.
The origins of the driving style of at least some members of this group may date back to early childhood. In a seminal paper by Vassallo et al. (2007), which was concerned in part with identifying longitudinal precursors of high-risk driving behavior, three clusters of drivers were identifiable at ages 19 and 20 years who differed reliably in their engagement with risk-related driving behaviors, such as excessive speeding, drink driving, drug driving, driving when fatigued, and not using seat belts. Members of the high-risk group, which comprised 7% of their sample of 1135 young adults, were mainly male (77%) and were found to have been involved in more speeding offenses and collisions. Compared with others, they were more antisocial in behavior and choice of friends, more aggressive, more irresponsible, showed less empathy, and were more likely to engage in maladaptive coping (e.g., multisubstance use). However, particularly intriguing in their findings was that the characteristics of antisocial behavior and aggressiveness differentiated between the groups as early as ages 5–8 years and persisted throughout later childhood and adolescence. Does this finding imply that we can identify certain types of high-risk driver as soon as they are old enough to go to school? If so, what implications might this have for early intervention?
Opportunistic drivers do not pursue high speed for its own sake, unlike the high risk threshold drivers. They tend to adjust their speed to the conditions rather than to the speed limit, and they will exceed the limit if they believe it is safe to do so. They exploit opportunities to get ahead. Approximately 23% of drivers can be labeled as primarily opportunistic, and they are more likely to be male than female. The latter, on the other hand, are more likely to be reactive drivers. This group is not persistently concerned with making good progress and tends to avoid unsafe high speed and dangerous overtaking. However, such drivers can be strongly influenced by their emotional state, driving faster if annoyed or angry or under time pressure. Consistent with this is the finding in a questionnaire study by Björklund (2008) that women drivers report more irritation than men when impeded or exposed to reckless driving, and evidence presented by Lustman and Wiesenthal (2008) that female drivers report more aggression than men when feeling low levels of anger in similar scenarios.
Dispositional influences on driver risk threshold, and therefore speed choice (potentially), are partly captured by the social and cognitive variables that form the core elements of the theory of planned behavior (TPB), notably intentions, attitudes, and perceived social norms. However, correlations between measures of these variables and measures of actual behavior are not particularly strong, perhaps explaining approximately 25% of the variance in the behavioral variable (Åberg & Wallén Warner, 2008), and it is perhaps self-evident that such a conceptual approach cannot provide a comprehensive model of dispositional influence and most certainly not an account of real-time speed decisions by drivers. Thus, Paris and Van den Broucke (2008) conclude in an evaluation of TPB that actual speeding behavior can only partially be predicted from TPB concepts and that
the cognitive determinants of safe driving as identified by the TPB need to be complemented by other factors, including less “conscious” cognitive factors such as personal identity and habit formation, as well as external factors, such as cues to action, reinforcers, or the design of roads. (p. 179)
3. Task Difficulty Allostasis: Temporary Influences on Risk Threshold
In addition to dispositional differences, a wealth of research has demonstrated that several variables may temporarily raise a driver’s risk threshold. Such variables include feelings of anger and aggression, competitiveness, thrill-seeking to get an “adrenalin rush,” feelings of power, social influences, the pressure of being late, and to find out how fast a vehicle can go (Fuller, Bates, et al., 2008). For example, Ellwanger (2007) has shown that young drivers’ “delinquent” driving responses, such as speeding, aggressive driving, and risk taking, are strongly correlated with individuals’ ascribing their frustration to the voluntary and intentional actions of others on the road. Jamson (2008) reported that drivers drive closer to the car in front when their emotions are aroused. Similarly, King and Parker (2008) showed that relatively high levels of anger are associated with increased commission of both aggressive and highway code violations and that accident-involved drivers are more angry and hostile than accident-free drivers.
This evidence of factors that may have an immediate influence on the level of task difficulty that drivers are prepared to accept implies that the hypothesis of task difficulty homeostasis is not completely satisfactory and that a more appropriate concept is that of allostasis. Whereas homeostasis is the process by which a target condition is maintained in the face of external variation in a negative feedback loop system, allostasis refers to adaptation to a more dynamic target condition and is defined as maintaining certain levels of biological conditions that vary according to an individual’s needs and circumstances (Kalat, 2008). So what we should really be discussing here is task difficulty allostasis.
As an example of this allostatic variation in needs and circumstances, consider results from a study examining the conditions under which drivers of emergency service vehicles are more likely to crash (Gormley et al., 2008 and Walsh et al., 2008). For both ambulances and fire trucks, significantly more collisions are reported under blue light (BL) conditions (responding to an emergency situation with blue lights on and usually with accompanying siren) than under non-blue light (nBL) conditions. For every one nBL collision there were three BL collisions. This contrast is useful in the sense that fire trucks provide their own controls for a comparison of driving under time pressure in one direction and without that pressure in the other (albeit confounded by condition order). Drivers were quite open about their acceptance of an increased task demand level on the way to a serious case:
You can justify driving at a certain speed when its three kids in a house, if you’re standing in front of a judge. You can’t justify that kind of driving if it’s a bin on fire. —Participant 3
4. Compliance
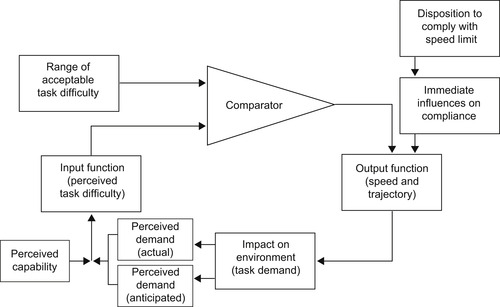
One further component now needs to be added to the model to make it more complete. The decision output from the process of task difficulty allostasis may be an achievable speed but which is in excess of the legal limit for the road segment in question. Hence, we need to include the driver’s disposition to transfer from choosing a speed based solely on task difficulty to a speed consistent with the legal limit (Figure 2.8).
Evidence indicates that there is considerable variation in drivers’ dispositions to comply with limits—variation that represents both more or less stable individual differences (as discussed in Section 2.4.6; see Fuller, Bates, et al., 2008) and momentary influences on compliance (Stradling et al., 2008).
With regard to individual differences, cognitive style may relate to degree of noncompliance with limits (and other forms of deviant behavior), particularly whether or not the individual tends to focus on potentially positive outcomes of choices and discount potentially harmful consequences or vice versa. Lev, Hershkovitz, and Yechiam (2008) showed that in a gambling task, traffic offenders give more weight to gains compared with losses, relative to control drivers, with the implication that when speeding their minds are more focused on the gains involved rather than the possible costs in terms of detection and penalty or loss of control. Interestingly, they were also found to be more extroverted, which would also dispose them to be more sensation-seeking in their profiles.
Despite individual differences in disposition to comply, whatever its basis, violation of speed limits is a pervasive phenomenon: The OECD estimates that at any one time, approximately 50% of drivers are exceeding the speed limit (OECD/European Conference of Ministers of Transport, 2006). It is important to note that for a large proportion of drivers, this behavior does not necessarily represent some kind of willful contempt for rules and regulations but is rather an expression of their maintaining a preferred level of task difficulty—adjusting task demand to the prevailing conditions as they perceive them—hence their anger at getting caught and fined and the general lack of social censure from others for minor violations. In the HUSSAR study discussed previously, all four of the focus groups supported the view that noncompliance is not necessarily unsafe and that an immediate influence supporting noncompliance is that the speed limit is perceived to be too low.
5. Risk Allostasis Theory
Prevalent emotions concerning speed choice are likely to be fear and frustration, with fear associated with the upper level of difficulty tolerated (the driver’s risk threshold) and frustration the lower level, arising from deviations from driving goals that would otherwise have been positively or negatively rewarding. In relation to fear, in 1964, Taylor concluded from on-road observations of drivers’ autonomic activity that drivers adopt a level of anxiety that they wish to experience when driving and then drive so as to maintain it. Mesken, Hagenzieker, Rothengatter, and de Waard (2007) studied participants who drove an instrumented car in real road environments and gave self-reports at critical points. They found that anxiety associated with safety-related events was the most frequent on-road emotion (from a choice restricted to anger, nervousness, and happiness), and this was in turn associated with increased perceived risk (and heart rate).
In the HUSSAR study (Stradling et al., 2008), in response to the open road scenario, feelings of risk were positively correlated with ratings of task difficulty (r=0.64) and significantly inversely related to perceived safety margin: The larger the margin, the less the feeling of risk. Most respondents (76%) agreed that if they drove any faster than normal, they would feel less in control, the task of driving would be more difficult (67%), and it would feel too risky (75%).
The upshot of this link between perceived task difficulty and risk feeling, discovered in our digital video studies mentioned previously (Fuller, McHugh, et al., 2008), is that we can now refer to the model as risk allostasis theory (RAT) (which is somewhat more pithy than the hypothesis of task difficulty allostasis subsumed within the TCI model). With this change in nomenclature, it is important to stress that we are not simply substituting allostasis for homeostasis in the theory known as risk homeostasis (Wilde, 1982). In Wilde’s model, the risk concept is operationalized in terms of feelings of risk in conjunction with statistical risk estimates (Simonet & Wilde, 1997). Estimates of statistical risk have no part to play in RAT, and this rejection of the role of statistical risk in driver decision making has also been emphasized by Vaa in his critical analysis of RHT (Vaa, 2007, pp. 214 and 266). Furthermore, in RHT, the determination of preferred risk levels (“target risk” in Wilde’s terminology) arises out of an inferred cost–benefit analysis of safe and risky behavioral choices rather than the variables of perceived capability, journey goals, effort motivation, and dispositional and immediate factors identified in RAT.
5.1. The Role of Feelings in Decision Making
The role of feelings in decision making has a long history, being explored, for example, in the early work on emotion of William James and Carl Lange in the nineteenth century and significantly developed as a concept in the work of Zajonc in the twentieth century (Zajonc, 1980). Nevertheless, one gets a sense that the so-called cognitive revolution has until relatively recently largely neglected this role. However, a new emphasis on the importance of emotion and feeling in decision making has emerged in particular through the work of Damasio, 1994 and Damasio, 2003, with his concept of the “somatic marker hypothesis.” Before discussing this hypothesis, it is useful to briefly consider the fundamental role of feelings in motivation.
Feelings are the experiences concomitant with reward and punishment, with incentives and deterrents, with things we seek and things we avoid. They are the engines of the values we have and the goals we seek. Thus, although our decisions about how to realize our goals may principally involve cognitive operations, it is feelings that select our goals, enabling us to choose between them, and that energize or motivate our approach to them.
Driving goals are no different. They are similarly feelings motivated and must involve at the same time both positive, approach-motivating feelings associated with the achievement of the mobility goal (destination, journey, or both), and negative, avoidance-motivating feelings associated with collision or road run-off.
Once goals are identified, to a certain extent we can leave it up to cognitive operations to guide decisions that enable us to attain these goals. From a feeling perspective, however, there is one important difference between goals of approach and goals of avoidance. In the former, feelings (positive) intensify as the goal becomes nearer and are presumably fully experienced when the goal is reached. In the latter, feelings (negative) decrease to the extent that the avoidance goal is achieved. Thus, negative feelings are presumably rarely fully experienced when avoidance is successful (as is the case nearly all of the time when driving), thus giving the impression that feelings of risk, for example, are generally not important in decision making (Lewis-Evans & Rothengatter, 2009). As Carver and Scheier note (1981, p. 199), “self-regulation is relatively affect free as long as normal discrepancy reduction processes are uninterrupted and are proceeding without difficulty [italics added].” However, “when discrepancies cannot be easily reduced, then affective processes become important” (pp. 360–361). Despite this assertion, it is most important to stress that the stimuli that trigger avoidance responses must retain their emotive characteristic; otherwise, they will become neutral stimuli—mere shadows that are powerless to elicit an avoidance response. The driver still has risk feelings associated with objects to be avoided: These are what determine avoidance goals. However, when operating with a safe margin from objects to be avoided, those feelings are not intensified and may not enter conscious awareness.
It is this condition that is captured so well by Summala’s zero-risk hypothesis, with risk feelings only kicking in when the safety margin has shrunk to some critical level. Summala’s (2007) model argues that action is continuously monitored by a subjective risk/fear monitor, but this only plays a role in decisions when some threshold has been reached. However, Summala’s view is surely untenable: Risk feelings must continuously play a part to enable the driver to maintain safety margins, even if they have the characteristic of “whispers of affect,” as Slovic, Finucane, Peters, and MacGregor (2002) described such responses. Without continuously taking account of the emotions triggered by elements in the road and traffic environment and discrepancies between current and goal states, the driver would have no basis for decision making for his or her choices. (To test this phenomenon directly when driving, keep your eyes closed and note the rapid onset of risk feeling as you proceed. Note that this test is not recommended from a safety perspective.)
Interestingly, in a study for the Irish Road Safety Authority, we obtained evidence that suggests that younger drivers are less disposed to think (and presumably therefore feel) immediately of the severest consequences of extremely dangerous behavior (Gormley & Fuller, 2008). In an interview survey of 1039 male drivers attending the World Rally Championships in Ireland in 2007, we presented the following crash scenario and asked respondents to list as many consequences as occurred to them. Participants were distributed approximately equally across the four age groups of 17–19, 20–22, 23–25, and 26–28 years:
I am now going to describe to you a crash and when I finish I would like you to tell me what you think the consequences might be:
“John, a young man of 20, loved driving fast and showing his mates how he could push his car to the limit. One rainy day, with two of his mates with him in the car, he took a corner too fast, lost control, and slammed into a tree at 120 km/h (approximately 75 mph).”
What do you think might be the consequences of this crash?
In the subsequent analysis, attention was paid to the order in which particular responses were given. The three main categories of consequence identified in order of frequency were death, serious injury, and damage to car/property. No differences between age groups were found in the frequency of reporting any particular category. However, death was significantly less likely to be mentioned early as a consequence by the youngest group of drivers. Consistent with this, in a survey of young drivers in compulsory service in the Israeli Defense Forces, Taubman–Ben-Ari (2008) found that the cost of risk to life was not a predictor of any reckless driving measure. In a comprehensive review of brain imaging studies and decision making, Glendon (2008) noted that less well-developed executive functions of the brain in late adolescence may mean that implications of hazards are not so readily accessed. Linked to this is the observation that the integration of emotion with cognition, which appears to be mediated by the amygdala and hippocampus, is still maturing during this period.
5.2. The Somatic Marker Hypothesis
In the somatic marker hypothesis, Damasio argues that elements of experience, such as objects, persons, and scenarios, automatically trigger an emotional response, albeit often only a weak one, whenever their representation is activated in the brain by either external or internal stimuli. Damasio proposes that in any situation requiring a decision, emotional signals “mark options and outcomes with a positive or negative signal that narrows the decision-space and increases the probability that the action will conform to past experience” (Damasio, 2003, p. 148). This emotional signal has an auxiliary role that increases the efficiency of the reasoning process and is not usually a substitute for it. However, when we immediately reject an option that would lead to certain disaster, reasoning may be “almost superfluous”: The action may be taken without some intervening conscious cognitive processing. Because emotional signals are body related, Damasio labeled this set of ideas the somatic marker hypothesis. Through learning, somatic markers can become linked to stimuli and patterns of stimuli. When a negative somatic marker is linked to an image of a future outcome, it sounds an alarm. Slovic et al. (2002) refer to a similar concept as the “affect heuristic.”
The key conclusions, however, are that not only is affect essential to rational action but also affective responses have a direct effect on cognitive operations (see Fuller (2007) for a complete exposition of Damasio’s conceptualization). Note that, as discussed previously, emotional responses in the form of somatic markers arise not only from stimuli external to the driver but also from perceived discrepancies between goal states and current states. Included in these discrepancies are where task demand exceeds the upper limit preferred by the driver (yielding a conscious feeling of anxiety, risk, or fear) and where progress goals are thwarted (yielding a conscious feeling of frustration, anger, or rage).
The relevance of the somatic marker hypothesis for driver decision making has been discussed by Summala (2007), who suggests that “in dynamic time-limited situations like driving, fast affective heuristics must have a big role” (p. 198), and its potential implications for driver safety have been discussed by Fuller, 2005b and Fuller, 2007. Increases in risk may not be felt because of suppressed emotional reactivity (e.g., through alcohol, depression, denial, desensitization, and perhaps in conditions in which the outcome of the decision is uncertain; van Dijk & Zeelenberg, 2006) or because of the swamping effect of other emotions (e.g., anger and exhilaration). If felt, risk feelings may be misattributed to events other than those related to accomplishing the driving task (e.g., anxiety from interaction with a passenger). Furthermore, experience may not have been sufficient to provide learning opportunities to link particular scenarios to feelings of risk (as with a novice driver) (Kinnear et al., 2008 and Wickens et al., 2008). These and related issues for further research are discussed by Fuller (2005c) and a preliminary study of the contrasting roles of emotion and cognitive decision making as dispositional characteristics of drivers has been reported by Wickens et al. (2008).
6. Alternative Conceptualizations of Driver Goals
Turning to recent proposals for what constitutes the driver’s control goals when driving, Vaa (2007) develops the implications of the somatic marker hypothesis for driver behavior in his “monitor model.” This argues that drivers may make adjustments to the prevailing road and traffic conditions with varying degrees of conscious awareness, on a continuum from unconscious adjustment to fully conscious decision making. He proposes that although risk feeling may describe one homeostatic target for drivers (referred to as tension/anxiety), other feelings may also be targeted. Candidates he suggests as “other feelings” are avoidance of threat or difficulty, compliance and noncompliance, arousal, sensation, joy, and relaxation.
Feelings of avoidance of threat or difficulty are clearly related to task difficulty and feelings of risk, as discussed as targets in RAT, which also now incorporates dispositional and immediate influences on compliance. However, the wider range of target states motivating driver decision making proposed by Vaa’s monitor model describe rather the dispositional motives and immediate influences on risk threshold as described in RAT. Rather than being target conditions in themselves, I argue that dispositional motives and immediate influences operate to “set” the target level of risk feeling in the negative feedback control loop. Thus, the driver looking for more arousal raises his or her risk threshold to achieve that state, and the driver wanting to relax does the opposite.
Summala’s theoretical development also appears to be moving in a more inclusive direction. Whereas the 1976 conceptualization developed with Risto Näätänen (Näätänen & Summala, 1976) postulated a subjective risk monitor that kicked in when risk experience exceeded a risk threshold, to both alert the driver and influence decision making, Summala now suggests that drivers operate not with just one target variable but with a whole range of them (Summala, 2007). He invokes the umbrella concept of a “comfort zone” to represent the range of values relating to each variable that drivers are assumed to be motivated to target: “It is hypothesized that drivers normally keep each of them within a certain range (or above a certain threshold) in a comfort zone” (p. 201). Comfort is defined as a general mood or emotion that is “pleasant but not especially aroused, tense, or activated” (p. 201).
Included in Summala’s (2007) target variables are space and time margins and mental load specifically relating to control. He also includes motivation for compliance. These variables may be translated in terms of the concept of a target range of task difficulty (operationalized in terms of time to collision and time to line crossing) and influences on compliance as represented in RAT. However, Summala adds various other target variables, including comfort in relation to thermal state, seating, vibration, glare, and rate of speed change and progress. Clearly, Summala’s model is shifting from one specifically concerned with control and collisions to one concerned with more general motives that inform driver decision making. From the perspective of RAT, “glare” and “rate of speed change and progress” may be subsumed under task demand (and therefore task difficulty) elements. However, Summala’s other comfort motives must be secondary to those relating to safety motivation. A driver will hardly survive for very long without crashing if he or she prioritizes temperature, seating comfort, or vibration as the target states that direct decision making. As pointed out by Carver (1994), “certain kinds of discrepancies are more demanding—more important—than others.… For example, the experience of threat to one’s physical safety can override an attempt to engage in activities that are otherwise quite important” (p. 389).
Nevertheless, these suggestions by Summala have enriched our conceptualization of potential aspects of driver motivation (we await empirical validation), even though their relevance to our understanding of why collisions occur is unclear. RAT is concerned with representing the process of driver decision making and in particular how motivations influence the outcome for system safety. However, in principle, it can be expanded to include the kinds of motives proposed by Summala. Their influence may be included in RAT as a top-down controlled hierarchy of secondary reference targets in decision making. Because a safe outcome normally has to be prioritized, they must enter the decision-making process after risk allostasis decisions have been made, perhaps at the point in the process where influences on compliance also have their effect.
Summala’s extended target variables nevertheless raise a further question: When a control system has multiple reference standards, as he suggests, how do they operate in relation to each other? For example, are they implemented in serial order, as suggested in RAT, where compliance standards emerge as secondary to task difficulty targets, or can they operate in parallel? If the latter, the further question remains as to how their separate outputs are eventually integrated into the behavioral decision. Thus, if task difficulty is calling for an increase in speed and simultaneously compliance is calling for a reduction, how is the conflict resolved by his system?
Perhaps the main conclusion to be drawn here is that despite the discrepancies that have emerged in conceptualizations of what drivers are aiming for in their decision making, these apparent tensions may in fact reflect a hidden consensus. At least, from the perspective of RAT, that is what I have tried to demonstrate.
RAT proposes that driver control decisions are motivated by a desire to maintain feelings of risk (and its corollary task difficulty) within an acceptable range, even though for much of the time these feelings may be below the level of conscious awareness. The acceptable level of risk feeling and task difficulty may vary as a function of factors such as journey goals and emotional state, and there appear to be individual differences in preferred levels related to age, experience, gender, and personality. Constraints on the driver’s freedom to manage this process unavoidably arise from performance limitations of the vehicle as well as through obstructions caused by congested traffic flow that force driving at a lower level of task demand than that preferred. Freedom may also be restricted by compliance with regulated speed limits.
With the development of RAT and related concepts advanced by Vaa and Summala, there is a current convergence in recognizing the primacy of the role of feeling in driver decision making. As Laertes says in Shakespeare’s Hamlet, “best safety lies in fear,” and this recognition opens up a whole new set of exciting and promising research questions.
References
Åberg, L.; Wallén Warner, H., Speeding—Deliberate violation or involuntary mistake?European Review of Applied Psychology 58 (2008) 23–30.
Allen, T.M.; Lumenfeld, H.; Alexander, G.J., Driver information needs, Highway Research Record 366 (1971) 102–115.
Andrey, J.; Mills, B.; Leahy, M.; Suggett, J., Weather as a chronic hazard for road transportation in Canadian cities, Natural Hazards 28 (2–3) (2003) 319–343.
Björklund, G.M., Driver irritation and aggressive behaviour, Accident Analysis and Prevention 40 (2008) 1069–1077.
Broughton, J., Les vitesses en Grande-Bretagne, In: (Editor: Delorme, R.) Les regimes français et brittanique du régulation du risque routière: La vitesse d’abord (2005) Centre Pour la Recherche Économique et ses Applications, Paris, pp. 29–38.
Campbell, M.; Stradling, S.G., Factors influencing driver speed choices, In: Behavioural research in road safety: Thirteenth seminar (2003) Department for Transport, London, pp. 233–244.
Carver, C.S., Cognitive processes and self-regulation: Determinants of concentration and distraction, Applied Psychology: An International Review 43 (3) (1994) 387–391.
Carver, C.S.; Scheier, M.F., Attention and self-regulation: A control-theory approach to human behavior. (1981) Springer-Verlag, New York.
Damasio, A.R., Descartes’ error: Emotion, reason and the human brain. (1994) Putnam, New York.
Damasio, A.R., Looking for Spinoza: Joy, sorrow and the feeling brain. (2003) Heinemann, London.
de Craen, S., The X-factor. A longitudinal study of calibration in young novice drivers (TRAIL thesis series T2010/2). (2010) TRAIL Research School, Delft, The Netherlands.
Ellwanger, S.J., Strain, attribution, and traffic delinquency among young drivers: Measuring and testing general strain theory in the context of driving, Crime and Delinquency 53 (4) (2007) 523–551.
Fastenmeier, W.; Gstalter, H., Driving task analysis as a tool in traffic safety research and practice, Safety Science 45 (9) (2007) 952–979.
Fuller, R., A conceptualisation of driving behaviour as threat avoidance, Ergonomics 27 (1984) 1139–1155.
Fuller, R., Prolonged driving in convoy: The truck driver’s experience, Accident Analysis and Prevention 16 (1984) 371–382.
Fuller, R., The task–capability interface model of the driving process, Recherche Transports Sécurité 66 (2000) 47–59.
Fuller, R., Towards a general theory of driver behaviour, Accident Analysis and Prevention 37 (2005) 461–472.
Fuller, R., Control and affect: Motivational aspects of driver decision-making, In: (Editors: Macchi, L.; Re, C.; Cacciabue, P.C.) Proceedings of the international workshop on modelling driver behaviour in automotive environments (2005) Office for Official Publication of the European Communities, Luxembourg, pp. 45–52.
Fuller, R., Driving by the seat of your pants: A new agenda for research, In: Behavioural research in road safety 2005, fifteenth seminar (2005) Department for Transport, London, pp. 85–93.
Fuller, R., Motivational determinants of control in the driving task, In: (Editor: Cacciabue, P.) Modelling driver behaviour in automotive environments: Critical issues in driver interactions with intelligent transport systems (2007) Springer-Verlag, London, pp. 165–188.
Fuller, R.; Bates, H.; Gormley, M.; Hannigan, B.; Stradling, S.; Broughton, P.; Kinnear, N.; O’Dolan, C., The conditions for inappropriate high speed: A review of the research literature from 1995 to 2006 (Road Safety Research Report No. 92). (2008) Department for Transport, London.
Fuller, R.; McHugh, C.; Pender, S., Task difficulty and risk in the determination of driver behaviour, European Review of Applied Psychology 58 (2008) 13–21.
Godthelp, J., The limits of path error neglecting in straight lane driving, Ergonomics 31 (1988) 609–619.
Gormley, M.; Fuller, R., Investigation of high risk behaviour in Irish young male drivers. (2008) Report to the Road Safety Authority, Government Offices, Ballina, Ireland.
Gormley, M.; Walsh, T.; Fuller, R., Risks in the driving of emergency service vehicles, Irish Journal of Psychology 29 (1–2) (2008) 7–18.
Harré, N.; Sibley, C.G., Explicit and implicit self-enhancement biases in drivers and their relationship to driving violations and crash-risk optimism, Accident Analysis and Prevention 39 (6) (2007) 1155–1161.
Horrey, W.J.; Lesch, M.F.; Garabet, A., Assessing the awareness of performance decrements in distracted drivers, Accident Analysis and Prevention 40 (2) (2008) 675–682.
Kalat, J.W., Introduction to psychology. 8th ed (2008) Thomson, New York.
Kilpeläinen, M.; Summala, H., Effects of weather and weather forecasts on driver behaviour, Transportation Research Part F 10 (2007) 288–299.
King, Y.; Parker, D., Driving violations, aggression and perceived consensus, European Review of Applied Psychology 58 (2008) 43–49.
Kinnear, N.; Stradling, S.; McVey, C., Do we really drive by the seat of our pants? In: (Editor: Dorn, L.) Driver behaviour and training, Vol. 3 (2008) Ashgate, Aldershot, UK, pp. 349–365.
Lam, L.T., Factors associated with fatal and injurious car crash among learner drivers in New South Wales, Australia, Accident Analysis and Prevention 35 (2003) 333–340.
Larsen, L., Factors affecting drivers’ choice of speed. (1995) IAAP Symposium, Madrid.
Lev, D.; Hershkovitz, E.; Yechiam, E., Decision making and personality in traffic offenders: A study of Israeli drivers, Accident Analysis and Prevention 40 (1) (2008) 223–230.
Lewis-Evans, B.; Charlton, S.G., Explicit and implicit processes in behavioural adaptation to road width, Accident Analysis and Prevention 38 (2006) 610–617.
Lewis-Evans, B.; Rothengatter, T., Task difficulty, risk, effort and comfort in a simulated driving task: Implications for risk allostasis theory, Accident Analysis and Prevention 41 (2009) 1053–1063.
Liu, B.-S.; Lee, Y.-H., Effects of car-phone use and aggressive disposition during critical driving maneuvers, Transportation Research Part F–Traffic Psychology and Behaviour 8 (2005) 369–382.
Loewenstein, G.F.; Weber, E.U.; Hsee, C.K.; Welch, N., Risk as feelings, Psychological Bulletin 127 (2001) 267–286.
Machin, M.A.; Sankey, K.S., Relationships between young drivers’ personality characteristics, risk perceptions, and driving behaviour, Accident Analysis and Prevention 40 (2) (2008) 541–547.
Mesken, J.; Hagenzieker, M.P.; Rothengatter, T.; de Waard, D., Frequency, determinants, and consequences of different drivers’ emotions: An on-the-road study using self-reports, (observed) behaviour, and physiology, Transportation Research Part F 10 (2007) 458–475.
Michon, J.A., Explanatory pitfalls and rule-based driver models, Accident Analysis and Prevention 21 (1989) 341–353.
Møller, M.; Gregersen, N.P., Psychosocial function of driving as predictor of risk-taking behaviour, Accident Analysis and Prevention 40 (1) (2008) 209–215.
Musselwhite, E.C., Attitudes towards vehicle driving behaviour: Categorising and contextualising risk, Accident Analysis and Prevention 38 (2006) 324–334.
Näätänen, R.; Summala, H., Road user behaviour and traffic accidents. (1976) North Holland/Elsevier, Amsterdam/New York.
Organisation for Economic Co-operation and Development, Young drivers: The road to safety. (2006) ; Paris.
Organisation for Economic Co-operation and Development/European Conference of Ministers of Transport, Speed management. (2006) ; Paris.
Paris, H.; Van den Broucke, S., Measuring cognitive determinants of speeding: An application of the theory of planned behaviour, Transportation Research Part F 11 (2008) 168–180.
Patten, C.J.D.; Kircher, A.; Östlund, J.; Nilsson, L.; Svenson, O., Driver experience and cognitive workload in different traffic environments, Accident Analysis and Prevention 38 (2006) 887–894.
Ranney, T.A., Models of driving behavior: A review of their evolution, Accident Analysis and Prevention 26 (1994) 733–750.
Saad, F.; Delhomme, P.; Van Eslande, P., Drivers’ speed regulation when negotiating intersections, In: (Editor: Koshi, M.) Transportation & traffic theory (1990) Elsevier, Amsterdam, pp. 193–212.
Simonet, S.; Wilde, G.J.S., Risk: Perception, acceptance and homeostasis, Applied Psychology: An International Review 46 (1997) 235–252.
Slovic, P.; Finucane, M.L.; Peters, E.; MacGregor, D.G., Risk as analysis and risk as feelings. Some thoughts about affect, reason, risk and rationality. Paper presented at the annual meeting of the Society for Risk Analysis. (2002) Louisiana, New Orleans; December 10, 2002.
Stradling, S.; Broughton, P.; Kinnear, N.; O’Dolan, C.; Fuller, R.; Bates, H.; Gormley, M.; Hannigan, B., Understanding inappropriate high speed: A quantitative analysis (Road Safety Research Report No. 93). (2008) Department for Transport, London.
Summala, H., Risk control is not risk adjustment: The zero-risk theory of driver behavior and its implications, In: Reports (No. 11) (1986) University of Helsinki Traffic Research Unit, Helsinki.
Summala, H., Towards understanding motivational and emotional factors in driver behaviour: Comfort through satisficing, In: (Editor: Cacciabue, P.) Modelling driver behaviour in automotive environments: Critical issues in driver interactions with intelligent transport systems (2007) Springer-Verlag, London, pp. 189–207.
Taubman–Ben-Ari, O., Motivational sources of driving and their associations with reckless driving cognitions and behavior, European Review of Applied Psychology 58 (2008) 51–64.
Taylor, D.H., Drivers’ galvanic skin response and the risk of accident, Ergonomics 7 (1964) 439–451.
Uzzell, D.; Muckle, R., Simulating traffic engineering solutions to predict changes in driving behaviour, Transportation Research Part F—Traffic Psychology and Behaviour 8 (2005) 311–329.
Vaa, T., Modelling driver behaviour on basis of emotions and feelings: Intelligent transport systems and behavioural adaptations, In: (Editor: Cacciabue, P.) Modelling driver behaviour in automotive environments: Critical issues in driver interactions with intelligent transport systems (2007) Springer-Verlag, London, pp. 208–232.
Van der Horst, R., Time-related measures for modeling risk in driver behaviour, In: (Editor: Cacciabue, P.) Modelling driver behaviour in automotive environments: Critical issues in driver interactions with intelligent transport systems (2007) Springer-Verlag, London, pp. 235–252.
Van der Hulst, M.; Meijman, T.; Rothengatter, T., Anticipation and the adaptive control of safety margins in driving, Ergonomics 42 (2) (1999) 336–345.
van Dijk, E.; Zeelenberg, M., The dampening effect of uncertainty on positive and negative emotions, Journal of Behavioral Decision Making 19 (2006) 171–176.
Vassallo, S.; Smart, D.; Sanson, A.; Harrison, W.; Harris, A.; Cockfield, S.; McIntyre, A., Risky driving among young Australian drivers: Trends, precursors and correlates, Accident Analysis and Prevention 39 (2007) 444–458.
Walsh, T.; Hannigan, B.; Fuller, R., Risk and the driving of emergency service vehicles. Behavioural research in road safety 2008. (2008) Department for Transport, London.
Wickens, C.D.; Hollands, J.G., Engineering psychology and human performance. 3rd ed (2000) Prentice Hall, Upper Saddle River, NJ.
Wickens, C.M.; Toplak, M.E.; Wiesenthal, D.L., Cognitive failures as predictors of driving errors, lapses, and violations, Accident Analysis and Prevention 40 (2008) 1223–1233.
Wikman, A.S.; Nieminen, T.; Summala, H., Driving experience and time-sharing during in-car tasks on roads of different width, Ergonomics 41 (3) (2008) 358–372.
Wikman, A.S.; Summala, H., Aging and time-sharing in highway driving, Optometry and Vision Science 82 (8) (2005) 716–723.
Wilde, G.J.S., The theory of risk homeostasis: Implications for safety and health, Risk Analysis 2 (1982) 209–225.
Young, M.S.; Mahfoud, J.M.; Walker, G.H.; Jenkins, D.P.; Stanton, N.A., Crash dieting: The effects of eating and drinking on driving performance, Accident Analysis and Prevention 40 (1) (2008) 142–148.
Zajonc, R.B., Feeling and thinking: Preferences need no inferences, American Psychologist 35 (1980) 151–175.