Chapter 6. Naturalistic Driving Studies and Data Coding and Analysis Techniques
Sheila G. Klauer, Miguel Perez and Julie McClafferty
Virginia Tech Transportation Institute, Blacksburg, VA, USA
A better understanding of driver behavior is a critical component for future safety improvements on the roadways of the world. Naturalistic driving studies offer this unique insight into precise driver behavior under normal driving conditions but also in those critical seconds leading up to crashes and near-crashes. This chapter presents the life cycle of naturalistic driving studies with an emphasis on the coding procedures required to accurately and precisely capture these critical driving behaviors. This technique will be important for safety researchers worldwide to understand, use, and assess as large naturalistic driving study databases become publicly available. These publicly available databases will be a very rich source of driver behavior information that should be used by safety researchers to better understand, model, and develop effective crash mitigation technologies that will dramatically improve safety on the world’s roadways in the near future.
1. Introduction
Governments and citizens worldwide are mobilizing to reduce motor vehicle fatality and injury rates. Sweden has a goal of zero fatalities (Vision Zero) nationwide by 2020, and many European countries are following Sweden’s lead with major reduction goals of their own. The Chinese government has doubled its spending on transportation every year for the past 5 years and has set goals for reductions in fatalities and automobile injuries. The United States has set ambitious safety goals for commercial drivers but is also set on changing the U.S. safety culture regarding distracted driving (see the Department of Transportation’s website at www.distraction.gov).
Although roadway fatality and injury rates have dropped significantly during the past 50 years, these reductions have been primarily the result of improved safety belt use, air bag technology, improved crashworthiness of automobiles, and improved infrastructure (i.e., better guardrail design, roadway lighting, etc.). These improvements have had a major impact on fatality and injury rates; however, it is generally acknowledged that any further reduction in fatality and injury rates will be due to modifications in driver behavior.
It is widely accepted that driver error contributes to more than 90% of all automobile crashes (Lum & Reagan, 1995). To better understand human errors made while driving, traffic safety professionals have used either epidemiological research methods or controlled experimentation. Large crash databases based on information gleaned from police accident reports have been useful for broad questions but lack sufficient detail to study driver behavior that results in a crash. Although empirical research possesses sufficient detail, these data are collected in contrived environments and are unable to adequately capture normal driving environments and/or real crash situations.
Technological improvements have enabled traffic safety researchers to better study driver behavior in situ or in real-world traffic environments. Improvements in computer processing speed and data storage coupled with the reduction in physical size of these components have not only allowed instrumented vehicle studies to gather more parametric data but also resulted in vast improvements in video data collection. These improvements have not only allowed safety professionals to retrofit vehicles with state-of-the-art eye tracking systems, physiological monitoring equipment, and collision warning systems but also allowed for the large-scale collection of driving performance data for long periods of time (e.g., 100 vehicles for 1 year).
It is these technological improvements that will help to increase the amount of data regarding driver behavior in the seconds leading up to crashes. Thus, safety professionals will be able to assess data on actual crashes (like epidemiological databases) with high-resolution, detailed driving performance data (like empirical studies). These instrumented vehicle studies are an important tool for researchers to add to their safety tool box to improve safety on our roadways.
This chapter describes the traffic conflict technique and the theory behind the power of instrumented vehicle or naturalistic driving studies, the life cycle of naturalistic driving studies, and powerful analytic techniques that can and have been used with these data. Although instrumented vehicle studies range from one vehicle for a 30-min test period with an experimenter present to large-scale deployment of instrumented vehicles with data collected over a long period of time, this chapter focuses on the larger scale deployment studies, also known as naturalistic driving studies.
2. Traffic Conflict Technique
Many industrial safety researchers face challenges similar to those faced by transportation researchers when attempting to directly measure safety or predict the probability that an accident will occur given certain circumstances. In most settings, accidents that lead to injury or death are fairly rare events, and therefore any corrective action is reactive rather than proactive. Thus, it would be very beneficial to safety engineers if they were able to be more proactive in their abilities to determine unsafe acts that may eventually lead to injury or death.
Heinrich, Petersen, and Roos (1980) developed a hazard analysis technique based on the underlying premise that for every injury accident, there are many similar accidents in which no injury occurs. For example, for a unit group of 550 accidents of similar type and involving the same person, approximately 500 of these accidents would result in no injury, 49 would result in minor injuries, and only 1 may result in a major injury. The theory suggests that the same contributing factors occur for the no injury and minor injury accidents as for the major injury accidents. Thus, if the industrial engineer can identify contributing factors and reduce the number of no injury and minor injury accidents, it is possible to prevent the major injury accidents. The relationship among major injury accidents, minor injury accidents, and no injury accidents is called Heinrich’s triangle (Figure 6.1).

Following this premise, transportation researchers from GM developed a method using cameras and observing traffic conflicts at intersections (Parker & Zegeer, 1989). Their general definition of a traffic conflict is as follows: “An event involving two or more road users, in which the action of one user causes the other user to make an evasive maneuver to avoid a collision” (p. 4).
In the field of transportation research, this hazard analysis method has become known as the traffic conflict technique. This method has been used to estimate crash risk at intersections using a count of traffic conflicts rather than crashes. Wierwille et al. (2002) employed the traffic conflict technique by unobtrusively videotaping traffic at intersections to identify causes of driver errors (critical incidents), near-crashes, and crashes. They chose rural, suburban, and urban intersections that had a high percentage of collisions.
Variations of the traffic conflict technique have been developed for use on an instrumented vehicle. This modification involves cameras being strategically placed on one vehicle to determine the number of traffic conflict involvements for a particular driver (Dingus et al., 2001, Hanowski et al., 2000 and Mollenhauer, 1998; Wierwille et al., 2001). Dingus et al. (2006) used this modified version of the traffic conflict technique in their “100-Car Study” by videotaping a single driver and the environment surrounding a single vehicle to identify driver errors (critical incidents), near-crashes, and crashes that impacted the instrumented vehicle. This technique proved valuable in identifying the impacts of fatigue and distraction on light vehicle drivers and how fatigue and distraction increase crash risk among light vehicle drivers.
3. Philosophy of Large-Scale Instrumented Vehicle Studies
Large-scale instrumented vehicle studies can be conducted to assess the safety aspects of a particular in-vehicle system (these types of studies are also called field operational tests) or to better understand the driver behaviors that result in crashes. For both, it is important to note that it is the driver behavior in real-world conditions that is of the utmost importance for all resulting analyses. Instrumented vehicle studies are conducted to assess driver behavior under normal, daily pressures, on normal routes, and under normal traffic conditions. Thus, external validity will remain very high at the cost of internal validity or experimental control.
Although the experimenter cannot control the type of traffic patterns, environmental conditions, or driver state, the researcher will collect large amounts of data to assess and categorize these variables of interest. Thus, researchers recruit large numbers of participants and each participant experiences a long, continuous data collection period to ensure that adequate data are collected in all types of traffic patterns, environmental conditions, and driver states to make statistically valid assessments. The belief that large amounts of data will provide the critical amount of data is paramount in epidemiological research and is also true for large-scale instrumented vehicle studies.
One of the primary strengths of naturalistic driving studies is that they provide high-resolution driving performance data (parametric data) coupled with video data. These high-resolution data provide a rich and precise source of information about a driver’s behavior in a normal driving environment. These rich data sources are extremely valuable due to their precision regarding driver behavior. From these data sources, very large data sets (i.e., multiple terabytes) can also be produced that yield hundreds of near-crashes and tens of crashes. For example, in Dingus et al.’s (2006) 100-Car Study, continuous data were collected on 109 vehicles for a minimum of 12 months. The resulting data set was slightly more than 42,000hours of driving data, more than 6 terabytes (TB) of video, and it included 69 crashes, 761 near-crashes, and 8295 incidents. Depending on one’s background, this is either a large data set (6 TB) or a small data set (i.e., only 69 crashes). The important aspect is the precision of these data, whether they contribute to the large 6-TB data set or the 69 crashes. In both cases, the video of the driver’s behavior with the corresponding vehicle parametric data (i.e., vehicle speed, deceleration, Global Positioning System (GPS) location, lane position, lane deviation, etc.) yields a very rich data set.
These precise data lose power if the drivers are constantly reminded that they are participating in a driving study. In the spirit of maintaining “real-world” driving conditions, it is imperative that the drivers are not needlessly reminded that they are participating in a driving study. Thus, the instrumentation should be as minimal and unobtrusive as possible. The participants should not be required to consciously interact (i.e., turn the system on/off) with the data collection system, nor should the drivers be forced to drive to or from data collection points, etc. The drivers should be allowed to go about their daily lives as unimpeded as possible in order to collect the most realistic driving data under normal conditions.
4. Life Cycle of Naturalistic Vehicle Studies
Planning successful naturalistic driving studies requires the following four steps (Figure 6.2):
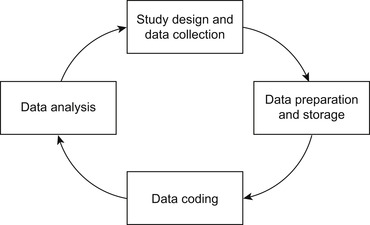
1. Study design and data collection
2. Data preparation and storage
3. Data coding
4. Data analysis
4.1. Study Design and Data Collection
For the completion of a successful naturalistic driving study, well-defined research questions should guide the selection of the critical data elements collected in the naturalistic study, the appropriate data analysis plan, and the successful design of the study. Although these steps may be critical for all research studies, the versatility and flexibility of naturalistic driving studies make it tempting to collect a large volume of data that do not directly relate to the primary research objectives. This is sometimes advantageous, but it will typically result in more expense and consumption of resources. Thus, researchers must carefully weigh the advantages and disadvantages of adding additional variables. Second, given the large volume of data collected, it is even more important to understand and plan for the analyses as part of the study design. If the data analysis plan truly dictates the data needs, the analyses will be successful. If this step is not thoughtfully considered, the data collected will not appropriately answer the research questions or will require extensive and resource-intensive data processing to produce the data to answer the research questions.
The appropriate study design will lead to the selection of the appropriate participant population as well as the collection of the appropriate video views and parametric data. Although there are a wide variety of potential data elements, commonly used elements are presented in Table 6.1.
As part of the study design, participants must be selected and recruited who are of the appropriate age, gender, and demographic distribution. Participants must also be protected because naturalistic driving procedures collect large amounts of identifying data. Identifying data not only include the driver’s face video data but also the GPS data that could indicate the location of residence, workplace, etc. Sensitivity and strict data collection procedures must be followed to ensure that participants’ privacy is protected.
For researchers in the United States, applying for a Certificate of Confidentiality from the National Institutes of Health is a key step in protecting participant privacy. This certificate ensures that participants’ identifying data cannot be subpoenaed for use in legal proceedings due to their participation in the research program. For example, if a participant made a serious error while on camera that resulted in an injury or fatal crash, the participant’s data should be protected from subpoena for use in court proceedings or insurance negotiations. Without this protection, safety research would prove very difficult because recruitment of driving study participants would be severely restricted.
4.2. Data Preparation and Storage
After the key data elements have been selected and incorporated into the data acquisition system (DAS), the appropriately sized data storage device must also be selected for the DAS. The collection of continuous data from vehicles, both video and parametric data, is not trivial. Reasonable quality video data rates are 6–8 megabytes of video per minute, which results in a passenger vehicle collecting 20 gigabytes of data per month. The video data typically comprise 80–95% of the total data collection compared to 5–15% for the vehicle parametric data.
Data collection at these rates currently precludes the use of wireless data transfer. Thus, the DAS must also incorporate data storage systems that can be easily removed and replaced, such as flash drives, hard disks, or solid-state disk devices. These data are removed from the vehicle and copied to permanent data storage for subsequent data preparation and eventual analysis.
After retrieving data from the vehicles, these data are copied and stored on network file servers for subsequent data processing and analysis. The selection of storage architecture can have considerable implications for the research project. When selecting file servers, key features such as processing speed, file servers that deliver data to researcher workstations, and links to database servers for hosting annotated data sets are critical components.
After the vehicle data are uploaded to the servers, software on these servers perform initial analyses, check data quality, summarize, and prepare the data for import into the data warehouse. Other processes may be applied at this time, such as any automated analyses of video data (i.e., automatic identification of driver via face video). Following this, the sensor data are imported into the data warehouse using standard extract, transform, and load processes. These data can then be made available to researchers to perform subsequent data mining and analysis.
4.3. Data Coding
Data coding using naturalistic driving data involves training multiple data coders to review the video and driving performance data and then record observed driver behaviors. To glean the rich driver behavior data from the video, some form of data coding will likely be required to aid in the usability of the data. Various examples of the power of data coding include obtaining estimates of relative risk for driving behavior, cataloging exposure, evaluating the sequence of actions in the seconds prior to crashes and near-crashes, and recording environmental/roadway variables that are not automatically recorded. One goal of data coding is to define a relatively complete set of data elements, while not precluding further data coding in the future, and to make the database more directly useful for search and analysis.
Given the vast amounts of data collected in naturalistic driving studies, it is not feasible to observe and record measurements for all data collected. Thus, depending on the research objectives, it is important to devise a method to automatically scan the driving performance data to identify moments in time when further data coding would be beneficial (i.e., automated trigger).
At a top level, manual data coding will be used to calibrate automated triggering based on driving performance data. Prior experience with automated triggering will be very useful in setting the initial criteria. However, some calibration will likely be required in order to use the upgraded DAS to its fullest potential. The goal of trigger calibration is to design triggering criteria so that as many potentially relevant moments are captured along with as few invalid (noncritical) triggers as possible.
Several types of automated triggering can be performed, with the most common types using vehicle kinematic data, GPS location data, or random selection. Triggering using the vehicle kinematic data identifies moments in time when the driver exceeds a set value (i.e., -0.55g longitudinal deceleration) or a combination of values (i.e., -0.55g longitudinal deceleration and time-to-collision value of 2.0 s or less). Both researchers and practitioners have used kinematic triggered data to identify safety critical events, such as crashes, near-crashes, or critical incidents, or identify “coachable” events when drivers are exceeding the safe limits of their vehicle.
Using kinematic data to identify safety-relevant events is process intensive. First, trained data reductionists view a sample of triggers created under a given set of criteria and place each trigger into a “valid” or “invalid” category. For example, to create triggers to identify crashes and near-crashes, valid triggers represent any conflict that did or could have resulted in a crash. Invalid triggers may appear as normal driving and are often driver specific (e.g., a driver who normally breaks hard) or as anomalies in the performance data. When criteria are tightened up to reduce the number of invalid triggers, this review of a sample of triggers is repeated, and a cross-check is also performed to ensure that the valid triggers found with the less restrictive criteria are still found with the more restrictive criteria and that the number of invalid triggers is reduced. When the criteria are finalized and the final triggers are generated, event classification begins.
GPS location can also be used to identify when a driver is negotiating a geographic location of interest. Locations of interest can include a specific geographic location or a geographic region. In the case of a geographic region, it is possible to use a “geofence” to encompass an area of interest to determine if the driver entered this area. These data, identified by research question, can include a priori defined intersections, merge ramps, road segments, shopping districts, or simply distance away from home that is not advisable for a novice driver. GPS data can also be used in conjunction with other sensor data such as vehicle speed. For example, all events when vehicle speed exceeds 70 mph and the vehicle is not on an interstate can be used to identify those moments when the driver is most likely speeding greater than 15 mph. Trained data coders typically must evaluate these trigger criteria as well, depending on how the GPS trigger is developed. It may also be important to include a heading value and/or sequence of GPS locations to ensure that the events selected are not vehicles driving on an overpass (i.e., on top of an intersection of interest) and/or through a geographic location from the preferred direction (i.e., traveling on a roadway through a specific intersection with multiple turn lanes/traffic signals).
Random selection of events can also be conducted to obtain a measure of “normal” or baseline driving. These samples are typically stratified based on a driver’s vehicle miles traveled or some other measure to ensure a normalized distribution of baseline samples. There are difficulties with the stratification procedure because the appropriate information is not always known throughout the entire data set (i.e., who the driver is for every given trip). Thus, the researcher must carefully select and establish appropriate selection criteria that will produce a statistically valid sample of baseline driving.
After the sample of events has been selected and identified, trained data coders then review the events. Trained data coders watch the appropriate video and the corresponding kinematic data for each of these events to verify that each event met all of the selection criteria, and then they record the relevant event, driver behaviors, environmental and roadway variables, and scenario-specific variables of interest. These elements include the following:
• Event variables: Variables used to establish the scenario and sequence of events prior to and through the critical event. These variables include event severity, event nature (e.g., conflict with lead vs. crossing vehicle), pre-incident maneuver, precipitating event, driver reaction, post-maneuver control, information about other drivers/vehicles/objects involved (e.g., type, position, maneuvers, and impairments), and fault assignment.
• Driver variables: Variables used to systematically describe driver state prior to and during the critical event. These include driver ID, driver behavior (e.g., speeding and aggressive driving), driver impairments (e.g., drowsiness, anger, and substance abuse), secondary task engagement and duration (e.g., cell phone use), placement of hands on the wheel, visual obstructions, and seat belt use.
• Environmental variables: Variables used to describe environmental and/or roadway conditions consistent with General Estimates System and other crash databases. These include roadway surface condition, traffic flow, number of travel lanes, traffic density, traffic control device at event onset, relation to junction of vehicle at event onset, roadway alignment (e.g., curve and grade), locality type (e.g., residential and interstate), ambient lighting, weather, and windshield wiper status.
4.3.1. Coder Training and Quality Control Policies
A suggested data coding quality assurance/quality control (QA/QC) workflow that has been developed, tested, and implemented by the Virginia Tech Transportation Institute (VTTI) is provided here. This workflow has four phases, all of which are equally critical to the quality of manual coding data. These phases are protocol development, coder training, data coding, and post-coding, with tasks assigned as each level of one of four roles. Each role and phase is discussed here and also illustrated in Figure 6.3.
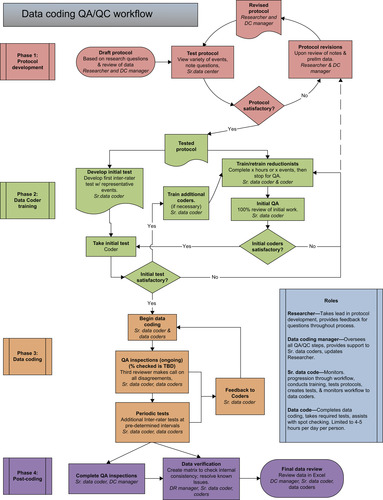
The following four roles are critical to the data reduction process:
1. The researcher or research manager (either internal or external) oversees the research project from research design to data collection, coding, analysis, and reporting. At the data coding step, the researcher takes the lead in protocol and data dictionary development and provides input and feedback throughout all four phases.
2. The data coding manager serves as the direct liaison between the researcher and the data coding team and oversees all QA/QC steps. Most questions from coders can be fielded by the data coding manager; those that cannot are taken to the researcher.
3. Senior data coders (or lab proctors) are generally experienced, high-quality data coders who monitor a project’s progression through the QA/QC workflow, assist the data coder manager with coder training, test new protocols before coding work begins, create and score tests to formally measure coder reliability, and monitor the workflow to coders.
4. Data coders, of course, perform the bulk of the data coding. They also participate in the QA/QC process by completing required tests and assisting with spot checks. Data coders are ideally limited to working no more than 4 or 5h per day.
4.3.1.1. Phase 1: Protocol Development
QA/QC of manual data coding actually begins before coders ever see a protocol. After the researcher has drafted a preliminary protocol and data dictionary based on the research questions, it usually goes through several rounds of review with the data coder manager. Due to the reduction-intensive and exclusive nature of the data coder manager’s work, this person often has more experience in finding potential ambiguities, knowing when categories may be missing from certain variables, and adapting new protocols to be consistent (if possible) with previous protocols for later cross-analysis. After both the researcher and the data coder manager are satisfied with the draft protocol, it enters the first loop to be tested. The senior coder takes the lead in this testing by viewing a variety of events and completing the coding for those events based on the draft protocol. As the senior coder works, he or she takes notes about where uncertainties arose, what types of events were difficult to categorize, other variables that may seem important to the coding, and areas where the written protocol may need to be elaborated further. These comments are then reviewed by the data coder manager and the researcher.
Discussions at this point should address how well the protocol performed in answering the research question, whether the data have been coded as intended, and whether this coding provides the information required. If changes are significant, a second round of testing is recommended. Once the protocol is satisfactory, it enters the second phase, coder training. However, when the protocol leaves this stage, there may still be changes made to it later in the process. Depending on the complexity of the protocol (and the time required to reduce each event), phase 1 may require from 1 or 2 days to 1 week or more to complete.
As with any research, unexpected scenarios, driver behaviors, or environmental conditions often arise during data coding and/or protocol development, and this sometimes results in a need to edit, append, or further clarify the working data dictionary. For instance, if a road type, secondary task, or conflict type is observed in the video that does not clearly fit into the categories provided by the dictionary, then the data reduction manager, in conjunction with the researchers, must decide and thoroughly document how to code that scenario for immediate and future reference. When this occurs, it is imperative that a formal process for updating the data dictionary and/or data reduction manual be followed:
1. Assess the situation. Can the situation be described adequately by existing operational definitions given the research questions? (If no, continue to step 2.)
2. Consider the frequency. How frequently will this situation arise? How critical is this situation to the outcome of the event? Does it warrant a new category and definition, or can existing operational definitions be modified to include this new situation without compromising the research question?
3. Modify the dictionary. If existing definitions do not adequately describe the scenario, and the scenario is deemed to be a critical aspect of the event, then a new option and operational definition must be added to the variable(s) used to describe those aspects of the event. If the research question does not require a unique description for the scenario, then, at minimum, the data dictionary needs to be modified so that an existing operational definition comprises the scenario in question.
4. Publish and distribute the updates. Whenever the data dictionary is modified, all reductionists and researchers working with that data set must be notified of the update as soon as possible. The most up-to-date data dictionary should be used at all times, and reductionists need to know that they are working with the most current definitions. Active notifications and reductionist compliance is strongly recommended. VTTI requires all reductionists to read and sign update documents after an opportunity to ask questions and clarify any uncertainties.
4.3.1.2. Phase 2: Coder Training
The tested and revised protocol enters the coder training phase. On the right side of the phase 2 loop, the senior data coder and the data coding manager work together to train the first cohort of data coders, ideally no more than three or four trainees at a time to keep the initial quality control manageable. The protocol is reviewed in detail with the coders, and both paper and electronic copies are made available for reference. After the formal training session has been completed, coders begin coding under the supervision of a senior coder. This initial coding should be short term (no more than one full reduction shift) and then stopped for an accuracy assessment. Ideally, 100% of each coder’s work will be reviewed by a senior coder or data coder manager. Corrections are made, and detailed feedback is provided to coders to review. These comments are reviewed with the coders, and coders are retrained if necessary.
If coders are able to meet reliability standards in this initial review (e.g., 90% accuracy, although this level may vary with the complexity and level of subjectivity present in the reduction), then a random sample (e.g., 10–20%) of all remaining work should be checked (see phase 3).
If the initial review was unsatisfactory, then another day of work is completed after retraining, and the 100% review is repeated. At this point, there may be times when all trainees are struggling with a certain aspect or variable in the coding. This is usually a sign that either more in-depth training on that variable needs to be conducted or the protocol needs to be modified or clarified to increase reliability.
On the left side of the phase 2 loop, the senior coder develops the first inter-rater test by selecting a sample of events that represents the range and frequency of conditions expected to be present in the data set. Depending on the complexity and length of the protocol, the test may include 10–30 events. After meeting the initial reliability standards during the 100% review, coders should then take this test. By having all coders complete the same set of events, the ability to consistently code variables within the group can be measured. If scores on this test are satisfactory (e.g., 90% or greater), then coders may move to phase 3. If scores are unsatisfactory, retraining or additional protocol revisions may be necessary.
Finally, once the first cohort of three or four coders completes the training loop and moves to phase 3, additional coders can enter the training loop in similar groups of three or four each. Depending on the complexity of the protocol and the experience of the coders, the training period may require approximately 2–5 days.
4.3.1.3. Phase 3: Data Coding
Three tools for ongoing quality control are used during the data coding phase: spot checks, inter-rater tests, and intra-rater tests.
A “spot check” is simply a second-person review of data coding work in which corrections can be made and comments provided to the original coder to confirm and/or improve accuracy. Spot checks are a very useful tool for assessing coders’ understanding of protocols for a variety of potential circumstances, revealing potential ambiguities that may need to be addressed in the protocol or data dictionary, and monitoring of overall data quality. Spot checks can be performed by the data coding manager, senior data coder, or experienced data coders (usually a combination of all three). However, discrepancies between the original reduction and the spot check should generally be reviewed by a manager (data coding manager or senior coder) as a third reviewer before changes are made. Feedback on all spot checks should be provided to the original coder immediately, and coders then should review all comments and be encouraged to revisit the events and ask questions so that mistakes can be avoided in the future. If consistent or increasing errors are found during later spot checks, a larger sample of coding work for that individual (or a time-specific or variable-specific complete sample if the error type is consistent and easily contained) should be checked and corrected until the issue is resolved.
Spot checks should begin very soon after entering phase 3. Generally, each person involved in spot checking will spend a certain amount of time each day/week performing spot checks (e.g., 1h per day or more if necessary to complete the desired sample) and the rest of his or her time completing additional coding. Spot checks should be performed either blindly so that the reviewer does not know who completed the original coding (in which case the reviewer may also review his or her own work) or openly so that each original coder can receive individualized feedback and errors can be easily contained and systematically corrected (in which case the reviewer should only review the work of others).
Inter-rater and intra-rater tests are used periodically during a coding project to ensure consistency both between coders at a given point in time (inter-rater) and within individual coders over time (intra-rater). Depending on the duration and complexity of the coding, these may be conducted once a week, once a month, or once every couple of months. Similar to the initial inter-rater test conducted in phase 2, this test is developed by the senior coder to include a sample of events that represents the range and frequency of conditions present in the data set for a total of 10–30 events. For the inter-rater test, these should be different events than those that were included in the original test, with the goal of similar responses from all coders. The intra-rater test can be conducted simultaneously if some of the events from the first test are duplicated in each periodic test; the goal in this test is for each coder to record these events in the same way he or she coded them during the first test. If scores on this test are unsatisfactory, some retraining may be necessary. Spot checks and periodic inter- and intra-rater tests should be continued until all events have been coded. Phase 4 begins at this point.
4.3.1.4. Phase 4: Data Delivery
In phase 4, the data coding team works to prepare the data set for delivery back to the researcher so that statistical analysis can begin. First, any remaining spot checks are completed, and any remaining discrepancies between original coder and reviewer are resolved. Then, based on the spot check review and pragmatic review of the protocol, all known errors or potential inconsistencies are reviewed. This is the data verification step. Examples of these issues include a known confusion between the coding of a particular location as interstate or open country in the Locality variable or a potential inconsistency between two variables that should be internally consistent or coded similarly (e.g., if the subject is using a cell phone during an event, it should be marked as “cell phone” in the Distractions variable and “distracted or inattentive” in the Driver Behavior variable). With all of the QC measures taken during the first three phases, this step should be minimal, but it is still critical. The data coding manager and senior coders should identify these issues and then work with the coders to resolve them. Data verification should be completed until the data are internally consistent with the data dictionary. As a final review before data delivery, pulling all the data out into a spreadsheet and checking the relationship between events and variables is a good QA step. Any questionable events should be flagged for a final review. These events may be ones that are coded with either unexpected or rarely used categories that the data coding manger would like verified, or they may be clear random errors such as a subject ID recorded that was never in that vehicle. The amount of time required for data verification depends on the complexity of the protocol (as with phases 1 and 2), in addition to the number of events included in the coding protocol and how consistently the QA/QC workflow was followed during the first three phases. Thus, data verification can take from 1 or 2 days to several weeks.
4.4. Data Analysis
Naturalistic driving studies have some characteristics that are similar to traditional empirical driving research, in which a driver’s precise position, speed, acceleration, etc. are known at every moment in time. Naturalistic driving studies also have some characteristics that are identical to traditional epidemiological research, in which the data set includes millions of vehicle miles traveled, thousands of events, and tens or hundreds of participants with no experimental control (i.e., did not control when or what type of traffic conditions drivers experienced at any given moment in time). These qualities or characteristics of naturalistic driving studies present a unique data analysis environment for transportation researchers to explore and understand different aspects of driver behavior never before examined.
The driver behavior in the seconds leading up to a crash or near-crash includes the precise vehicle kinematic data but can also include observed driver behavior such as dialing a cell phone or drowsiness. The appropriate data analysis technique may be very different, depending on the research question and the type of data used. The following sections highlight a variety of different analytic techniques that have been used to answer a variety of research questions. However, this discussion is not meant to be exhaustive but, rather, to whet the appetite of the safety researcher who is planning to use naturalistic driving data to answer a specific research question.
4.4.1. Assessing Crash Risk
Relative risk or crash risk refers to the amount of risk a driver assumes (above the normal level of risk of driving/riding in a motor vehicle) when he or she engages in a particular behavior. Crash risk is typically calculated using an odds ratio. The odds is a commonly used measure of the likelihood of an event occurrence. The odds measures the frequency of event occurrence (i.e., the presence of inattention type) to the frequency of event non-occurrence (i.e., the absence of inattention type). That is, the odds of an event occurrence is defined as the probability of event occurrence divided by the probability of non-occurrence.
The ratio of the odds is a commonly employed measure of association between the presence of cases (crash and near-crash events) and the controls (baseline driving epochs). Odds ratios are used as an approximation of relative crash risk in case–control designs. This approximation is necessary due to the separate sampling employed for the events and baselines and is valid for evaluations of rare events (Greenberg, Daniels, Flanders, Eley, & Boring, 2001). The odds ratio would be defined as
(3.1)
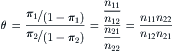
Algebraically, this equation can be rewritten with crude odds ratios calculated as shown in Eq. (3.2):
(3.2)

To interpret an odds ratio, a value of 1.0 indicates no significant danger above normal driving. An odds ratio less than 1.0 indicates that an activity is safer than normal driving or creates a protective effect. An odds ratio greater than 1.0 indicates that an activity increases one’s relative risk by the value of the odds ratio. For example, if reading while driving obtained an odds ratio of 3.0, then this indicates that a driver is three times more likely (or 300% more likely) to be involved in a crash or near-crash while reading and driving than if just driving the vehicle.
Results from our previous naturalistic studies suggested that tasks that take the driver’s eyes off the forward roadway, such as reaching for a moving object, applying makeup, dialing a cell phone, text messaging on a cell phone, and reading, significantly increase crash risk (Hickman et al., 2010 and Klauer et al., 2006). Those activities that did not take the driver’s eyes off the forward roadway for extended periods of time showed no increase in crash risk. These activities included talking to passengers (for adult drivers), adjusting radio/HVAC, talking on a CB, talking on a cell phone, and drinking.
4.4.2. Prevalence or Driving Exposure
Naturalistic driving studies can provide precise driving exposure information for the sample of drivers involved in the study. Although crash risk is an important assessment, it must be weighed in comparison to the prevalence in which drivers engage in the “risky” behavior. For example, dialing a cell phone is considered high risk; however, the time required to complete this task is relatively short compared to that for text messaging. Thus, safety professionals who observe the increased frequency of text messaging while driving combined with the observed increased crash risk find that this behavior is quite worrisome compared to eating or drinking while driving.
In the field of transportation safety, exposure measures are typically limited to drivers’ self-reported vehicle miles traveled, the number of licensed motorists, or highway vehicle counts for a specific location. Although naturalistic driving studies typically recruit fewer participants than do survey- or questionnaire-based studies, the exposure information is much more precise than self-report. This precision encompasses exposure to specific risk factors (i.e., driving at night) that can be more precisely measured using naturalistic driving data than in a self-report or highway vehicle count.
One of the key findings of the original Dingus et al. (2006) 100-Car Naturalistic Driving Study was the much higher frequency of crashes compared to police-reported crashes, from which most of the traffic safety analyses were previously conducted. Drivers were involved in crashes with their vehicles four times more frequently than they reported to police. This is a rich source of data and rich source of exposure that was completely unavailable prior to the 100-Car Study.
4.4.3. Contributing Factors for Crashes and Near-Crashes
The Indiana Tri-Level Study (Treat, 1980) and the Large Truck Crash Causation Study (Starnes, 2006) both reviewed hundreds of police accident reports as well as a sample of on-site crash investigation reports to provide a comprehensive list of all the causal factors present in actual crashes. These studies were conducted post hoc on actual police-reported crashes. A great deal was learned from these studies; however, these types of analyses can also be conducted using naturalistic driving studies to obtain additional knowledge and insight.
The data coding for naturalistic driving studies can be easily developed to produce a list of potential causal factors. The video provides greater precision concerning the driver behaviors in the seconds leading up to crashes as well as the environmental, surrounding traffic, and general roadway conditions. Several analyses have been conducted using 100-Car Study data for this purpose (Dingus et al., 2006). One example of a tree diagram shows the breadth of causal factors for a conflict with a lead vehicle (Figure 6.4).
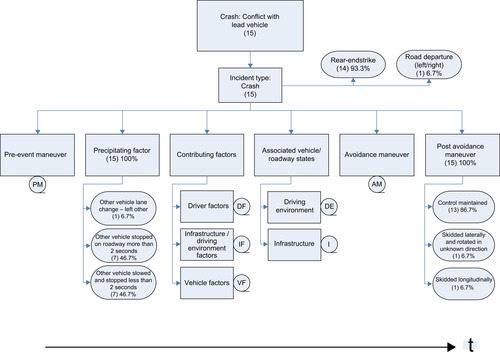 |
| FIGURE 6.4 |
Results from the 100-Car Study indicate that there are typically multiple causal factors for crashes and near-crashes and only one or perhaps two causal factors for most critical incidents. Comparisons have also been performed between crashes and near-crashes that indicate that the most dramatic difference between crashes and near-crashes does not reside in the type of causal factors. Rather, it is whether an evasive maneuver was initiated or not, where no evasive maneuver is initiated for crashes and an abrupt evasive maneuver is initiated for near-crashes. These results support the use of near-crashes as a safety surrogate (Guo, Klauer, Hankey, & Dingus, 2010).
4.4.4. Advanced Product Testing
Due to the nature of drivers being studied/observed in their normal environment, the naturalistic driving study presents a unique opportunity for both auto manufacturers and nomadic device manufacturers to study product use. Specifically, naturalistic driving studies provide manufacturers with an in-depth view of how drivers actually use and interact with their products under normal, daily driving scenarios. Although the recruitment for these types of studies may originate with the original equipment manufacturers providing a list of potential participants who own the desired system, the data can be very valuable for future system design and also for an understanding of the potential unintended consequences or driver misuse of specific devices.
Naturalistic driving studies can be designed to assess various products, but post hoc analyses can also be performed using data already collected. For example, McLaughlin, Hankey, Dingus, and Klauer (2009) performed a study that examined different forward collision warning device algorithms using Dingus et al.’s (2006) 100-Car data. Different algorithms were compared to actual driving data to assess the number of potential crashes and near-crashes that may have been avoided if drivers had been given an alert that they were about to collide with an obstacle.
Many naturalistic driving studies have been conducted to assess the feasibility of various safety warning devices. These studies are typically referred to as field operational tests or (FOTs). Some of the more recent FOTs that have been performed in the United States include the Run Departure Crash Warning System FOT (LeBlanc et al., 2006), the Drowsy Driver Warning System FOT (Blanco et al., 2009), and the Integrated, Vehicle-Based Safety System Heavy-Truck Field Operational Test (Sayer et al., 2010), which evaluated combined warning system alerts to drivers.
5. Conclusions
Naturalistic driving data provide powerful tools for safety researchers that incorporate some characteristics of epidemiological data analysis techniques with empirical data analysis techniques. Although these characteristics are very beneficial, they also provide novel new data and analytic methods in which to explore and study driver safety, specifically driver behavior.
The life cycle of naturalistic driving studies includes the following:
1. Study design and data collection
2. Data preparation and storage
3. Data coding
4. Data analysis
Naturalistic driving studies are typically lengthy and resource-intensive but worth the rich, detailed data that can be collected. These types of studies are complex and require extensive planning both prior to data collection and through the entire life cycle of the study to ensure that the initial research objectives are appropriately evaluated. Detailed planning at every step in the life cycle will result in a much easier and efficient data analysis phase of the project. Inefficient and/or minimal planning can easily result in a failed project that cannot evaluate the original research objectives.
Results from previous naturalistic driving studies have quantified the inherent dangers in driving drowsy and driving while engaging in text messaging, cell phone dialing, applying makeup, and any other task that requires more than 2 s total time of eyes off the forward roadway. Future studies may provide answers to even more complex issues regarding driver age, geographic location, and vehicle type. The Strategic Highway Research Program 2 (SHRP) Naturalistic Driving Study will be a national resource for traffic safety professionals, with preliminary data sets available as early as 2012.
Naturalistic driving study databases from past and future studies will be available to the safety research community. For example, Dingus et al.’s (2006) 100-Car Naturalistic Driving Study data are already available online at http://www.vtti.vt.edu. Given this accessibility, this chapter focused primarily on the data reduction and analysis of naturalistic data because these steps will be critical to researchers who want to use these data sets for safety research. Although the data reduction and analysis task is critical, researchers also need to have a clear understanding of how the DAS worked and the limitations of the data collection system. All phases of the naturalistic data study life cycle are important to understand in order to effectively and accurately analyze the data.
The SHRP 2 Naturalistic Driving Data, as well as the European and Canadian naturalistic driving studies that are being planned, will provide extensive driver behavior databases. The power of naturalistic driving studies and the more in-depth analyses of driver behavior is an important step toward achieving greater reductions in driver injuries and fatalities on our roadways. The safety research community must become adept and develop improved analytic techniques to use with naturalistic driving data. With this additional tool in the safety researcher tool box, there is hope of making great strides toward zero deaths on our roadways.
References
Blanco, M.; Bocanegra, J.L.; Morgan, J.F.; Fitch, G.M.; Medina, A.; Olson, R.L.; Hanowski, R.J.; Daily, B.; Zimmerman, R.P., Assessment of a drowsy driver warning system for heavy-vehicle drivers: Final report. (Report No: DOT 811 117) (2009) National Highway Traffic Administration, Washington, DC.
Dingus, T.A.; Klauer, S.G.; Neale, V.L.; Petersen, A.; Lee, S.E.; Sudweeks, J.; Perez, M.A.; Hankey, J.; Ramsey, D.; Gupta, S.; Bucher, C.; Doerzaph, Z.R.; Jermeland, J.; Knipling, R.R., The 100-Car Naturalistic Driving Study: Phase II—Results of the 100-Car Field Experiment. (Interim Project Report for DTNH22-00-C-07007, Task Order 6; Report No. DOT HS 810 593) (2006) National Highway Traffic Safety Administration, Washington, DC.
Dingus, T.A.; Neale, V.L.; Garness, S.A.; Hanowski, R.J.; Kiesler, A.S.; Lee, S.E.; Perez, M.A.; Robinson, G.S.; Belz, S.M.; Casali, J.G.; Pace-Schott, E.F.; Stickgold, R.A.; Hobson, J.A., Impact of sleeper berth usage on driver fatigue. (Technical Contract Report No. DTFH61-96-00068) (2001) Federal Motor Carrier Safety Administration, Washington, DC.
Greenberg, R.S.; Daniels, S.R.; Flanders, W.D.; Eley, J.W.; Boring, J.R., Medical epidemiology. 3rd ed. (2001) McGraw-Hill, New York.
Guo, F.; Klauer, S.G.; Hankey, J.M.; Dingus, T.A., Near-crashes as crash surrogate for naturalistic driving studies, Transportation Research Record: Journal of the Transportation Research Board 2147 (2010) 66–74.
Hanowski, R.L.; Wierwille, W.W.; Garness, S.A.; Dingus, T.A., Impact of local/short haul operations on driver fatigue. (Technical Contract Report No. DTFH61-96-C-00105) (2000) Federal Motor Carrier Safety Administration, Washington, DC.
Heinrich, H.W.; Petersen, D.; Roos, N., Industrial accident prevention. (1980) McGraw-Hill, New York.
Hickman, J.S.; Hanowski, R.J.; Bocanegra, J., Distraction in commercial trucks and buses: Assessing prevalence and risk in conjunction with crashes and near-crashes. (Technical Contract Report No. FMCSA-RRR-10-049) (2010) Federal Motor Carriers Safety Administration, Washington, DC.
Klauer, S.G.; Dingus, T.A.; Neale, V.L.; Sudweeks, J.D.; Ramsey, D.J., The impact on driver inattention on near crash/crash risk: An analysis using the 100 Car Naturalistic Driving Study data. (Report No. DOT HS 810 594) (2006) National Highway Traffic Safety Administration, Washington, DC.
LeBlanc, D.; Sayer, J.; Winkler, C.; Ervin, R.; Bogard, S.; Devonshire, J.; Hagen, M.; Bareket, Z.; Goodsel, R.; Gordon, R., Road departure crash warning system field operational test methodology and results. (Report No. UMTRI-2006-9-1, Contract No. DTFH61-01-X-0053) (2006) National Highway Traffic Safety Administration, Washington, DC.
Lum, H.; Reagan, J.A., Interactive highway safety design model: Accident predictive module, Public Roads Magazine 55 (2) (1995).
McLaughlin, S.B.; Hankey, J.M.; Dingus, T.A.; Klauer, S.G., Development of an FCW algorithm evaluation methodology with evaluation of three alert algorithms: 100-Car follow-on subtask 5. (2009) National Highway Traffic Safety Administration, Washington, DC.
Mollenhauer, M., Proactive driving safety evaluation: An evaluation of an automated traveler information system and investigation of hazard analysis data. (1998) Unpublished doctoral dissertation, University of Iowa, Iowa City.
Parker, M.R.; Zegeer, C.V., Traffic conflict techniques for safety and operations: Observers manual. (Technical Contract Report No. FHWA-IP-88-027) (1989) Federal Highway Administration, Washington, DC.
Sayer, J.R.; Bogard, S.E.; Funkhouser, D.; LeBlanc, D.J.; Bao, S.; Blankespoor, A.D.; Buonorosa, M.L.; Winkler, C.B., Integrated vehicle-based safety systems: Heavy-truck field operational test key findings report. (Report No: DOT HS 811 362) (2010) National Highway Traffic Safety Administration, Washington, DC.
Starnes, M., Large-truck crash causation study: An initial overview. (Report No: DOT HS 810 646) (2006) National Highway Traffic Safety Administration, Washington, DC.
Treat, J.D., A study of precrash factors involved in traffic accidents, HSRI Research Review 10 (6) (1980) 2–35.
Wierwille, W.W.; Hanowski, R.J.; Hankey, J.M.; Kieliszewski, C.A.; Lee, S.C.; Medina, A.; Keisler, A.S.; Dingus, T.A., Identification of driver errors: Overview and recommendations. (Technical Contract Report No. FHWA-RD-02-003) (2002) Federal Highway Administration, Washington, DC.