Chapter 33. Public Policy
Rune Elvik
Institute of Transport Economics, Oslo, Norway
This chapter reviews the contribution that traffic psychology can make to public policy designed to improve road safety. The stages of policy development in which traffic psychology can contribute are identified. The most important contributions of traffic psychology to public policy include (1) identifying road user behavior that contributes to accidents and developing ways to influence such behavior; (2) promoting the use of an experimental study design when evaluating the effects of road safety measures; (3) helping develop designs of vehicles, roads, and traffic control devices that are adapted to human capabilities; (4) predicting if behavioral adaptation to new safety measures is likely to occur or not; and (5) acting to correct a tendency toward wishful thinking that may develop among policy makers who may base policy on an overly idealistic approach to how road safety can be improved. Examples are given of all these types of contributions of traffic psychology.
Public policy refers to any action taken by public bodies in order to influence highway safety. Although transport policy in general has several objectives, the focus in this chapter is on policy designed to improve safety. The role of traffic psychology in contributing to an effective road safety policy is discussed. The following main questions are addressed in this chapter:
1. What are the principal elements of road safety policy? At what stages of policy making can traffic psychology contribute?
2. What is the scope for improving road safety by applying knowledge gained in traffic psychology and related disciplines?
1. An Analytic Model of Policy Making
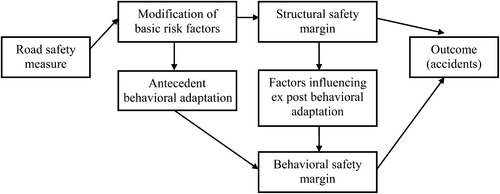
Figure 33.1 shows an analytic model of highway safety policy making (Elvik & Veisten, 2005). The model is not intended as a description of actual policy making. It is a purely analytical model intended as a logical framework for identifying the types of reasoning and activities that constitute policy making. The stages identified by the model form a logical sequence; they should not be interpreted as a chronological ordering.

The first stage of policy development is to find out what the problem is and identify factors that contribute to it. In short, what are the most important highway safety problems and what are the most important factors contributing to these problems? The next stage is to develop targets for improving safety and decide on whether these targets should be quantified or not. Once the ambitions for improving safety have been defined, a broad survey of potentially effective safety measures (stage 3) is needed to identify those measures that can make the largest contribution to reducing the number of fatalities and injuries. However, for various reasons, it may not be possible to introduce all effective safety measures; an explicit consideration of constraints on safety policy can help in developing realistic policy options (stage 4). There will very often be more than one safety measure that can address a given safety problem; hence, developing alternative policy options that can be compared is instructive (stage 5).
A key activity in policy development is to estimate the expected effects of safety measures on the number of accidents or the number of killed or injured road users (stage 6). These estimates should ideally be based on the best available knowledge regarding the effects on safety of various measures. Any prediction (i.e., prior estimate) of the safety effects of a program will be uncertain, and it may be useful to explicitly consider sources of uncertainty and how to reduce uncertainty (stage 7). As already mentioned, policy is always made within constraints that are not necessarily chosen or wanted by policy makers; usually, therefore, several considerations are relevant for policy choice, requiring complex trade-offs (stage 8). Once it has been decided to implement a set of safety measures, the effects of these measures should be evaluated in order to increase knowledge of their effects for use in future policy making (stage 9).
Traffic psychology is not equally relevant at all stages of policy making. It can contribute in particular at stages 1–3, 6, and 9. A brief review of the potential contribution of traffic psychology to policy making follows.
2. Outline of the Potential Contribution of Traffic Psychology to Policy Making
2.1. Unsafe Road User Behavior as a Road Safety Problem (Stage 1 of Policy Making)
Road accidents are influenced by many factors. One of the most important is unsafe road user behavior. This includes speeding, drinking and driving, not wearing protective devices, talking on cell phones while driving, and a host of other forms of behavior. No study has assessed the contribution of all types of unsafe road user behavior to accidents or injuries. However, Elvik (2010a) tried to assess the risk attributable to 15 different violations of road traffic law in Norway. Table 33.1 reproduces the estimates of the risk attributable to these violations. These estimates are highly uncertain, but it is not possible to estimate statistically the uncertainty of each of the estimates. Confidence intervals are therefore not provided.
| Source: Data from Elvik (2010a). | ||
| Violation | Estimate of attributable risk (proportion) with respect to fatalities and injured road users: Sorted by contribution to fatalities | |
|---|---|---|
| Fatalities | Injured road users | |
| Speeding | 0.230 | 0.094 |
| Drinking and driving | 0.166 | 0.034 |
| Not wearing seat belts | 0.133 | 0.032 |
| Health problems in drivers | 0.093 | 0.080 |
| Use of illicit drugs and driving | 0.072 | 0.027 |
| Service and resting hours | 0.050 | 0.022 |
| Not yielding at intersections | 0.038 | 0.038 |
| Not yielding to pedestrians | 0.026 | 0.025 |
| Use of cell phone | 0.024 | 0.024 |
| Red light running | 0.019 | 0.019 |
| Illegal overtaking | 0.010 | 0.003 |
| Engine tuning of motorcycles | 0.006 | 0.007 |
| Short following distance | 0.002 | 0.012 |
| Lack of child restraints in cars | 0.002 | 0.001 |
| Non-use of daytime running lights | 0.002 | 0.002 |
Attributable risk shows the potential reduction of the number of fatalities or injured road users if the violation is eliminated—that is, replaced by driving that complies with the law. It is estimated as follows (Rothman & Greenland, 1998):
(1)

It does not make sense to add the estimates of attributable risk presented in Table 33.1. To estimate the potential for improving safety by eliminating all the violations, one can apply what has been termed the “method of common residuals” (Elvik, 2009a). The residual of an estimate of attributable risk is its complementary value—that is, the share of fatalities or injured road users not eliminated by eliminating the risk factor. Thus, for speeding, the residual with respect to fatalities is 1−0.230=0.770. By applying the method of common residuals, it can be estimated that by eliminating the violations listed in Table 33.1, the number of fatalities can be reduced by 61% and the number of injured road users reduced by 35%. For fatalities, the estimate is


1. Identifying and describing the prevalence of various forms of potentially unsafe road user behavior. Progress in unobtrusive techniques of observation, as illustrated by a large-scale, in-vehicle naturalistic study (i.e., N=100 cars; Klauer, Dingus, Neale, Sudweeks, & Ramsey, 2006), makes it possible to survey behavior that used to be difficult to observe.
2. Estimating the risk associated with unsafe road user behavior, thus providing knowledge about factors contributing to accidents and the size of their contributions.
3. Studying why unsafe road user behavior is widespread: What are the motivations underlying this behavior? Can unsafe behavior be reasonably modeled as (subjectively) rational from the road users’ point of view? If road users behave unsafely for reasons they think are good, does this imply that efforts designed to modify behavior will be ineffective?
4. To what extent can unsafe road user behavior be influenced by means of technical solutions that make such behavior impossible or unpleasant?
2.2. Developing Targets That Are Motivating (Stage 2)
Many countries have developed national safety programs that are based on a quantified target for improving road safety (Organisation for Economic Co-operation and Development (OECD), 2008). International bodies, such as the OECD, recommend setting quantified targets for improving safety. However, setting targets that will motivate both public bodies and others that influence highway safety to make an extra effort involves a number of complexities (Elvik, 2008):
2. The targets set should be challenging but in principle achievable—they should have the “right” level of ambition.
3. There should not be too many targets in view of the available policy instruments designed to realize them.
4. There should be mechanisms ensuring that responsible agencies have sufficient resources at their disposal to implement all safety measures that are needed to realize the targets.
5. There should be a system for monitoring progress in realizing targets and providing feedback to responsible agencies on their performance.
6. Incentives should exist to ensure commitment to targets from all agencies responsible for realizing them.
To set ambitious but challenging targets, it helps to know what is the potential for improving safety by introducing various safety measures. A so-called “bottom-up” approach for setting targets derives a “realistic” target by adding up the estimated effects on safety of a number of safety measures that can be implemented. A “top-down” approach, on the other hand, approaches target setting from a more idealistic point of view. In practice, good targets involve a mixture of idealism and realism.
2.3. Surveying Potentially Effective Highway Safety Measures (Stage 3)
Many measures may contribute to improving road safety. A comprehensive overview of such measures can be found in The Handbook of Road Safety Measures (Elvik, Høye, Vaa, & Sørensen, 2009), which describes a total of 128 measures addressing the following elements of the transport system:
1. Highway design (20 measures)
2. Highway maintenance (9 measures)
3. Traffic control (22 measures)
4. Vehicle design, safety standards, and protective devices (29 measures)
5. Vehicle inspection (4 measures)
6. Driver training and regulation of professional driving (12 measures)
7. Public education and information (3 measures)
8. Police enforcement and sanctions (13 measures)
9. Post accident care (3 measures)
10. General-purpose policy instruments (13 measures)
2.4. Estimating the Expected Effects of Safety Measures (Stage 6)
The Handbook of Road Safety Measures (Elvik et al., 2009) contains a wealth of information regarding the effects of road safety measures. However, a mechanical and uncritical use of the book is not recommended when developing road safety policy and estimating the effects of road safety measures. There are three main problems:
1. The Handbook of Road Safety Measures often states only an average effect of a measure, although the effect can reasonably be assumed to vary systematically, depending, for example, on characteristics of the measure.
2. The quality of studies that have evaluated the effects of a measure may vary, and a summary estimate of effect should be based on the best studies.
3. Not all measures have been evaluated with respect to their effect on accidents; in particular, this effect will be unknown, but has to be predicted, for new measures.
The effects of well-established road safety measures on accidents reflect the net impacts of all causal pathways generating these impacts. In particular, road user behavioral adaptation will be endogenous with respect to effects on accidents; the effects on accidents always capture the effects of any road user behavioral adaptation. In other words, there is no need to “adjust for” behavioral adaptation when predicting the effects of measures whose effects on accidents have been extensively evaluated. The fact that road users adapt behavior is nevertheless not unproblematic because it normally reduces, and may even eliminate, the intended safety effect of a measure.
This is different in the case of new road safety measures. To predict their effects on accidents, it is necessary to predict whether behavioral adaptation is likely to occur. A framework for analyzing and predicting the effects of road safety measures has been proposed by Elvik (2004) and is shown in Figure 33.2.
 |
| FIGURE 33.2 Source: Based on Elvik (2004). |
A road safety measure will influence safety by modifying one or more basic risk factors that are associated with accidents. These risk factors include speed, mass, road surface friction, visibility, compatibility (differences in mass and crashworthiness between vehicles), complexity (the richness of information in a traffic environment), predictability (the accuracy of expectations), road user rationality, road user vulnerability, and system forgiveness (the safety margins built into the system). Changes in these risk factors influence the structural safety margin—that is, the safety margin built into roads and vehicles. These changes are sometimes referred to as the “engineering effect” of a road safety measure (Evans, 1985). The effect of a road safety measure on accidents, however, is also determined by the behavioral adaptation it may elicit.
Behavioral adaptation is sometimes in response to the risk factors a road safety measure is intended to influence, but it takes place before the measure is introduced. In Figure 33.2, this kind of behavioral adaptation is referred to as antecedent behavioral adaptation. As an example, drivers may adapt behavior to the technical condition of their cars. Technical defects may therefore not increase the risk of accident; once these defects are repaired following periodic motor vehicle inspection, drivers adapt behavior again, knowing that the car is in good technical condition. The net result could be that periodic motor vehicle inspection has no effect on accidents. Behavioral adaptation will sometimes also be the result of a safety measure, particularly if the measure is easily noticed, is associated with a large engineering effect, and road users can obtain an advantage by changing behavior (Amundsen and Bjørnskau, 2003 and Bjørnskau, 1994).
Will new safety measures, such as intelligent speed adaptation (ISA), intelligent cruise control, lane departure warning, or fatigue monitoring, lead to behavioral adaptation? ISA is a system that supports the driver in complying with speed limits. There are several versions of the system; one of them makes exceeding the speed limit impossible by regulating fuel supply to prevent acceleration to a speed higher than the speed limit. Because speeding is known to be an important risk factor for accidents and injuries (Elvik, 2009b), ISA would seem to be a potentially effective road safety measure. However, will drivers adapt their behavior to ISA? One common form of behavioral adaptation, increasing speed, is blocked by the system. Drivers could, however, adapt by becoming less alert. Some maneuvers, such as overtaking, might require more time and thus become more risky. Speed is such a powerful risk factor that it is difficult to believe that behavioral adaptation would entirely eliminate the effects of ISA, but it could reduce them.
Intelligent cruise control is also a system that exists in many versions. The most technically advanced will warn the driver if headway becomes too small and activate the brakes if the driver fails to react. Despite the huge number of rear-end collisions, maintaining a safe distance from vehicles ahead is generally a task drivers perform very well. The reliability of drivers in braking and stopping safely in car-following situations is probably well in excess of 999 in 1000. The challenge for intelligent cruise control is to design a system that is more reliable than the average driver. Whereas drivers can take account of factors such as a slippery road surface, going downhill, and the possibility of avoiding a collision by steering to the right or left, a technical system may not be able to adequately handle these complexities. If drivers come to rely fully on intelligent cruise control to perform a task currently done manually, there is a significant risk that the system will not improve safety.
Lane departure warning devices present similar limitations. A lane departure warning system is basically unable to determine if a lane departure is intentional or not. If intentional, it may not necessarily involve any additional risk. The driver may change lanes on a freeway, having checked carefully that it can be done safely, but forget to use the indicator. The warning system may then be activated, possibly irritating the driver. Another problem is that a lane departure warning system may not function if lane markings or edgelines are covered by snow or are worn out. In short, the system may be unreliable and may activate warnings the driver perceives as false alarms. There is a risk that drivers may ignore the system, thus diminishing its potential effects on safety.
Concerning fatigue monitoring systems, the major issue is still whether a reliable system can be developed. If a technically reliable system is developed, there is clearly a risk that drivers may utilize the system to drive when they are fatigued, trusting the system to wake them up in time. In short, an important task for traffic psychology is to try to predict if, and the extent to which, new road safety measures will be associated with behavioral adaptations that may reduce or completely offset the intended effects of these measures on safety.
2.5. Evaluating the Effects of Road Safety Measures (Stage 9)
To continue to improve highway safety, it is important to evaluate the effects of as many safety measures as possible. With its long tradition of experimental research, traffic psychology can make a key contribution to evaluation by helping to design experimental evaluation studies. There are few such studies (Elvik, 1998), but if the huge advantages of randomized, controlled trials were more widely recognized, road safety evaluation could become a more rigorous discipline, relying less on imperfectly controlled observational studies than it does today. Psychologists should regard it as one of their professional duties to advocate the use of randomized, controlled trials whenever they see a possibility for implementing this design. When experimental study designs cannot be implemented, researchers should opt for the best possible quasi-experimental design (Shadish et al., 2002).
3. The Scope for Improving Road Safety: An Overview and a Discussion of Some Measures
3.1. A Policy Analysis for Norway
Highway safety has been greatly improved in many highly motorized countries in the past 35–40 years (Elvik, 2010b). However, there is still potential for considerable improvement of highway safety. A policy analysis for Norway (Elvik, 2007) indicated that the number of road accident fatalities could be reduced by more than 50% by 2020 if all cost-effective road safety measures are fully implemented. The term “cost-effective” denotes a road safety measure whose benefits, according to cost–benefit analysis, are greater than its costs. In the road safety policy analysis made for Norway, four main options for road safety policy were developed. Table 33.2 shows the estimated effects on the expected number of fatalities of the main categories of safety measures that were included in each policy option.
The mean annual number of fatalities during 2003–2006 was 250. In the baseline situation, involving no new safety measures but continued maintenance of measures already in use, the number of fatalities is expected to increase to 285 in 2020. These assumptions are common to all policy options. The following rows of the table show the estimated contributions of main categories of safety measures to reducing the number of road accident fatalities in Norway until 2020.
Exogenous vehicle safety features are those already on the market and whose use is expected to increase in the near future without government regulation. These include air bags, electronic stability control, seat belt reminders, enhanced neck injury protection, and high ratings in new car assessment programs. New vehicle safety features include ISA, intelligent cruise control, eCall (automatic crash notification), and event data recorders. Road-related measures consist of several large or small highway improvements, such as bypass roads, lighting, guardrails, and converting intersections to roundabouts. Enforcement includes both speed cameras and traditional enforcement performed by uniformed police officers. New legislation includes making bicycle helmets and pedestrian reflective devices mandatory. Road user-related measures are older driver retraining and stimulating more hours behind the wheel before licensing of young drivers.
Policy option A, optimal use of road safety measures, is not very realistic. It includes introducing a number of new motor vehicle safety standards, which the Norwegian government cannot do unilaterally. Vehicle safety standards in Europe are introduced by consensus in international bodies, such as the United Nations Economic Commission for Europe or the European Union (Norway is not a member of the European Union). The new vehicle safety features already on the market will contribute to reducing fatalities, but the most effective measures controlled by the Norwegian government are highway improvements and police enforcement.
How about driver training? Is it likely that improving driver training can make a major contribution to improving road safety? How about graduated driver licensing, which is widely regarded as a success in North America? Is it really true that road user behavior can only be effectively influenced by means of repressive measures such as enforcement and sanctions? These issues are discussed next, based on a critical review of current knowledge. Other chapters in this book treat some of the measures discussed here in greater detail. The review presented here is based mainly on The Handbook of Road Safety Measures (Elvik et al., 2009).
3.2. Basic Driver Training
Elvik et al. (2009) reviewed and synthesized the results of 16 studies that evaluated the effects of basic driver training on accidents. Basic driver training refers to the formal training of car drivers before they are licensed for the first time. Depending on age limits, most drivers who are trained for the first time in their lives are 15–18 years old.
Figure 33.3 shows a funnel plot of 45 estimates of the effect of basic driver training on driver accident rates (accidents per million miles of driving). The abscissa shows estimates of effect; the ordinate shows the statistical weight of each estimate of effect. Statistical weight is based on the number of accidents: Estimates of effect based on a large number of accidents have more weight than estimates based on a small number of accidents. For a more detailed explanation, see Elvik et al. (2009). If estimates originate from the same theoretical population, their distribution should have a shape resembling a funnel turned upside down, with estimates based on small samples (at the bottom of the diagram) displaying a larger spread than estimates based on larger samples.
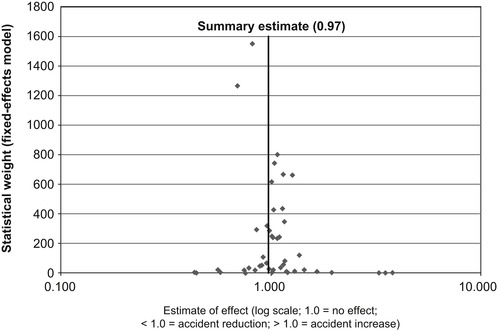
The summary estimate of effect is 0.97, corresponding to a small accident rate reduction of 3%. As can be seen from the diagram, a considerable number of estimates of effect indicate an increase in the accident rate. A closer examination of the studies shows that the effects attributed to driver training vary depending on study design. This is demonstrated in Figure 33.4, which shows mean percentage changes in accident rates in studies employing different study designs.
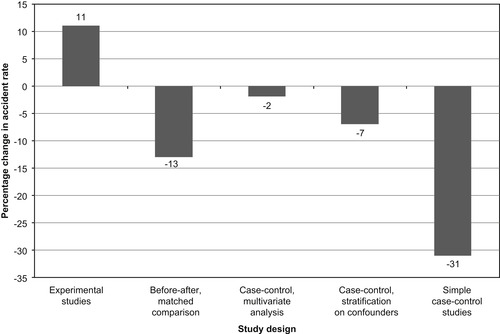
Study designs have been ordered from the strongest to the weakest. A favorable effect on accident rate has only been found in nonexperimental studies. Elvik et al. (2009) discuss various possible explanations of these findings. They conclude that methodological explanations are unlikely to be correct, given the fact that a number of experimental evaluations have been made. They conclude that the most likely explanation is that drivers adapt their behavior to their perceived skills. In other words, drivers who think they are good drivers may adopt smaller safety margins than drivers who are less confident about their own skills.
In short, the challenge in driver training is to teach people that they do not know anything—or that what they know when obtaining a driving license is only a very small part of what they need to know to drive safely. This is an almost impossible challenge. The basic skills needed to operate a motor vehicle are easy to learn—most teenagers can acquire these skills in just a few hours—whereas higher order cognitive skills are perhaps never fully learned.
3.3. Graduated Driver Licensing
Graduated driver licensing (GDL) has been introduced as a means of making novice drivers understand that they are not yet mature drivers by restricting driving that involves enhanced risk, such as nighttime driving or carrying teenaged passengers. A large number of studies have evaluated the effects of GDL programs. Most of these studies report that GDL programs are associated with a reduction in the number of accidents (Elvik et al., 2009). However, there is evidence of publication bias, as tested by the trim-and-fill technique (Duval, 2005). Publication bias denotes a tendency not to publish research reports, for example, because the findings are not statistically significant or are regarded as anomalous, difficult to interpret or explain, or even unwanted. The trim-and-fill technique is a nonparametric statistical technique for detecting and adjusting for publication bias based on an analysis of funnel plots. The technique is based on the assumption that in the absence of publication bias, the data points in a funnel plot should be symmetrically distributed around the summary estimate. If there is asymmetry, this is taken to indicate publication bias, and symmetry is restored by adding data points that are presumably missing as a result of publication bias (Høye & Elvik, 2010).
The crude summary estimate of effect for all accidents is a reduction of 18%; adjusting for publication bias lowers this to 11%. For injury accidents, the bias appears to be even greater. The crude estimate is a 14% accident reduction; adjusted for publication bias, the accident reduction is 6%. Moreover, a tendency is seen for studies that do not control very well for potentially confounding factors to attribute larger effects to GDL than do studies that control better for potential confounding factors. Despite these reservations, the literature does indicate that GDL programs are associated with modest improvements in novice driver safety. However, the effects are far too small to eliminate the difference in accident rate between novice drivers and experienced drivers.
3.4. Speed Enforcement: An Accident Modification Function
The importance of speed enforcement should not be in doubt, given the fact that speeding is widespread and that the risk attributable to it is substantial. It is nevertheless clear that neither police officers nor speed cameras can be deployed at all locations and at all times. To apply speed enforcement optimally, two issues need to be resolved:
1. How is the effect of speed enforcement on accidents related to the amount of enforcement?
2. How should enforcement be carried out in order to maximize its effect in time and space?
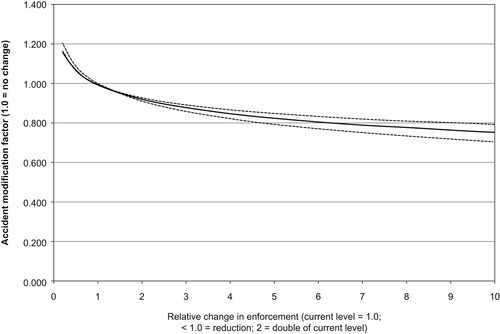 |
| FIGURE 33.5 Source: Data from Elvik (2010a). |
A reduction of the amount of enforcement from a certain baseline level is associated with an increase in the number of accidents. An increase in the amount of enforcement is associated with a reduction of the number of accidents, but the marginal effect declines rapidly.
To maximize the effects of speed enforcement, the deployment of officers should be random—that is, the places and times targeted for enforcement should be selected at random—so that every driver should, in the long term, face the same probability of encountering the police (Bjørnskau & Elvik, 1992). The rationale behind this is that a random deployment of enforcement will prevent road users from detecting any systematic pattern in enforcement and adapt their behavior to this. Moreover, enforcement targeted at particular locations tends to be self-defeating in the long term: Once the police have successfully deterred most violators, there is a tendency for enforcement to be reduced. Violations may then return to the baseline level.
Regarding speed cameras, their effects tend to be very local (Ragnøy, 2002). To extend effects to a longer section of road, it may be necessary to electronically link several speed cameras and measure mean speed for the entire length of road covered by the linked cameras.
3.5. The Need for and Setting of Speed Limits
The need for enforcing speed limits would not exist if speed limits did not exist. Why not leave the choice of speed to drivers? Is there a need for speed limits? This question is discussed by Elvik (2010c), who argues that although most drivers probably think they choose the right speed and see no need to change it, the choices of speed likely to be made by drivers if speed limits did not exist would not produce optimal outcomes from a societal standpoint. Specifically, Elvik concludes that speed limits are needed for the following reasons:
1. Drivers tend to ignore, or assign minor importance to, impacts of speed that they do not immediately notice or that do not directly affect their personal utility. Specifically, environmental impacts of speed choice are largely ignored by drivers.
2. Drivers do not correctly perceive the relationship between speed and travel time. Gains in travel time attributable to small increases in high speed are overestimated, whereas corresponding gains attributable to small increases in low speed are underestimated. These misconceptions may lead drivers to commit more serious violations of low speed limits than of high speed limits because drivers erroneously think that they need to increase speed substantially to save time if initial speed is low, whereas small increases in high speeds do not produce the gains in travel time drivers think they do. Data on speed violations in Sweden provide evidence supporting these implications.
3. Drivers underestimate the increased risk of accident associated with increased speed.
4. Drivers underestimate impact speed in situations in which it is clear that an accident is unavoidable, but its severity can be reduced by braking.
5. Driver preferences with regard to safe speed are very heterogeneous, making the coordination of speed choices difficult.
The implications of the divergence between subjective and objective rationality are profound. Someone who regards his or her choices as rational from his or her point of view will rarely see strong reasons for changing the choices. Making a different choice would suggest that the original choice was somehow stupid or wrong. Most people do not like to be told that they are stupid. To the extent that drivers are satisfied with their choices of speed, persuading them to make a different choice is likely to be difficult. Moreover, because preferences regarding speed vary greatly among drivers, any speed limit is likely to be unpopular and regarded as either too high or too low by a considerable proportion of drivers, at least if speed limits are close to the median preferences of drivers (i.e., limits are set so that 50% of drivers think they are too low and 50% think they are too high).
3.6. The Prospects for Rewarding Safe Behavior—and Its Price Tag
Can safer road user behavior be stimulated by rewarding it? Until now, the difficulties of reliably observing road user behavior have precluded the introduction of systems designed to reward safe behavior. Today, technologies for unobtrusive observation of road user behavior are rapidly developing, enabling the introduction of rewarding systems that have so far not been possible. For example, a driving computer, containing a digital map, can record the following:
1. Route choice
2. Speed
3. Use of daytime running lights
4. Following distance
5. Use of indicators
6. Impact speed in case of an accident
In principle, a road pricing system can be designed to reward safe behavior by putting a price tag on, for example, speeding or tailgating (Elvik, 2010d). With such a system in place, drivers would soon discover that safe behavior brings a reward in the form of lower charges for using highways. A trial in Sweden, offering rewards for complying with speed limits, found that drivers do respond to economic incentives (Lindberg, 2006). However, many drivers would regard the system as an unacceptable invasion of privacy and might not perceive the lower charges associated with safe behavior as a reward because they would still be paying to use highways. An option that deserves consideration is to charge more for speeding than the societal cost it generates in order to make a surplus. This surplus could then be paid back to law-abiding drivers to make the reward for safe behavior more tangible.
Drivers can be provided with monetary incentives for safe behavior if they consent to having their behavior monitored continuously and in great detail by a driving computer and, possibly, a camera capturing their face. Because many drivers probably regard the current level of accident risk as perfectly acceptable, it is not very likely that they would see any advantage of introducing an invasive technology designed to discourage them from speeding, driving when fatigued, or committing simple errors such as forgetting to signal when turning.
4. Discussion and Summary
Highway safety has been greatly improved in many highly motorized countries in the past 40–50 years. The rate of progress has not been the same in all countries, but there is no doubt that highway travel is considerably safer today than it was when traffic fatalities peaked in the highly motorized countries in 1970–1972. What accounts for the improvement in highway safety? To what extent has knowledge gained in traffic psychology contributed to it? It is difficult to give very precise answers to these questions. The improvement in highway safety is no doubt the result of a large number of safety measures that have been introduced but probably also the result of less tangible factors, such as subtle changes in culture or a higher demand for and valuation of safety as a result of greater wealth.
Traffic psychology may, in a sense, be regarded as the dismal science of traffic safety. The term “dismal science” is usually reserved for economics because economists often remind us that resources are scarce, that we cannot get everything we want, that we are greedy and egocentric, that cycles of boom and bust will repeat themselves, and so on. Traffic psychology reminds us that humans are the most difficult part of the highway system to change. Road users will commit errors, misperceive risks, or deliberately take risks, such as drinking and driving, speeding, and so on. One is left with the impression that little can be done to change this. This impression is too pessimistic.
During the past 40–50 years, several important changes in road user behavior have contributed to improved safety. The wearing of seat belts has increased in all highly motorized countries. Children are more often restrained in cars than in the past. Drinking and driving has probably been reduced in many countries, although data confirming this are less complete than the data on seat belt wearing and the use of child restraints. In many motorized countries, more motorcycle riders wear helmets today than 40–50 years ago. In the United States, however, laws mandating the use of helmets by motorcyclists have remained controversial and have been repealed in many states.
Despite these improvements, unsafe road user behavior continues to be a major road safety problem. What are the prospects of significantly reducing the contribution that unsafe road user behavior makes to traffic fatalities? It depends on which measures are taken to influence road user behavior. Persuasion alone is not likely to be very effective. Most road users think that their behavior is entirely appropriate and see no reason to change it. Telling them to change is unlikely to impress them. Repression may be more effective. More police enforcement will contain speeding and other types of unsafe behavior, but it is impossible for the police to be everywhere at all times. The risk of apprehension will remain low. From a theoretical standpoint, rewarding safe behavior is the most attractive option for promoting it. However, to reward safe behavior, it is necessary to observe behavior in some detail, and the technology permitting such observation will probably be regarded as highly intrusive by many drivers. Drivers may reject this technology, although it could make travel much safer than it is today.
Perhaps the key contribution that traffic psychology could make to safety policy is therefore, in the manner of a dismal science, to warn against all sorts of wishful thinking that may influence this policy. It is wishful thinking to believe that road users will suddenly realize that their behavior is sometimes unsafe and make amends. It is wishful thinking to believe that massive police enforcement can solve the problem. It is wishful thinking to believe that new technologies, such as intelligent speed adaptation, intelligent cruise control, lane departure warning, or fatigue monitoring, will not elicit behavioral adaptation that may partly or fully offset the safety effects of these technologies. It is wishful thinking to believe that driver training can ever reduce novice driver accident rates to the same level as the accident rate of highly experienced drivers. It is wishful thinking to believe that drivers will welcome technologies that continuously and in great detail monitor their behavior, even if by doing so new opportunities are created for rewarding safe behavior and thus reduce accident rates.
Although it is the role of traffic psychology to remind policy makers of the limits of their influence on the human element of the traffic system, psychologists should also point out that effective ways of influencing human behavior exist. Specifically, key contributions of traffic psychology to road safety policy include the following:
1. Encouraging and contributing to systematic surveys of road user behavior, particularly behavior that is important for safety
2. Analyzing the relationship between specific types of behavior and highway safety
3. Modeling road user behavior, particularly by identifying factors that contribute to unsafe behavior
4. Analyzing human capabilities and performance to help develop design guidelines for highways, traffic control devices, and motor vehicles
5. Contributing to the estimation of expected effects of road safety measures, particularly by trying to predict if new safety measures will elicit behavioral adaptation from road users
6. Critically assessing the quality of road safety evaluation research and advocating the use of randomized controlled trials whenever possible
7. Contributing to the development of targets for improving highway safety that are maximally motivating for all stakeholders involved
References
Amundsen, A.H.; Bjørnskau, T., Utrygghet og risikokompensasjon i transportsystemet. (Report No. 622) (2003) Transportøkonomisk Institutt, Oslo, Norway.
Anderson, M.; Vedung, E., Målstyrning på villovägar. Om det trafiksäkerhetspolitiska etappmålet för år 2007. (2005) Cajoma Consulting, Uppsala, Sweden.
Bjørnskau, T., Hypotheses on risk compensation, In: Proceedings of the Conference Road Safety in Europe and Strategic Highway Research Program (SHRP), Lille, France, September 26–28, 1994, Vol. 4. (1994) Swedish Road and Transport Research Institute, Linköping, pp. 81–98.
Bjørnskau, T.; Elvik, R., Can road traffic law enforcement permanently reduce the number of accidents?Accident Analysis and Prevention 24 (1992) 507–520.
Duval, S., The trim and fill method, In: (Editors: Rothstein, H.R.; Sutton, A.J.; Borenstein, M.) Publication bias in meta-analysis—Prevention, assessment and adjustments (2005) Wiley, Chichester, UK, pp. 127–144.
Elvik, R., Are road safety evaluation studies published in peer reviewed journals more valid than similar studies not published in peer reviewed journals?Accident Analysis and Prevention 30 (1998) 101–118.
Elvik, R., To what extent can theory account for the findings of road safety evaluation studies?Accident Analysis and Prevention 36 (2004) 841–849.
Elvik, R., Prospects for improving road safety in Norway. (Report No. 897) (2007) Institute of Transport Economics, Oslo, Norway.
Elvik, R., Road safety management by objectives: A critical analysis of the Norwegian approach, Accident Analysis and Prevention 40 (2008) 1115–1122.
Elvik, R., An exploratory analysis of models for estimating the combined effects of road safety measures, Accident Analysis and Prevention 41 (2009) 876–880.
Elvik, R., The power model of the relationship between speed and road safety. Update and new analyses. (Report No. 1034) (2009) Institute of Transport Economics, Oslo, Norway.
Elvik, R., Utviklingen i oppdagelsesrisiko for trafikkforseelser. (Report No. 1059) (2010) Transportøkonomisk Institutt, Oslo, Norway.
Elvik, R., The stability of long-term trends in the number of traffic fatalities in a sample of highly motorised countries, Accident Analysis and Prevention 42 (2010) 245–260.
Elvik, R., A restatement of the case for speed limits, Transport Policy 17 (2010) 196–204.
Elvik, R., Strengthening incentives for efficient road safety policy priorities: The roles of cost–benefit analysis and road pricing, Safety Science 48 (2010) 1189–1196.
Elvik, R.; Høye, A.; Vaa, T.; Sørensen, M., The handbook of road safety measures. 2nd ed. (2009) Emerald, Bingley, UK.
Elvik, R.; Veisten, K., Barriers to the use of efficiency assessment tools in road safety policy. (Report No. 785) (2005) Institute of Transport Economics, Oslo, Norway.
Evans, L., Human behaviour feedback and traffic safety, Human Factors 27 (1985) 555–576.
Høye, A.; Elvik, R., Publication bias in road safety evaluation: How can it be detected and how common is it?Transportation Research Record 2147 (2010) 1–8.
Klauer, S.G.; Dingus, T.A.; Neale, V.L.; Sudweeks, J.D.; Ramsey, D.J., The impact of driver inattention on near-crash/crash risk: An analysis using the 100-car naturalistic driving study data. (Report No. DOT HS 810 594) (2006) U.S. Department of Transportation, National Highway Traffic Safety Administration, Washington, DC.
Lindberg, G., Valuation and pricing of traffic safety. (2006) PhD dissertation, Örebro Studies in Economics 13, Örebro University, Örebro, Sweden.
Locke, E.A.; Latham, G.P., Building a practically useful theory of goal setting and task motivation. A 35-year odyssey, American Psychologist 57 (2002) 705–717.
Organisation for Economic Co-operation and Development, Towards zero: Ambitious road safety targets and the safe system approach. (2008) ; Paris.
Ragnøy, A., Automatisk trafikkontroll (ATK): Effekt på kjørefart. (Report No. 573) (2002) Transportøkonomisk Institutt, Oslo, Norway.
Rothman, K.J.; Greenland, S., Modern epidemiology. (1998) Lippincott Williams & Wilkins, Philadelphia.
Shadish, W.R.; Cook, T.D.; Campbell, D.T., Experimental and quasi-experimental designs for generalized causal inference. (2002) Houghton Mifflin, Boston.