Figure 2.1. Boats: Share of total expenditures, consumption as compared to national average and consumption to income ratio. Data source: Consumer Expenditure Survey, Bureau of Labor Statistics.
Conspicuous Consumption in the Twenty-first Century
It is from our disposition to admire, and consequently to imitate, the rich and the great, that they are enabled to set, or to lead what is called the fashion. Their dress is the fashionable dress; the language of their conversation, the fashionable style; their air and deportment, the fashionable behaviour. Even their vices and follies are fashionable.
—Adam Smith The Theory of Moral Sentiments (1790)
In The Theory of the Leisure Class, Thorstein Veblen observed that conspicuous consumption was also practiced among those outside of the rich, or what he called the “impecunious classes.” These poorer strata of society spent on nonessentials—maybe not as much as the leisure class with their silver spoons and games of croquet, but as he pointed out, from hunter and gatherer societies to the present day, most human beings have a desire to fit in and we often rely on social constructs to do so. Veblen, scorned as he was for his writings on class and consumption, has perpetuated as a person of interest for writers and scholars in the decades thereafter and to the present day. He pinpointed an important truth: Material goods define who we are and where we stand in the social order.
Fifty years later, in his book The Affluent Society, John Kenneth Galbraith observed a wide swath of society engaging in gratuitous consumption or what he called “consumer-demand creation.”1 Galbraith did not believe that much of what we bought was necessary, or “organic,” as he put it. The rise of “private demand” and the consumer economy occurred at the expense of the public good. In his 1957 book, The Hidden Persuaders, Vance Packard argued that the rush of consumer goods meant advertisers, marketers, and promoters needed to create consumer desire, perpetuating a cycle of materialism.2 Galbraith found this cycle disconcerting because as society became more absorbed by materialism, the superficial differences between the rich and the rest seemed much less distinct. The ostensible democratization of consumerism obfuscated inequality and essentially lulled society into thinking everyone had a slice of the pie and would mask real issues of wealth disparity.
The consumption of socially visible material goods to convey socioeconomic status has been in place for thousands of years. Even before the deluge of cheap goods that the latter half of the twentieth century provided, the historian Paul Johnson observed that the Victorian and Edwardian English working class wore “Sunday best” (or placed ornaments on their working clothes if they could not afford the former) and spent extravagantly on beach vacations or what the English call “sun holidays”—much to the consternation of the middle class, who believed this behavior was wasteful and useless. Yet the working classes were doing what the middle class and leisure class practiced in their own socioeconomic universes, albeit employing different means to demonstrate status. As Johnson himself remarks, because the middle class was not a part of the working-class cultural world, they could not understand the intergroup dynamics that made these efforts important means of assimilation and status marking. The working classes found their own conduits to suggest social position, just as the middle and upper classes did within their own groups.3 On the other hand, the rising bourgeoisie, as an economic juggernaut independent of the aristocracy, bought big houses and decorated them ornately to identify themselves as a part of this new middle class. After all, the middle classes were increasingly upwardly mobile without the benefit of birthright.4 Veblen believed the proliferation of conspicuous consumption would increase as society became more and more industrialized, paving the way for overall rising incomes and a flood of new consumer goods. In his Pulitzer Prize–winning work, The Americans: A Democratic Experience, the University of Chicago historian Daniel Boorstin described the relationship between America’s built environment and its development as a society. One of Boorstin’s lasting observations is that of the emergence of department stores and their display of lavish goods as one of the first instances of the “democratization of luxury” for the masses.
This book focuses primarily on the habits, norms, and consumer patterns of the twenty-first-century aspirational class. Yet, this cultural formation could not exist without what has come before it. To understand how the aspirational class consumes requires understanding how Americans in general consume and how this has changed over time. Like all groups, aspirational class identification is part differentiation and part assimilation, and often both at once. This chapter will look at how America consumes across income levels and over time and how these spending habits are influenced by our race, gender, profession, location, and income level. Only then do the habits and practices of the aspirational class make sense as a part of the wider context of American consumer culture in the twenty-first century.
Over the past several decades, there has been an increase in three important macro trends in American spending behavior. First, the rich and upper middle class—that is, those in the top 1% and those in the top 5% and 10% income brackets—spend less as a percentage of their expenditures on conspicuous consumption relative to what the US average spends on the same goods, while the middle class—the 40th–60th percentiles—spends more. Second, as a share of their expenditures, the middle class is spending more on conspicuous consumption relative to their income while the wealthy (and the very poor) are spending less. Third, conspicuous consumption among the rich has been replaced by “inconspicuous consumption”—spending on nonvisible, highly expensive goods and services that give people more time and, in the long term, shape life chances. These include education, health care, child care, and labor-intensive services like nannies, gardeners, and housekeepers. This chapter will deal with the first of these two trends and briefly discuss the third; I will devote chapter 3 to inconspicuous consumption. For now, let’s look at how America spends and in particular the role of conspicuous consumption in those spending patterns.
How do we know such specific details about how America spends? In order to get at macro consumer trends, my doctoral student Hyojung Lee and I analyzed a unique and largely unstudied dataset called the Consumer Expenditure Survey. For decades, the Consumer Expenditure Survey (CE) has been interviewing and surveying American households on their consumption habits, documenting everything from the units of cornflakes the average Minnesotan consumes to how much money a New Yorker spends on shoes, child care, rent, or silver flatware. Administered by the government’s Bureau of Labor Statistics, the CE gathers this data through two channels: diary data recorded by households over two one-week periods, and quarterly interviews with households conducted by the Bureau of Labor Statistics. The diary data allow for the tracking of small, frequent purchases associated with day-to-day life, from bags of potato chips to cups of coffee. The interview data capture bigger expenditures like mortgages, car payments, and new televisions. The integrated data thus deliver an overall picture of how America spends its money. Using this information, we have been studying macro changes in American consumption habits over the past 20 years. The nature of the data allows us to study consumption habits by race, education, gender, geographic location, and myriad other demographic and socioeconomic characteristics. When we first discovered this dataset we were specifically interested in the seemingly “gratuitous” expenditures that were made to suggest status. But the data also allow us to analyze the general patterns in how we consume and how consumption has changed over time. Thus our study provides a portrait of conspicuous consumption, but also uncovers broad trends in where we live, where we work, our age, our race, and our marital status shape our consumer habits in surprising ways.
A PORTRAIT OF AMERICA’S CONSUMPTION
Remarkably, our consumption habits as a society have remained roughly constant decade after decade, which is to say that despite the ebbs and flows in the items that serve as markers of status (kale vs. spinach, BMWs vs. Cadillacs, dishware, and where to go on vacation), there are predictable patterns in the proportions of food, housing, alcohol, entertainment, personal insurance, and pensions that we consume.
For example, in 1996, we devoted 14.2% of our total expenditures to food; in 2014, our total expenditure in this category was 15%.5 Alcohol is similarly constant, hovering at just less than 1% of total expenditures, as is tobacco, which remains static (surprisingly so, given the huge anti-smoking campaigns of the past 15–20 years). We spend the same on personal insurance and pensions (roughly 11% of total expenditures), and housing (slightly more than 30%). These findings suggest that basic household needs and expenses remain persistent—housing and buying groceries. In a few instances, we spend notably less: apparel (from 4.1% of total expenditures in 1996 to 2.2% in 2014) and transportation (19.7% in 1996 and 16.9% in 2014), both of which reflect globalization’s cheaper cars and cheaper clothes. There are two categories where we spend more: health care (up from 5.1% to 8.1%) and education (up from 1.4% to 2.1%). (See table 2.1.)
Table 2.1. General consumer expenditure patterns (all income groups) by share of annual total expenditures (%, selected years)
1996 |
2000 |
2004 |
2008 |
2012 |
2014 |
|
Annual total expenditures |
100.0 |
100.0 |
100.0 |
100.0 |
100.0 |
100.0 |
Food |
14.2 |
13.6 |
13.7 |
14.8 |
15.0 |
15.0 |
Alcoholic beverages |
0.9 |
0.8 |
0.8 |
0.7 |
0.7 |
0.8 |
Housing |
30.3 |
30.9 |
32.0 |
33.3 |
32.2 |
33.0 |
Apparel and services |
4.1 |
3.7 |
3.0 |
2.5 |
2.3 |
2.2 |
Transportation |
19.7 |
20.0 |
19.0 |
17.3 |
17.8 |
16.9 |
Health care |
5.1 |
5.3 |
5.9 |
5.9 |
6.8 |
8.1 |
Entertainment |
5.2 |
4.9 |
5.1 |
5.1 |
4.6 |
4.6 |
Personal care products and services |
0.9 |
0.8 |
0.7 |
0.6 |
0.6 |
0.6 |
Reading |
0.5 |
0.4 |
0.3 |
0.2 |
0.2 |
0.2 |
Education |
1.4 |
1.5 |
2.0 |
2.1 |
2.3 |
2.1 |
Tobacco products and smoking supplies |
0.8 |
0.9 |
0.7 |
0.7 |
0.7 |
0.6 |
Miscellaneous |
2.5 |
2.0 |
1.6 |
1.6 |
1.6 |
1.1 |
Cash contributions |
3.3 |
3.6 |
3.5 |
3.6 |
3.9 |
3.5 |
Personal insurance and pensions |
11.2 |
11.5 |
11.9 |
11.6 |
11.3 |
11.2 |
As a society, we all eat out more, we all drink out more, and we all buy more stuff for our houses, whether fridges, furniture, textiles, or clocks. Our spending on these goods is linearly related to our income: The more we make, the more we spend on such items. Most people, except for the very poor, spend roughly the same share of their expenditures on these items. One exception to note: China, dishware, and those silver spoons are significantly less of a status marker today than in 1996. Every income group spends less on dining accoutrements, both in absolute dollars and as a share of expenditures. Take the top 1%: In 1996, they spent at least 0.1% of their expenditures on these classic Veblen status goods; by 2014, they spent almost zero percent of their total expenditures on them.
At first blush, as a society we seem to look more or less the same as we did almost 20 years ago. But if we parse out consumer patterns by income groups, a more nuanced story emerges which suggests Veblen’s and Galbraith’s concerns about conspicuous and material consumption were just the tip of the iceberg when it comes to massive differences across income and class. I will elaborate on this finding in the coming pages.
For example, overall, while education expenditures have increased 60% since 1996, the top 1%, 5%, and 10% income fractiles have increased their share of education expenditures by almost 300% during this same time period. Conversely, education expenditure shares have remained almost flat for the other groups, which suggests that top groups drove the uptick in education spending. Housing holds roughly the same share of total expenditures for the wealthy over the past 18 years, but it is 3–4% more of total expenditures for the middle class and lower income group. Food has become a greater share of expenditures for the third and fourth quintiles (those in the 40th–60th percentile and 60th–80th percentile of income distribution), while remaining flat for everyone else. Do these increases in basic costs of living for our middle classes decrease their spending power on education, cash contributions, and pensions—expenditures that have notably increased for the higher income groups, and tend to be expenditures that can shape the future, rather than just offer immediate gratification? The top 1% has increased the share of expenditure on personal insurance and pensions by 25% since 1996 and cash contributions by 28% since 1996, while those for average consumers have remained flat. (The top 5% and 10% have increased expenditures in cash contributions and education but not personal insurance.) The increased consumption shares of these expenditures in the top income groups suggest genuinely different trajectories for the future in a number of ways. The children who benefit from increased investment in education go on to obtain better jobs, higher incomes, and a better future for their families. Those who can afford it devote more to their pensions and insurance, have a better retirement (and in fact, can retire), better medical care, and better quality of life. These types of investments offer meaningfully different outcomes for those able to spend compared to everyone else.
CONSPICUOUS CONSUMPTION AND “VEBLEN GOODS”
The late Princeton economist Harvey Leibenstein coined the term “Veblen goods” or “Veblen effects” to describe the goods that are used for conspicuous consumption. Examining consumption patterns by income also shows differences across society in how we conspicuously consume those classic Veblen goods. Let’s look at the first emerging trend I mentioned at the beginning of this chapter: The rich are spending less on goods that demonstrate wealth. In 1996,6 the top 1% spent almost four times more than everyone else on conspicuous consumption—apparel, watches, jewelry, cars, and other socially visible goods. This is not an entirely surprising finding given that they were earning more than five times more than the national average—there’s a significant amount of excess money. But today, still making more than six times more than everyone else in income (and that’s an average, never mind those making ten or twenty times more), they are spending only three times more than everyone else on conspicuous consumption.
The important relationship here is the income to conspicuous consumption ratio,7 which enables us to approximate what their income essentially allows them to spend on conspicuous consumption as compared to the nation as a whole. If the ratio is 1.00, then they are spending on conspicuous goods what would be expected given their income level (or 100%). By this measure, the top income groups are spending just 65–80% of what their income to conspicuous consumption ratio allows. Further, for the top 1% and 5%, this ratio has decreased 18 and 12 percentage points respectively since 1996 (it’s gone down 10 percentage points for the top 10%). The exception is clothing and accessories: The top 5% and 10% still spend significantly less than their income to consumption ratio would allow, but they spend more than they did in 1996, while the middle class and low-income groups still spend more than they should in this category but the same or less than they did in 1996.
Table 2.2. Conspicuous consumption to income ratio in 1996 and 2014 (selected items)
Overall |
Clothing and accessories |
Vehicles |
TV and audio equipment |
|||||
1996 |
2014 |
1996 |
2014 |
1996 |
2014 |
1996 |
2014 |
|
All households |
1.00 |
1.00 |
1.00 |
1.00 |
1.00 |
1.00 |
1.00 |
1.00 |
Top 1% |
0.65 |
0.47 |
0.61 |
1.06 |
0.58 |
0.31 |
0.77 |
0.44 |
Top 5% |
0.76 |
0.64 |
0.80 |
0.91 |
0.69 |
0.58 |
0.62 |
0.62 |
Top 10% |
0.80 |
0.70 |
0.86 |
0.90 |
0.75 |
0.67 |
0.71 |
0.70 |
60th–89th percentile |
0.99 |
1.03 |
0.97 |
0.97 |
0.98 |
1.04 |
1.01 |
0.95 |
40th–59th percentile |
1.19 |
1.35 |
1.11 |
1.11 |
1.28 |
1.46 |
1.18 |
1.42 |
0–39th percentile |
1.47 |
1.51 |
1.46 |
1.38 |
1.50 |
1.38 |
1.68 |
1.78 |
These other groups, along with the low-income group (0 to 39th percentile), often spend more on conspicuous consumption than their income-consumption ratio would advise. For the poor, the basic expenses are a greater share of their income, so they have less, if any, funds available for conspicuous consumption. Since 1996, the spending on conspicuous consumption by those in the low-income group has declined for clothing and cars, but their overall ratio has mostly increased.
Middle-class income groups, however, demonstrate the opposite trend, capitalizing on the flood of affordable consumer goods coming from around the world. For the middle class (those in the 40th to 59th percentile), their income to consumption ratio has gone up by 16 percentage points. During this time period, clothing and accessories have become cheaper overall as a result of globalized manufacturing and new technologies, yet the middle class still spends 35% more on conspicuous consumption than their income would suggest they should, and 16 percentage points more than they did in 1996 (see table 2.2).8 The same trend holds true for specific types of conspicuous goods such as clothing and accessories, and vehicles, TVs, and audio equipment: In 2014, the top 1% spent less on TVs than they did in 1996, and the magnitude of decline in this consumption category was greatest within this income group. According to the income-consumption ratio, the top 1% spend less than half of what would be expected, while the middle class spends over 40% more than expected for both cars and television (see table 2.2).
But to be clear, the rich are not suddenly consuming less all around. In fact, as a share of their total expenditures, the top 5% or top 10% spend just about on par with the other income groups on conspicuous goods—it’s just that their income would allow them to spend even more. In 2014, 17% of their total expenditures went to conspicuous consumption versus the middle class, who spent 18.1%. The closeness in their share of conspicuous consumption expenditures suggests that while having more money may give you more opportunities to spend on conspicuous consumption, the consumption of visible, material goods tends to be a universal practice across all income groups. What Veblen observed more than a century ago still holds true today.
GILDED CONSPICUOUS CONSUMPTION
Because many conspicuous goods are now accessible to every income group, the wealthy do not distinguish themselves through goods that are widely available and increasingly affordable to the middle class (even if only through finance plans and credit for the latter). The conventional items of conspicuous consumption have become part and parcel of many Americans’ lives, and so the rich now disproportionately spend on fancy watches and jewelry and boats—luxury items with tremendous price tags that are impossible for the average American to afford. These are the new status items for the rich. Looking at the data, the top 1% spent significantly more money on watches and jewelry than everyone else in absolute dollars and as share of total expenditures. In 2014, the top 1% spent more than double even what the top 5% spent and significantly more as a share of total expenditures compared to the national average. The same is true for repairs for those expensive watches and jewelry: The rich have always spent more for high-end repairs, but today the top 1% spends more than eight times the national average in absolute dollars, while the top 10% class spends half of the national average. Of course, this trend makes sense because the wealthy own watches and jewelry worth repairing, and those repairs cost real money. The “servicing” of a Rolex or its ilk will cost anywhere from $500 to $1,000, which is significantly more than an average person would spend on a watch in the first place. The same finding holds true for car repairs and service clubs, where the top 10% spends almost double the national average and the middle class spends less than the national average.
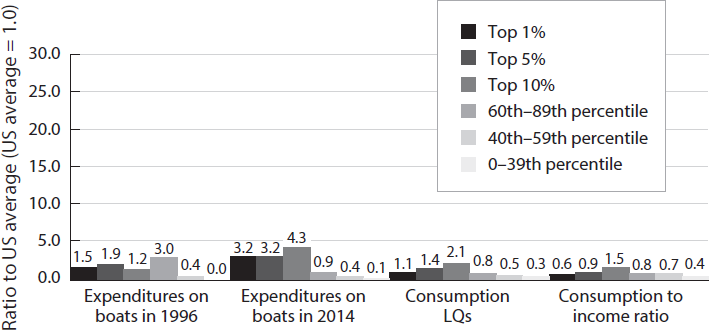
Figure 2.1. Boats: Share of total expenditures, consumption as compared to national average and consumption to income ratio. Data source: Consumer Expenditure Survey, Bureau of Labor Statistics.
Unsurprisingly, boats are a conspicuous item among the twenty-first-century gilded set, with an even greater deviation from the average household’s consumption. In 2014, the top 1% spent three times more than the national average. As a share of their total expenditures, the top earners tend to spend more than the national average, as shown in the consumption LQs (1.1 to 2.1 in the LQs), ranging from 6% to 100% more. Unsurprisingly, middle-class and lower income groups spend much less on boats than everyone else on this item, just 50% and 26% of the national average, respectively (shown as 0.8 and 0.3 in the LQs) (see figure 2.1).
One final observation on conspicuous consumption: A notable expenditure item for lower income families is funerals. Since 1996, low-income families consistently rank as the highest spenders on funerals relative to their total expenditures, while the rich spend less than the national average on them for most of the years studied. In 2014, the top 1% spent significantly less on funerals than everyone else even in absolute dollars, while the poor spend a 26% greater share of total expenditures than the national average and the middle class conform to national trends. Throughout time, this pattern bears out and we can turn to historians for some explanation. Paul Johnson remarked that funerals were an important display of status among the working class of Edwardian and Victorian England, while they were shunned by the bourgeois (who would have had myriad alternative outlets to display status). In comparison to the rich, who host and attend museum galas, charity events, and endless dinner parties, the poor are relatively limited in their avenues to engage in conspicuous consumption. Or, as David Sloane, the urban historian and author of The Last Great Necessity: Cemeteries in American History, explained, “For working class families the death, especially of a child or a breadwinner, traditionally has immense impacts. Also, poorer communities often have very high levels of social capital, and are reliant on that social capital for their survival. Most families spend considerable amounts of money on the performative aspects of the funeral—a necessary expense to show respect—as well as on the community aspect of the funeral—[for example] the Irish wake.” Sloane continued, “In addition, wealthier families … have a different attitude towards death, the dead, and funerals…. many keep it very private, and thus lower their expenses. They may have a memorial service with a reception, but the costs may be limited. Finally, the richer one is, the more educated one is, the more likely they are to cremate. Many working class families are more likely to bury, while wealthier families are much more likely to cremate—which isn’t always but should mostly be cheaper.”9
VEBLEN EFFECTS: HOW RACE, EDUCATION, AND MARITAL STATUS AFFECT HOW WE SPEND
Income—high or low—affects how we spend, and not just how much we spend on conspicuous consumption, but the peculiarities and idiosyncrasies in what we choose to spend on as well, whether funerals or watches. Income influences spending on conspicuous consumption, but many other factors influence our desire for material goods. How we respond to and are motivated by socially visible goods, what economists call “Veblen effects,” is also determined by our age, profession, race, and marital status—even where we live.
Two academic papers have made significant inroads into understanding the economic, social, and demographic variables that shape our conspicuous consumption practices, looking beyond simply how much money one makes. Writing in 2007, University of Chicago and Wharton School economists Kerwin Charles, Erik Hurst, and Nikolai Roussanov sought to explore the role of race in status purchasing. Using the Consumer Expenditure Survey, they find that across all races, as people become wealthier and more educated, they spend more in absolute dollars on conspicuous consumption. Controlling for all other factors and just looking at the effect of race, Charles and his colleagues find that blacks and Hispanics spend more of their income on conspicuous consumption than whites within the same income and education groups. Charles speculates that this finding is a result of discrimination: These minority groups are under greater pressure to visibly display their social position than whites or Asians. By demonstrating that they own a nice car, dress well, and so forth, they are able to signal their class. For minority groups with a history of being discriminated against, conspicuous consumption becomes a means through which they can efficiently demonstrate their social and economic position before being pre-judged.10 This finding is almost the opposite of what has been observed of upper-class WASP culture: With an absence of any discrimination and oppression, this group has been able to comfortably downplay material goods, with the assumption that their social position will be assumed by the color of their skin.
Others who study conspicuous consumption have tried to study the role of specific material goods in relationship to a variety of demographic characteristics. Ori Heffetz, a Cornell University economist, views conspicuous consumption as those goods that are “culturally visible,” that is, they are consumed in particular socioeconomic contexts, rather than simply being a necessity that everyone needs (such as water or a loaf of bread). Heffetz, like Charles and his colleagues, finds that the wealthier people are, the more they spend (in absolute dollars) on visible goods (regardless of race or ethnic background). Even though lower income groups may be devoting more of their income to conspicuous consumption, Heffetz would argue that the rich get a greater impact from whatever funds they devote to conspicuous spending.11 This observation may seem like a contradiction to the earlier point that top income groups are devoting less of their expenditures to conspicuous consumption. There are two points to keep in mind here. First, even if it is true that wealthier individuals spend more in absolute dollars on conspicuous goods, these goods have less of an impact on their overall net income. So, a Rolex watch may cost $10,000, but if you’re very rich, that $10,000 may be the equivalent of $50 to a middle-class family. The important distinction is that conspicuous consumption costs the rich less, irrespective of absolute dollars spent. Second, controlling for all other things, a higher income person will spend more (in absolute dollars, not in share of expenditures) on conspicuous consumption, but this observation is not in contradiction with the wider pattern that top income groups tend to spend less of their overall income on conspicuous consumption. These wider patterns are not isolating income as the only determining variable; instead, they are looking at the whole population of wealthy people, taking into account demographics, professions, and age. Through studying the rich collectively, it is clear they are spending less on conspicuous consumption and more on inconspicuous consumption.
In our studies on conspicuous consumption, Hyojung and I draw from the work of Charles, Heffetz, and their colleagues, but update and expand the data to the present decade (along with adding previous years and more variables). We present a more detailed and up-to-date portrait of what affects our consumption patterns. Our work considers the interplay of education, race, age, geography, city size, household size, homeownership, marital status, and income elasticity. In each of these instances, we isolate a particular variable (such as education) and study its individual effect on spending. For example, considering race, we are looking at heads of households who are identical by every measure above, other than their race. These individuals attained the same education level, make the same amount of money, have the same number of children and so forth. This allows us to pinpoint the exact effect of race (or income, education, or some other chosen variable) on how someone spends. We also add another component central to twenty-first-century spending patterns: Understanding new forms of consumption that reveal status and socioeconomic position. Given the increase in conspicuous consumption across society, how do different groups distinguish themselves from one another? In the beginning of the chapter, I highlighted a new trend among the wealthy: the rise of inconspicuous consumption. That is, consumption that is not intended to be socially or culturally visible but reveals class position, such as the hiring of gardeners, nannies, or car services, or funneling money into education and retirement plans. None of these goods are material or used for status, but reveal wealth through the fact that one can afford to use them. I will devote the next chapter to the role of inconspicuous consumption within the new elite. Here, however, I consider the different variables that impact our choice to spend on conspicuous and inconspicuous consumption or to not spend on either.
Our results suggest that who we are, demographically speaking, has a profound impact on how we spend. On the subject of age: Controlling for all other demographic and socioeconomic factors, the younger one is the more one spends on both conspicuous and inconspicuous consumption. Although, with regard to inconspicuous consumption, the differences by age are less dramatic. The least likely to spend on conspicuous consumption are those ages 45–54 and those 75 years or older. This finding makes sense: Those in the 18–24 age range have fewer obligations than those in the older age groups. Those in the 45–54 age range are in the prime of their spending on household and children upkeep (whether mortgages, children’s clothing, or school fees), and thus spend less on conspicuous consumption. However, when it comes to inconspicuous consumption, those beyond 75 years old spend almost as much as those in the 16–24-year age bracket, while those aged 34–54 spend the least. For the 75 and older group, they likely now depend to a greater extent on labor-intensive services, whether that is at-home care or a housekeeper.
In our analysis, race is also a significant factor in how people spend. Our results corroborate the earlier work by Kerwin Charles and his colleagues and the role of conspicuous consumption for minorities. Our results show that Hispanics are the most likely to spend on conspicuous consumption: 4.4% more than non-Hispanic whites, 15% more than blacks, and almost 20% more than Asians, though next to Asians, Hispanics are the least likely to spend on inconspicuous consumption. Non-Hispanic whites are the biggest spenders on inconspicuous consumption, followed by blacks. Controlling for all other factors, Asians spend the least on both conspicuous and inconspicuous consumption (see tables 2.3 and 2.4).
Married people spend the most on conspicuous consumption, and widowers the least. The never-married spend almost 18% less than the married, a surprising finding given they would seem to be the ones with fewer home obligations and more free time and money. Then again, married people may have regular “obligations” such as birthdays, Christmas, and other holidays that influence their spending on their spouse, along with similar holidays for their children. Homeowners spend more on conspicuous consumption than renters, likely as a result of the uptick in spending on both home furnishings and vehicles—both of which are more frequent expenditures for those who own a home, perhaps because they are in a different part of the life cycle than those who rent.12
Table 2.3. Ratio of consumption by age of householder (16 to 24 = 100.0)
Conspicuous |
Inconspicuous |
Other expenditures |
|
16–24 |
100 |
100 |
100 |
25–34 |
88 |
83 |
122 |
35–44 |
75 |
78 |
126 |
45–54 |
69 |
78 |
128 |
55–64 |
61 |
82 |
124 |
65–74 |
52 |
91 |
113 |
75 and older |
19 |
95 |
104 |
Table 2.4. Ratio of consumption by race/ethnicity of householder (non-Hispanic white = 100.0)
Conspicuous |
Inconspicuous |
Other expenditures |
|
Non-Hispanic white |
100 |
100 |
100 |
African American |
89 |
82 |
95 |
Asian and Pacific Islander |
86 |
68 |
94 |
Hispanic |
104 |
69 |
96 |
Other |
98 |
86 |
98 |
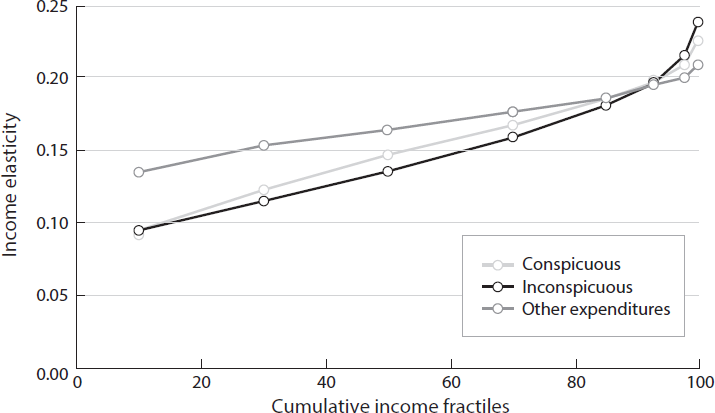
Just like Heffetz and Charles, we find that the more affluent individuals are, the more they spend in absolute dollars on conspicuous consumption (but again, lower income groups are devoting greater shares of income to socially visible spending).13 More interesting, however, higher income is more closely associated with spending on inconspicuous consumption than conspicuous consumption. Using our income elasticity measure, we generated Engel curves for conspicuous consumption, inconspicuous consumption, and other expenditures. An Engel curve allows us to see how spending on particular items varies by income level and changes in income. The most famous example, which Ernst Engel found himself, is that lower income families tend to spend a greater share of their household budget on food, and as a household acquires more income, their food budget does not increase in lockstep. Because food is essential, regardless of income, a household must devote a certain amount of money toward acquiring it. Yet, we only need a certain amount of food, thus we don’t start spending significantly more just because we become richer. Even if we start buying organic produce or imported foods, luxury food items compared to basic groceries does not present the same price disparity as that between other goods, like that between a Porsche and a Honda. Our study of household expenditures on basic necessities (e.g., housing and food) corroborates Engel’s initial finding. For our Engel curves, we were interested in what a particular income group would do if they received a 1% increase in income. We find that the greatest income elasticities occur in the top 1% group, but that they are most likely to devote greater amounts of money to inconspicuous goods than to visible, status goods. For the top 1%, a one percent increase in income results in a 0.23% increase in conspicuous spending and a 0.24% increase in inconspicuous spending (along with a 0.21% increase in expenditures overall). In this example, the top 1% has little need to spend on other expenditures, say extra food, utilities, and so forth that a lower income family might pay for with extra income. Thus, for a top 1% household, increases in income enable more gratuitous rather than necessity spending. If basic needs are already met, why not buy the new car/watch/boat/etc. or hire a babysitter for longer hours or a gardener to do some more landscaping? These percentages may seem small, but they have a big impact for the already well off. People in top income brackets often get much more substantial raises (or bonuses, more likely) than a 1% increase, so for example, a 4% increase in income results in a 1% increase in both conspicuous and inconspicuous spending.
Contrast these results with that of those in the 20th percentile: For every 1% increase in income, they spend a very small, almost negligible amount on additional conspicuous or inconspicuous consumption (0.09%) but almost 0.14% more on other expenditures like food and shelter. In fact, until we arrive at the top 10%, 5%, and 1%, all income groups who receive an increase in income spend more on other expenditures that are not inconspicuous or conspicuous, but more essential (see figure 2.2).
Figure 2.2. Income elasticity by income group. Data source: Consumer Expenditure Survey, Bureau of Labor Statistics.
We also find that for most income groups, income elasticity follows a predictable and linear line, except at the top, where small increases in income result in more dramatic increases in non-necessity spending. This finding suggests that for most income groups, small increases are helpful for day-to-day bills and cost-of-living expenses but do not suddenly move them into more gratuitous spending—for the rich, these marginal increases can be immediately channeled into extra holidays, shoes, or landscaping, and other goods or services that are not fulfilling a basic need (figure 2.2). A poorer family might use that same 1% income increase to buy more groceries or pay off a bill. Heffetz found similar results in his Engel curves looking at a variety of different consumer goods, specifically cars, air travel, education, and jewelry, all of which are purchased at disproportionately high rates for those in the top income groups.
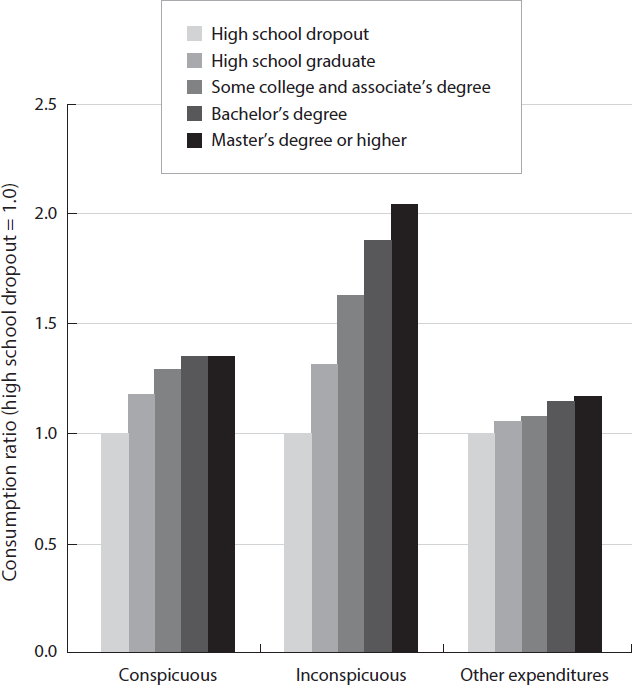
Outside of income level, education is the biggest predictor of conspicuous and inconspicuous spending. Those with a bachelor’s or master’s degree or higher (e.g., MD, JD, or PhD) spend 35% more on conspicuous goods than high school dropouts, almost 20% more than high school graduates, and 5% more than those with some college and/or an associate’s degree. Because this analysis controls for income, the story is not simply one of education providing the income for such spending patterns. Rather, as Heffetz suggests, those with particular education backgrounds may be in social contexts that value conspicuous spending more, and education is a good proxy for “permanent income,” that is, what they should expect to make ongoing for their lives. This latter point explains why more highly educated people might spend more on a car, house, or a new watch—their economic situation looks generally more stable. Even more profound, the more education one has, the more one spends on inconspicuous goods. Those with a master’s degree spend over 100% more than high school dropouts and about 15% more than those with just a bachelor’s degree. The increases in spending in these groups are leaps rather than increments (while other expenditures increase more linearly). Even by just finishing high school, one spends 32% more on inconspicuous consumption than if one drops out (see table 2.5 and figure 2.3). I speculate that underpinning these spending patterns is not just social contexts where visible goods matter but also the nature of jobs associated with higher education levels. A medical doctor, lawyer, or consultant (for example) may work longer hours, and thus the investment in a housekeeper, gardener, nanny, or any other good or service makes home life easier. They work long hours and often get paid handsomely for doing so, which allows them to outsource housework. (Contrast their 60-hour weeks with those of a service worker who works just as many hours but at a fraction of the income level and thus doesn’t have the option of hiring a housekeeper or gardener.) Embedded in these occupations is higher permanent income (doctors and lawyers are rarely in the constant state of concern as to whether they will be fired or not, and while financiers do run that risk, they tend to get paid enough to offset such concerns). Thus, the combination of higher income with increased hours may influence these types of spending patterns.
Table 2.5. Ratio of consumption by educational attainment of householder (high school dropouts = 100.0)
Conspicuous |
Inconspicuous |
Other expenditures |
|
High school dropout |
100 |
100 |
100 |
High school graduate |
118 |
132 |
105 |
Some college and associate’s degree |
129 |
163 |
108 |
Bachelor’s degree |
135 |
188 |
114 |
Master’s degree or higher |
135 |
204 |
116 |
Figure 2.3. Educational attainment of householder. Data source: Consumer Expenditure Survey, Bureau of Labor Statistics.
Where we live, in terms of geographic region and city size, and whether we live in a city or not, also influences how we spend. I will delve into the specific distinctions across cities in a later chapter, but broadly speaking, those who live in the northeast are the least likely to spend on conspicuous items and those in the south and west are the most likely to spend on status goods (see table 2.6). Those who live in western states (such as Arizona, California, Nevada, New Mexico) spend the most in both categories (in actual dollars), and also on other expenditures. In certain parts of all of these states, housing prices are much lower than on the East Coast, which suggests people may have extra income to devote to spending in other areas. People in these regions also prioritize conspicuous consumption more generally than those in other parts of the country. City size also matters: People living in bigger cities tend to spend more on conspicuous goods, inconspicuous goods, and other expenditures than those in smaller cities. In fact, they spend on average 15% more on the first two categories and 20% more on expenditures in general. Part of this may be explained by cost of living—big cities like Los Angeles and New York are expensive places to live. In addition, wealth—both the profit generation of huge firms, banks, and film studios, and those who work in these high-paying industries—tends to be concentrated in big cities. In general these cities are dense, vibrant, and full of social events that drive the purchase of visible goods and offer the context where they are valued. When it comes to conspicuous consumption, smaller cities (those with populations of 125,000–329,000), by contrast, spend hardly more than those metros with fewer than 125,000 people (see table 2.7). With respect to inconspicuous spending, one explanation for the higher expenditure level might be the nature of jobs in bigger cities that lend themselves to the benefits of inconspicuous services. Major metros are home to a great number of professionals who work long hours and earn incomes that would lend themselves to inconspicuous consumption. The offerings available in bigger cities present another reason for increased spending there, including, for example, an abundance of labor-driven goods and services, whether nanny agencies or housekeeping firms, museums and opera houses, and those repair shops for fixing high-end watches and jewelry. Big cities generate more profits and house some of the richest people in the world, from Russian oligarchs to Hollywood moguls to Wall Street hedge fund managers. This confluence of hyper-wealth and productivity in big cities translates into lots of spending power and as a result, the retail stores and service industries set up shop there and profit from such spending.
Table 2.6. Ratio of consumption by Census region (South = 100.0)
Conspicuous |
Inconspicuous |
Other expenditures |
|
Northeast |
93 |
102 |
102 |
Midwest |
99 |
106 |
99 |
South |
100 |
100 |
100 |
West |
100 |
119 |
108 |
Table 2.7. Ratio of consumption by metropolitan area size (less than 125,000 = 100.0)
Conspicuous |
Inconspicuous |
Other expenditures |
|
More than 4 million |
114 |
115 |
119 |
1.2–4 million |
110 |
112 |
112 |
0.33–1.19 million |
112 |
112 |
108 |
125–329.9 thousand |
106 |
112 |
105 |
Less than 125,000 |
100 |
100 |
100 |
As we have seen, over the past decade and a half, income level increasingly separates how we spend and subsequently how we live and the fortunes of future generations. The wealthy of the twenty-first century are far savvier and more sensible than Veblen’s leisure class—they are channeling money into education, and goods and services that save them time and provide a better quality of life. Yet, like Veblen’s rich, today’s top income groups take part in conspicuous consumption, too.
But conspicuous consumption is not the leitmotif of just the wealthy; it is omnipresent and, in fact, one might argue its democracy has made it so accessible that other income groups may choose to spend on status goods rather than on things that may shape their and their children’s well-being in the long term. But we must also consider that those inconspicuous goods are far more expensive and getting more so each year. Those who are devoting more of their money to status goods and less to college fees may not even have the option of the latter. Say, for example, you have an extra $100. You can buy a handbag, a pair of shoes, or some electronic equipment. What that money won’t do is make even a dent in a $50,000 tuition bill or an annual health insurance premium. One could argue that every dollar counts (this is the old adage put forth by many a father lecturing on the value of saving and compounding interest). But consider the psychology underpinning how and why we spend: The shoes or iPhone accessory provide instant gratification, as does being able to actually pay for college tuition for those who can. But being able to devote only a small amount of money toward something that costs so much (and thus still remains unattainable) doesn’t really offer any benefits or satisfaction. So for some, the iPhone case offers more gratification than the small contribution to the tuition bill because the latter is simply too far out of reach to even consider.
Wealth is only part of our understanding of why we spend what we spend. Our consumption is influenced by our youth (or loss thereof), our relationship status, whether we have an MD or an associate’s degree or neither, and whether we live in a big city or a small town. Multiple factors shape our desire for status, or our lack of interest in conspicuous consumption. Those who conspicuously consume are not always the same ones who inconspicuously consume (except the wealthy and the educated, who do both in droves). Regardless, what we spend and how we spend matters. Much of our consumption is linked to who we want to be and to our values—not all conspicuous consumption should be judged. Some forms of conspicuous consumption, like that with regard to race, may be an effort to thwart discrimination. For many of us, consumption is about fitting in.
Inconspicuous consumption, however, is the most consistent distinguishing spending practice of the elite, and is what truly separates them from everyone else. In the next chapter, I will look more closely at how inconspicuous consumption, which is often invisible and reveals status but often only to one’s peer group, is perhaps the most pernicious divide between the elites and the rest. The practices of inconspicuous consumption, which can be both incredibly expensive but also nonpecuniary, offer a freedom and mobility that conspicuous consumption can’t buy.