CHAPTER ONE
A Story of Success:
Healthy People in a
Healthy Economy
ED WHITLOCK, a seventy-three-year-old marathoner, broke his own record in September 2004 at the Toronto Waterfront Marathon.1 He ran the distance of 26 miles 385 yards in 2:54:49, placing twenty-sixth among 1,690 finishers and setting the world record for runners over seventy years of age. Whitlock has company. Among the United States’ 400,000 marathon finishers in 2003, approximately 500 were older than seventy compared with about 100 a decade earlier. The National Institutes of Health has interesting ideas about why older people can achieve greater health and fitness gains from exercise than previously thought. In fact, health statistics are consistent with Whitlock’s performance: They show that the chances of living a long, healthy life are steadily improving.
Increasing longevity, the most basic measure of health, is a phenomenon in the United States that is apparent at almost any age. Rightly or wrongly, sixty-five is the commonly accepted line between middle age and old age. In 1935, when the Social Security system was established, life expectancy of males and females at age sixty-five was twelve and thirteen years respectively. But life expectancy for men at age sixty-five has increased by 35 percent since then (to sixteen years in 2004), and by 43 percent for women (to nineteen years in 2004).2 In fact, male life expectancy at age sixty-five has been growing by about one month per year for the past thirty years or so. Every year, new cohorts of Social Security and Medicare participants live one month longer, on average, than the previous year’s groups.
A related point is that the fraction of male Medicare enrollees aged sixty-five or older who are chronically disabled declined by 20 percent from 1984 to 1999.3 In other words, not only has longevity increased, but individuals aged sixty-five and older are healthier than in the past. In effect, they are “younger” than were people of the same age decades earlier.
Increasing life expectancy is a worldwide phenomenon, and many population experts believe that longevity in the United States is likely to increase more rapidly than the Social Security Administration’s current predictions. The fact that life expectancy in Japan is approximately four years higher than in the United States indicates that further progress in the average length of life of Americans is perfectly feasible.
Venture capitalists and pharmaceutical companies are betting on this trend by investing billions of dollars in biogenetics. Many in the medical community share their optimism. Scientific research and development have produced an increasing array of medications, medical procedures and instruments, and an understanding of human health, all of which have made dramatic contributions to the length and quality of life. There is every reason to expect that these developments will continue and that many of the investments being made will pay off.
Improvements in health include a sharp decline in deaths and disabilities caused by heart disease over the last two decades or so. Primary credit for this decline goes to new drugs developed to control high blood pressure and high cholesterol. If heart disease continues to decline, and if significant progress is made in the treatment of cancer and Alzheimer’s disease, the average length of life will increase, quite likely by an amount larger than that reflected in official government projections.
Health education and economic incentives have contributed to these improvements in health and longevity. As smoking has been linked increasingly to a wide variety of debilitating diseases, antitobacco campaigns have been launched, and cigarette taxes have risen steadily. The result is a sharp fall in the number of men aged sixty-five and over who smoke cigarettes. The number of female smokers over age sixty-five, traditionally much smaller than that of male smokers, has also declined in recent years.4
On the other hand, obesity presents an increasing health problem for children and adults, and some population experts believe that life expectancy gains may slow as obesity takes its toll. The percentage of men aged sixty-five to seventy-four who are obese has jumped from 10 percent to 25 percent over the last forty years, and the picture is even more dismal for women.5 The adverse impact of obesity on health has been somewhat muted by new medications for high blood pressure, excessive cholesterol levels, and diabetes, yet it is still a serious national health problem.
Nevertheless, the overall picture in the United States is one of improving health for individuals in all age-groups. This is borne out by the positive self-assessments gathered from the general population. For example, two-thirds of non-Hispanic whites who are eighty-five years and older describe their own health as good to excellent, and other groups are nearly as optimistic.6
Today men and women in the United States live longer and healthier lives than at any time in the past. The clear expectation is that this positive trend will continue. Hand in hand with such success comes the need to manage retirement and health care policies responsibly.
The Strong Economy of the United States
An aging and healthy population will cause the output of the U.S. economy to shift in the direction of the elderly. How can this change be managed? Think of the U.S. economy as a large pie, and consider the problem of dividing that pie between those who are hard at work producing it, today’s labor force, and those who helped create it but no longer contribute to its size and composition, retirees. Division is always difficult. Initially most people seem to focus instinctively on financial systems—entitlement programs—that accomplish this division automatically. But consider a different approach. The most important objective should be to ensure that the size of the pie continues to grow as time goes on. An ever-expanding pie eases the tough choices of allocating shares between today’s labor force and those who have retired.
A large and growing pie requires a substantial workforce with a high and rising rate of productivity. So the first step in addressing the issues posed by the prospective costs of income for retirees and health expenditures for everyone, most especially for those who have retired, is to identify the strengths and weaknesses of the U.S. economy and make suggestions for their improvement. The story begins with the stability of the economy.
Over the last 150 years the U.S. economy has become increasingly stable. The economy was in recession nearly 45 percent of the time during the last half of the nineteenth century, 33 percent in the first half of the twentieth century, and 16 percent in the last half of the twentieth century. In the post–World War II period, the occurrence of down quarters has diminished from sixteen in the years between 1946 to 1965 to fifteen from 1966 to 1985 to just five since then. Meanwhile, even as the economy has grown to Herculean size, its real rate of growth has continued to be robust. In the last twenty-five years, the real growth rate averaged 3.1 percent, maintaining the average level of the post–World War II period. The slowing growth rate in our population, hence in labor force expansion, will cause economic growth to moderate somewhat in the years ahead. Nevertheless, this impressive progress gives a sense of what is possible in the future. For example, if the average growth rate of the last twenty years prevails for the next twenty, the present U.S. economy of $13 trillion will grow to nearly $25 trillion.
The last twenty-five-year period has also been one of relatively stable prices, with the inflation rate being substantially below 4 percent on a sustained basis. In post–World War II history, only the period beginning around 1950 is comparable, although its rate of economic growth was lower than that of the last quarter century. Moreover, inflation soared from the late 1960s through most of the 1970s, and by 1980 it was running at about 14 percent, a rate that brought about the sustained effort to control inflation that has been at work for the last twenty-five years. The resulting predictability of price levels has contributed to investment and thus to economic growth. The lesson is clear: A monetary policy that is compatible with a low, stable rate of inflation is essential to a healthy and growing economy.
Changes in the structure and level of taxation have also been important contributors to a healthy economy. Top marginal tax rates declined dramatically between 1960 and 1986, as shown in chart 1.1. Note that until 2003 the top marginal tax rates on ordinary income and dividends were one and the same. Today it is hard to imagine that as recently as 1961, when President John F. Kennedy took office, the top marginal rate of taxation was 91 percent. Kennedy boldly initiated rate reductions that fully materialized during the Johnson years, bringing the top rate down to 70 percent, although it increased again because of the surtax to finance the Vietnam War in the later years of the Johnson administration. The rate subsequently declined again to 70 percent and stayed at that level throughout the Nixon, Ford, and Carter administrations.
Then came the Reagan years. Early in his presidency Ronald Reagan persuaded Congress to reduce the top tax rate from 70 percent to 50 percent. Then, in 1986, in a dramatic, bipartisan piece of legislation, revenues were increased by stripping loopholes and preferences out of the tax law and then commensurably decreased by reducing the top marginal rate to 28 percent. The result was that the 1986 tax reform was revenue neutral. The top marginal tax rate inched back up again by 3 percentage points under President Bush I and by 8 percentage points under President Clinton, but it was reduced to 35 percent in President Bush II’s first term. In addition, the top rate of taxation on dividends and capital gains was reduced to 15 percent. The relatively prosperous period that followed was due, in large measure, to the efforts by Presidents Kennedy, Reagan, and Bush II to stimulate the economy with tax rate reductions. In fact, it is quite likely that an unsung hero of the expansion during the 1990s was the bipartisan 1986 Tax Reform Act.
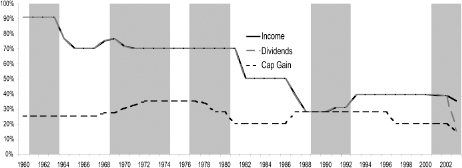
Chart 1.1 The Decline in Federal Tax Rates
The Nobel laureate Edward Prescott found an inverse correlation between tax rates and labor supply through his analysis of cross-country comparisons.7 It is fascinating to see that many emerging economies are adopting low rates of taxation or a flat tax based on their observation that low rates help spur economic expansion.
President Bush II’s tax cuts have been the subject of considerable debate. Structured to expire on certain dates unless Congress takes contrary action, these cuts still leave the top marginal tax rate 7 percentage points above the level bequeathed by President Reagan and his bipartisan majority, and loopholes and preferences have reappeared. These days it is rare to hear a political figure argue for the return of rates to pre-Reagan levels. On the contrary, most discussion focuses on keeping the rates low and simplifying the tax structure in the spirit of 1986. Certainly a key consideration in any debate on tax reform should be the potential impact on saving and investment, essential ingredients for a strong economic expansion.
The U.S. economy has also benefited from its flexibility, dynamism, and creativity. Flexibility, one of its most important attributes, is apparent in the movement of people into, out of, and within the labor force; in the creation and expiration of new businesses; and in the ebb and flow of the largest businesses. The late Joseph Schumpeter called capitalism a system of creative destruction, and this is nowhere more evident than in the flexibility of the U.S. economy.8
Examples of flexibility abound. For instance, the government reports the net number of jobs gained or lost each month. Usually the number is positive, reflecting the expansion of the economy. But that number obscures the reality of the high rate of job changes within the mix. The gross number of jobs gained and lost has ranged between six million and nine million per quarter over the past ten years.9 For example, in 2005 just over twenty-nine million jobs were lost while more than thirty-one million were created.10 The reported net figure of two million did not begin to describe the huge mobility within the American economy. This flexibility in the U.S. labor force is one explanation for the United States’ ability to adapt so readily to new developments.
The large mobility in the labor force is likely to continue, and perhaps even increase, in the dynamic economy of the future. Therefore, it is clear that in any reform of the programs providing income for the elderly and access to health care for everyone, benefits should be associated with individuals rather than with institutions so that workers can change jobs without sacrificing important benefits.
The U.S. business picture is not only flexible but also dynamic. Over the last fifteen years, the number of new businesses created and the number that expired per year have ranged between five hundred thousand and six hundred thousand.11 The net figure is usually positive, but the real point is the continuing impetus to develop new enterprises that help the U.S. economy maintain a competitive edge, since many grow and challenge existing companies.
Big businesses are subject to the same kind of competitive pressure. In May 1896 the Dow Industrial Average was made up of American Cotton Oil, American Sugar, American Tobacco, Chicago Gas, General Electric, Distilling & Cattle Feeding, Laclede Gas, National Lead, North American (a holding company), Tennessee Coal & Iron, U.S. Leather, and U.S. Rubber.12 Only one, GE, is still recognizable. Of the companies listed in the Fortune 500 in 1960, quite a few were missing from the list by 1970, 1980, or 1990. For example, 306 of the companies listed in 1960 were no longer there in 1990. Even large companies are subject to mergers, acquisitions, and competitive pressures that can reduce their relative importance in the business world, and the United States is more willing than many other countries to encourage this kind of dynamism. Despite occasional relapses into a bailout mentality, as seen in the cases of Lockheed and Chrysler, the dominant theme is to allow competition, including foreign competition, to operate and cleanse the system of companies that have lost their competitive edge. Opportunities for new companies arise in large part because existing companies are permitted to fail. This is a prime illustration of Schumpeter’s concept of creative destruction, and it is a powerful reason for the productivity of the U.S. economy and labor force.
This flexible and dynamic U.S. economy is also creative. Many of today’s new industries did not exist thirty years ago. Consider the emergence of the cell phone, the widespread use of personal computers, the Internet, the hybrid car, satellite TV, digital cable, arthroscopic and laser surgery, and nanotechnology, among a multitude of other new developments. Research and development activity has thrived in the United States and many other countries throughout the post–World War II period. In 2002, for example, total R & D spending in the United States was about 2.6 percent of GDP, well above the level of spending by most Organization for Economic Cooperation and Development (OECD) countries. Patent activity is another important indicator of innovation, and patent applications, which have always been strong, have nearly tripled over the last ten to fifteen years. The number of patents issued shows a lag as the Patent Office struggles to keep up with the flood of applications. Venture capital activity is still another gauge of innovation, and U.S. activity as a percentage of GDP is large compared with other countries. The United States invented venture capitalism, got a head start in it, and has never looked back. Once again, given the size of the U.S. economy, the total money devoted to venture investment in the United States dominates that of any other country.
International Trade and the Balance of Payments
The United States, in another largely positive development, has become more heavily involved in the international economic system throughout the post–World War II period. Wise statesmen at the end of that war reflected on the damage done to the global economy and international relations by the wave of protectionism that had swept the world in the 1920s and 1930s. They set out to design a different economic system that, through a series of negotiations, would gradually reduce tariff barriers and other impediments to trade. The negotiations succeeded brilliantly, and the world is now much more open and much more prosperous than a collection of relatively closed economies could ever be.
In the United States, exports and imports as a proportion of GDP have grown dramatically, and because the GDP is so large, that growth is even more stunning in absolute numbers. Exports and imports together account for almost one-fourth of U.S. economic output. The United States is heavily involved in the world economy and has benefited greatly from that involvement.
In the last twenty-five years there have been two surges in imports relative to exports, leaving negative balances of trade. By 2006 that deficit had reached more than 6 percent of GDP but has since declined to less than 5 percent of GDP.13 A negative balance of trade is not automatically good or bad. In fact, the numbers represent considerable benefits: Consumers have a wide variety of products to choose from, prices are disciplined by international competition, and many overseas markets are open for the export of U.S. products.
Some Problems
Although in many respects—stable prices and growth rates, low tax rates, and dynamism—the U.S. economy is as healthy as its citizens, there are problems on the horizon. The U.S. rate of saving is by far the lowest of any major country. Personal saving rates have fallen dramatically and by now are essentially at zero. Back in the 1980s the rate was in the 10 to 12 percent range, and in the early 1990s it was still in the 7 to 8 percent range. Certainly one part of the explanation is that the huge boom in home values and asset prices more generally during the past ten to fifteen years has resulted in a dramatic increase in household wealth. People may reason that if their net worth is rising, saving out of their current income is unnecessary. If this is the case, the saving rate will likely rebound as housing prices have leveled off or even declined in many markets and as the rate of increase in other asset values moderates.
The federal deficit is of course an act of dissaving, even though it was running at the relatively low rate of 1.2 percent of GDP in fiscal year 2007. Nevertheless, if the private and public sector saving performances are added together, the result is that saving in the United States is not sufficient to finance this country’s own investments. Fortunately the United States has an attractive investment climate with a relatively low risk/reward ratio. Thus savers in other countries are willing to invest in the United States, allowing the U.S. investment level to remain strong.
Adjustment problems must be faced in the United States and other countries as moderation of this large imbalance of saving and investment takes place. Beyond that, savers from other countries are, in a sense, sending us a message that should ring loud and clear in our ears: Those who save and invest own the assets and the income stream generated by those assets. If Americans saved more, their ownership of assets in the United States or elsewhere in the world economy would be greater and would enhance American claims on the U.S. and world economic pie. The impact on saving should be reflected in any consideration of policies to reform the entitlement programs.
Any examination of the U.S. economy must include the issue of immigration, which has always played an important role in American life. Over the course of its history and the ebb and flow of immigration waves, the United States has learned better than many other countries how to assimilate immigrants into its society. In turn, American culture has been modified and has benefited from the diverse talents and contributions of those who have come to its shores.
Today every country is struggling with the immigration issue. In this age of terror, the visa process requires special scrutiny. Ways must be developed to balance the desire to welcome those who can make a contribution with the need to prevent entrance by those who are a threat. This difficult problem must be dealt with effectively for many reasons, including the ability to attract new citizens who will help sustain the competitive edge of the United States.
The immigration dilemma poses a potentially debilitating problem for higher education. Throughout most of the post–World War II period, the United States has been the country of choice for people from all over the world who were seeking the best in college and especially graduate education. Recent visa rules, however, have prevented many talented foreign students from enrolling in American universities. Their absence underlines the fact that, in many of the demanding disciplines so central to future progress, the United States is unable to produce enough sufficiently qualified Americans to fill the available openings. This problem stems from deficiencies in the K–12 curriculum and demands a concerted effort to improve the foundations of the U.S. education system.

Chart 1.2 Share of Income in Top Quintile Divided by Share of Incomes in Bottom Quintiles Source: Congressional Budget Office, Historical Effective Federal Tax Rates: 1979 to 2003, http://www.cbo.gov/ftpdoc.cfm?index=7000&type=1
Income distribution in the United States is yet another issue with relevance to entitlement programs. Chart 1.2 shows the ratio of the total income of the highest 20 percent of American households to the total income of the lowest 20 percent, both before and after taxes. Since after-tax income is what can be spent, let’s concentrate on that.
The chart shows that the top 20 percent of households had just over six times as much after-tax income as the lowest 20 percent in the late 1970s. By the early 1980s, as the economy moved out of a period of inflationary trauma and as the performance of the stock market improved dramatically, the top 20 percent had gained a substantial advantage, and the ratio has hovered between eight and ten ever since. In the late 1990s this income ratio rose, and it remains at the high end of the range, meaning that on average, the top 20 percent of households have ten times as much after-tax income as the bottom 20 percent.
This picture of the distribution of income is moderated by the considerable movement of earners on the income distribution scale: High earners often drop to a lower level, and many low earners climb to a higher one. The picture is also moderated by the considerable impact of such programs as food stamps, welfare payments, and Medicaid that are directed to those with lower incomes. An important determinant of variations in income is the growing labor market premium for higher education and job market skills. The wages and salaries of those with college educations have dramatically outpaced the earnings of those with only high school educations or less. The country’s goal should not be to reduce the income of the affluent but rather to increase the participation of lower-income households in the overall prosperity of the economy. Task number one in this regard is to improve the quality of K–12 education so that more workers are able to command more value in the job market.
Despite such problems, the U.S. economy is basically a great success story for clear underlying reasons. If these fundamental characteristics can be kept in good shape and if some of the associated problems can be addressed effectively, then the economy will continue to grow. The pie will become bigger and tastier and therefore easier to divide. Furthermore, this larger, expanding economy will play a crucial role in sustaining the success that is now producing longer, healthier lives and a higher standard of living for Americans.