6. Debugging
In this chapter, we will cover the tools in the Visual Basic Editor that you can use to debug your code. Errors are something you’ll encounter when writing code, even if you are an experienced programmer. Logic errors are especially difficult to find because syntactically, there is nothing wrong with the code, but it is just not producing the expected result. You’ll use the debugging tools primarily for logic errors.
In this chapter, we will cover:
- An overview of debugging.
- Setting breakpoints in your code to enter break mode.
- Using the Immediate window to display information from your code.
- Using the Locals window to monitor variables and properties.
- How to use the Watch window to watch expressions.
- Using the Call Stack to trace the flow of code through multiple nested procedures.
Overview of Debugging
A game-changer for me in my early programming career was when I learned how to step through my code in break mode, observe the flow of the program, and what was happening to my variables. If there is one thing you take from this chapter, it should be how to step through your code in break mode and examine what variables are changing and what actions are changing them. This will save you a lot of time in trying to figure out why a procedure is not producing the expected results.
There are generally three types of errors in programming:
Syntax errors
Syntax errors occur when a mistake is made in the syntax. Examples include a keyword entered incorrectly, or a construct being used incorrectly, like using an If
statement without an End If
. Syntax errors are the easiest to identify as you won’t even be able to run the code until you correct them.
The Visual Basic Editor has an automatic syntax checking feature (named Auto Syntax Check
in the Visual Basic Editor options) that can detect and correct some syntax errors as you type your code. Those types of syntax errors generate an error message as soon as you try to leave the line, telling you what the error is an offering some help. Other syntax errors are only detected when you attempt to run the code. At that point, VBA halts code execution and highlights the line that generated the error.
Runtime errors
A runtime error occurs when a piece of code is attempting an operation that is impossible to execute, for example, trying to reference an object that is currently inaccessible, like a workbook that is currently closed. For errors like these, you can provide error handlers in your procedures to catch the error, display a meaningful message to the user, and gracefully exit the procedure.
Logic errors
Logic errors occur when there is nothing wrong with the syntax, but the application does not produce the intended result. As mentioned earlier, these errors are the difficult ones to find because the syntax is valid code, hence VBA will not halt the execution of the code. The code will run as normal but simply not produce your expected result. This type of error is caused by a logic error in one or more of your statements. Often, the only way to identify the source of the error is to put a breakpoint in your code and step through it line by line to observe the values of your variables and expressions at different points in the code.
Debugging Tools
VBA provides a wide array of debugging tools that can help you to find and correct errors in your code. You can use debugging tools like breakpoints, procedure stepping, watching variables, and the call stack to see the order of procedure execution.
The debugging menu items can be found under the Debug
menu of the Visual Basic Editor. There is also a separate Debug toolbar that you can display by right-clicking the Visual Basic Editor menu bar and selecting the Debug
checkbox from the pop-up menu.
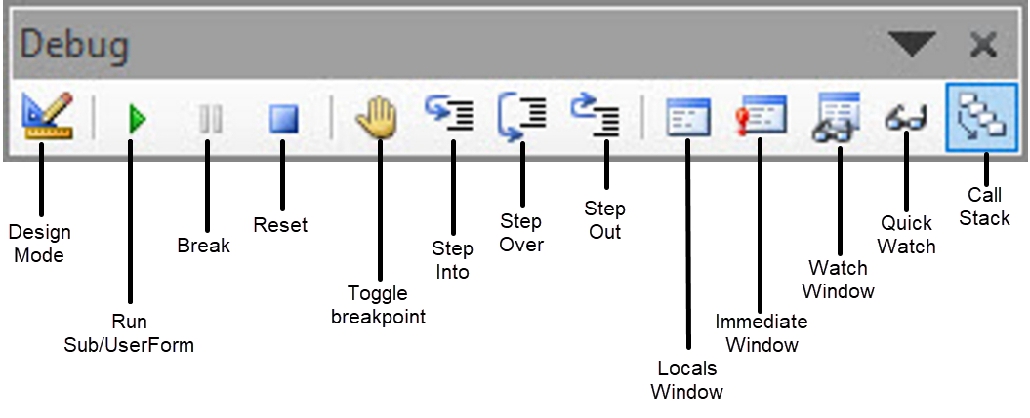
The figure below shows the buttons on the Debug toolbar in the Visual Basic Editor.
Tip
: The Debug menu initially displays as a floating menu, but you can dock it to the Visual Basic Editor menu bar by dragging it over the space to the right of the default menu commands.
Break Mode
Break mode pauses code execution at the line where you have inserted a breakpoint. At this point, the program is still running but it is paused. While in break mode, you can examine the current values in the variables, properties, and expressions that are in scope. You can also choose to step through your code one line at a time, to examine the program flow and how any variables and properties are being changed. This is one of the most effective ways of quickly identifying logic errors in your code.
In break mode, the following actions occur:
-
Execution is paused
-
When VBA encounters a condition that causes it to enter break mode, it will stop code execution and switch control to the Visual Basic Editor.
-
Variables and properties are preserved
-
As the code is still effectively running but just paused, the variables and properties are preserved. Hence, you can check the current values of variables, properties, and expressions. You can change the values of variables and properties to observe the effect on other objects. You can also call other procedures.
You can enter break mode by doing the following:
You use this to pause the execution of an application in a specific line in your code.
When you use one of the Step
commands, executing starts but then VBA enters break mode at the beginning of the procedure. This allows you to step through the code using one of the Step
commands.
Setting a Breakpoint
You can set a breakpoint by either using the Breakpoint
feature or using the Stop
statement in your code. When code execution reaches that point, it will enter break mode.
To set a breakpoint in your code, do the following:
- Position the insertion point anywhere in the line where you want execution to be paused in the procedure.
Note
: You can’t select a line that’s a comment or a variable declaration as you can’t put a breakpoint on those lines.
- On the Visual Basic Editor menu bar, click Debug
and select Toggle Breakpoint
from the menu (or press F9).
–or–
Click next to the statement on the Margin Indicator Bar (if visible).
–or–
On the Visual Basic Editor Debug
toolbar, click the Toggle Breakpoint
button.
To clear a breakpoint, do the following:
Place the insertion point anywhere in the line in the procedure containing the breakpoint and repeat any of the commands described above for setting a breakpoint.
–or–
To clear all breakpoints in your project, on the Debug
menu, click Clear All Breakpoints
(or press Ctrl
+Shift
+F9
).
Note
: Breakpoints, like the ones created above, are not preserved when you save and close the project. If you want breakpoints that remain available when you close and reopen your project, use the Stop
statement anywhere in the code where you want to enter break mode. Just remember to remove all Stop
statements when you’re done with debugging.
Stepping Through Code
After you've entered break mode using one of the methods described above, you can step through the code using the Debug toolbar in the Visual Basic Editor. This method enables you to execute one line of code at a time and observe the results. If you are new to programming, this is particularly useful as you can observe the program flow and better understand how programming constructs like conditional statements and loops work.
The following section describes the three Step
buttons on the Debug toolbar and how each one works.
-
Step Into
-
This button executes the code, one line at a time. When you click the Step Into button, it will highlight the next line to be executed. When you click the button again, it will execute that line, and then highlight the next and so on. Note that, you can just click on this button to start the process of stepping through the code without needing to set a breakpoint.
-
Step Over
-
This is like Step Into
, but when execution comes across a statement that contains a call to another procedure (i.e. a nested procedure), it executes the procedure as a unit and then steps to the next statement in the current procedure. So, code execution does not branch into the nested procedure, rather, it stays within the current procedure. Use this if you have a lot of nested procedures in your code and you don’t want the debugger to step into them.
-
Step Out
-
The Step Out command executes the remaining lines in the current procedure. If the procedure was called from within another procedure, then execution goes back to the calling procedure.
To step through your code one line at a time, using Step Into
, do the following:
- Enter break mode, using one of the methods described previously.
- On the Debug
menu, click Step Into
. Continue to click the Step Into
button to run each line of code.
–or–
- Press F8 to run the next line of code. Continue pressing F8 to run the code, one line at a time.