4
Applying Behavioral Insights
There is no shortage of guides that propose how behavioral insights should be applied in practice. Most include a common set of principles and activities to identify the behavioral dimensions of problems, devise potential solutions, and evaluate their impact. This chapter gives a succinct account of these core features, rather than offering a complete “how to” guide. Our focus on essential knowledge means that we do not review all the relevant literature or give detailed explanations of how to conduct site visits. A useful starting point for a more in-depth treatment is the OECD’s BASIC toolkit.1
To structure this account, we will walk through some work that Elspeth did on job seeking. This project was developed with a UK unemployment center (Bedford Jobcentre) and focused on increasing attendance at recruitment events by those looking for work. We tested whether attendance could be influenced by changing the wording of a standard text (SMS) invitation sent to prospective attendees. As it turned out, the message that performed the best more than doubled attendance.
We chose this example because it was a fairly straightforward piece of work, making it easy to draw out the key lessons. It also fits within a larger policy area—reducing unemployment—which means we can zoom out and show the wider context at key moments. Finally, the project has also been published in an academic journal, where readers can learn more about it in more depth.2
This chapter presents ten steps:
- 1. Establish the scope.
- 2. Break the challenge into addressable parts.
- 3. Identify the target outcome.
- 4. Map the relevant behaviors.
- 5. Identify the factors that affect each behavior.
- 6. Choose the priority behaviors to address.
- 7. Create evidence-led intervention(s).
- 8. Implement the intervention(s).
- 9. Assess the effects.
- 10. Take further action based on the results.
We present this process as linear in order to make it clear. In reality, there are feedback loops between these stages, as we revisit previous decisions in the light of new knowledge. We flag where those iterations are likely to occur.
Step 1: Establish the Scope
We start with the big picture: the overall goal of the work. In this example, that overall goal is to reduce unemployment. We recognize that starting with the overall goal is a top-down approach; it could be possible to begin at a micro level, looking at individual behaviors and working out goals from that level up. In those cases, we would move more quickly through these initial scoping steps.
With the overall goal in mind, we then need to identify whether we are approaching this goal at a tactical or strategic level. As we discussed in chapter 1, some projects are tactical, dealing with changes at an operational level or within only a limited part of a system. Others allow for intervention at a more strategic level, opening up opportunities to alter the fundamental policy or structures for addressing an issue, and perhaps changing a whole system. While the exact opportunities are unlikely to be clear at this stage, we want to make this judgment because using behavioral insights is a pragmatic approach: we do not want to spend a lot of time pursuing options that are not “on the table.”
One way of establishing the scope is to identify the kinds of interventions that are likely to be feasible. To do this, we suggest five questions, based on the framework from chapter 3, that help to define the parameters of the work more tightly. These questions may be easier to answer in parallel with completing Step 2. The questions are:
- 1. Can you change the fundamental rules that govern the system, such as regulations, laws, or policies?
- 2. Can you change the incentives that motivate action, such as the social or economic costs and benefits of certain behaviors?
- 3. Can you change the information provided?
- 4. Can you change the environment in which decisions are made (e.g., the space in which certain activities are completed)?
- 5. Can you change the process actors go through, for example, removing or reducing barriers to progress?
In the example we follow through this chapter, the scope was clearly in the tactical realm because the work had to be completed quickly, without additional resources, and in one individual employment center within a larger system. The modes of intervention were also constrained since the commissioning partner only had control over the employment center processes, environment, and information. By determining these factors up front, we were able to focus during Steps 2 through 6 on identifying elements of the problem where the desired behaviors could be achieved with the interventions available.
The tactical nature and constrained scope of this example allow us to give a clear and clean account of the process. A tactical example is also likely to have the widest applicability. We have found that most organizations have at least some tactical opportunities to apply behavioral insights quickly and effectively; in contrast, opportunities for strategic interventions tend to vary more by context (e.g., only governments can regulate). Nevertheless, in Step 10 we also consider an example from our broader work on labor markets where the scope was strategic in nature and most modes of intervention were possible. In cases like this, Steps 2 and 3 are likely to take much longer because they are essential to narrowing the focus.
Result of this step: We confirmed that this work was tactical in scope, and interventions would likely be limited to changing the information, environment, or processes in the unemployment center we are working with.
Step 2: Break the Challenge into Addressable Parts
Behavioral insights may be applied to problems that are complex, sprawling, and produced or solved by many actors. In order to achieve the overall goal of reducing unemployment, we first need to identify the basic conditions for achieving that goal and the actors and actions that generate those conditions. A simplified example of this unpacking process is shown in figure 6, which should be read from left to right.
By getting more specific about who does what, we can better assess the opportunities for intervention. For example, as shown in figure 6, only a few actions can be initiated by any individual unemployed person. On the other hand, national governments can make wide-ranging structural changes to employment law, the benefits they offer to those out of work, or the regulations businesses follow when hiring. While behavioral insights can complement such changes, they are often slow, expensive, and politically loaded. Compare this to an individual unemployment center trying a new way of communicating what skills the local labor market needs, or an employer tweaking its application process to prevent its recruiters from introducing bias. The possible changes vary greatly in terms of their expected impact and feasibility.
We can then apply the limited scope established in Step 1 to see that by focusing on unemployment center processes, we are operating in the bottom right-hand corner of figure 6. We then assessed which opportunities were most promising in terms of feasibility and likely impact on the overall goal. We discuss these impact and feasibility criteria in more detail later, since they are useful at various stages of the process. Our conclusion was that better connecting of people to available jobs was the most promising opportunity.

Figure 6
Result of this step: We chose to focus on the way in which the unemployment center connected people to jobs.
Step 3: Identify the Target Outcome
In this step we need to work out the best way to measure progress toward reducing unemployment, based on our scoping in Steps 1 and 2, the data available, and the time scale we are operating on. In this case, since we focused on how the unemployment center connects people to jobs, we needed to find a reasonable measure of that action.
Unemployment centers connect jobseekers to jobs in many ways, but the project team’s analysis suggested that one route was particularly promising: mass-recruitment events. These were events put on by the unemployment center in partnership with a local employer (a new supermarket or factory, for example) that needed to fill many vacant roles quickly. The events tended to be successful at getting people into work, and therefore the center invested in developing relationships with employers, staffing the events, and coaching its clients during applications. Ensuring that jobseekers attend the events in the first place is obviously crucial. Prior to the event, the unemployment center identified which candidates were eligible and sent them an SMS invitation to attend. However, despite the high likelihood of getting a job, only around 10 percent of eligible applicants typically attended.
The rate of attendance at mass-recruitment events among invited jobseekers had several features that made it a good target outcome. Attendance was a behavior that had a clear link to the overall goal, since the events were often effective at helping people into work. This target outcome was also relatively specific: the group involved was well defined and there was consensus on how attendance was defined and measured. (For some outcomes, we may also define the time period during which we aim to achieve the target outcome.) Moreover, the desired behavior was already being reliably recorded by existing systems, minimizing costs and uncertainty. Finally, achieving movement in the target outcome seemed possible. Not only was the existing rate of attendance low, evidence indicated that most jobseekers were motivated to find work, making it plausible that relatively small changes (say, making it marginally easier to attend) could harness this motivation and result in change.
Building on this point, the next step is to determine how much change in the target outcome would constitute success. The parties involved in the intervention need to agree early on a “good enough” improvement. At its simplest, this can be a question of cost–benefit analysis: what level of improvement would justify the budget available for an intervention? However, often the aspiration is greater than this basic requirement. In unemployment policy, for example, many governments have highly ambitious targets for national employment levels that far exceed the threshold at which benefits surpass costs.
But what aspirations are realistic? To answer this question we need to consider the existing evidence. For example, if the ambition is to increase local employment rates by 10 percent, yet the most effective existing interventions only achieve a 1 percent increase, then expectations should be readjusted or the project reconsidered. By setting these expectations early, we provide an anchor point for each step of the process: a way to check back against the original ambition.
For this project, we collectively determined that moving from 10 percent to 15 percent invitee attendance (that is, a 50 percent increase) would be a reasonable target. Such an increase struck a balance between what was needed to justify the investment of effort and what, based on a review of similar interventions, we considered to be a realistic change. This target became more specific as we gained more information, but the basics remained stable.
Result of this step: Our target outcome is to increase the rate of attendance at mass-recruitment events among invited jobseekers from 10 percent to 15 percent.
Step 4: Map the Relevant Behaviors
Now we need to understand what behaviors produce the outcome (attendance at recruitment events). In this case, that means gathering more information about the recruitment events in question, how they come about, how jobseekers are made aware of them, and any other relevant contextual information. The tools for finding this information include reviewing previous research on the topic; using qualitative research approaches such as interviews, observations, focus groups, and experiencing the process firsthand; and employing quantitative methods such as surveys and data analysis. As noted, we cannot explain these tools in depth here.
We need to consider the strengths and weaknesses of each tool and where the gaps in our understanding are. For example, if we already have some initial conclusions about user experience based on the feedback about a service, we might seek to validate those conclusions by direct observations and by cross-referencing the feedback with administrative data about how the service is being used. Cross-referencing is important because feedback alone can only tell us some of the story: it may disproportionately represent those who had a particularly good or bad experience. Direct observation can reveal new aspects of user experience, while administrative data can tell us whether patterns we see in the feedback (such as long wait times) are representative of users in general. Together, this information can give us a more reliable picture of what is happening.
To map the relevant behaviors in Bedford, we conducted brief interviews, observations of how people were using the center, and reviews of documents that guide operations. The goal was to map the relevant behaviors from the perspective of the jobseeker and the unemployment center, identify who is (perceived to be) involved by each party, and identify any fundamental differences in experience or perspective. Through this process we identified four groups influencing the outcome: (1) unemployed people (jobseekers), (2) unemployment center staff, (3) prospective employers, and (4) the social support network (typically friends and family) surrounding the unemployed person.
Each group could perform a specific set of behaviors to increase the likelihood of a jobseeker attending the recruitment event. The diagram in figure 7 shows the relevant behaviors in a swimlane diagram, a common form of process map in which each group has its own “lane” or row and the process is laid out horizontally, showing the handoffs between groups at each step.

Figure 7
In this case, we found a good degree of consistency on the perceived behaviors from both sides, with the exception that some jobseekers listed friends and family as being involved—this group was invisible from the unemployment center perspective.
By laying out the behaviors this way, we can focus on who is doing what and their likely relative impact on the overall outcome. For example, whether the invitation is sent or not will have a very large effect on attendance, whereas the effect of advice from friends and family may be smaller. The behaviors that contribute to the target outcome are labeled by numbered diamonds in figure 8.
Result of this step: We brought together the exploratory information to map the behaviors relevant to attending or not attending mass-recruitment events.
Step 5: Identify the Factors That Affect Each Behavior
In order to influence these behaviors, we need to understand what is producing them. We may have gathered all the information we need at this stage in the previous step, but sometimes this exercise can reveal unresolved questions. In these cases, we might conduct further exploratory research.
So, how can we identify the factors underlying these behaviors? One useful model is the COM-B model, which organizes the factors that produce behavior into three main categories:
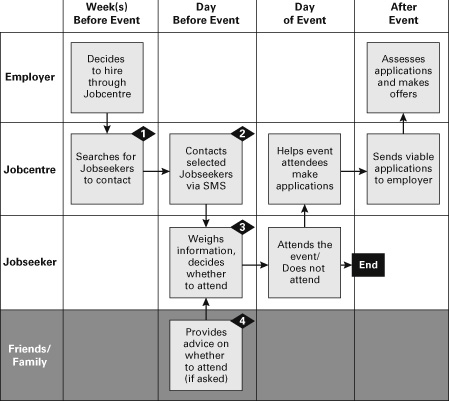
Figure 8
- 1. Capability: the individual’s psychological and physical capacity to engage in the activity concerned, including having the right skills and knowledge.
- 2. Opportunity: factors outside the control of the individual that enable or prompt a behavior.
In order to influence behaviors, we need to understand what is producing them.
- 3. Motivation: cognitive processes that drive the behavior, including both conscious and nonconscious decision making, habit, and emotional responses.3
Figure 9 shows a simplified version of the analysis of influencing factors for this project.
As mentioned in previous chapters, the behavioral insights approach does not have to be individualistic. A concrete way to think about this point at this stage is that opportunity factors (which fall outside the control of the individual actor) can be used as points for intervention. To develop an intervention we must now use the lessons from this stage to rank each behavior based on how easy it is to change, and how much impact that any such change would create.

Figure 9
Result of this step: We uncovered the factors that influence the relevant behaviors, identifying barriers and enablers.
Step 6: Choose Priority Behaviors to Address
This is the final step before we can create interventions to improve attendance at recruitment events (in service of the larger goal to reduce unemployment). For each behavior identified, we assign a rank based on the expected impact from making a change and the feasibility of doing so, using prompting questions like these:
- 1. Impact: How important is this behavior to the outcome?
- a. Is this behavior on the critical path to the outcome? In other words, to what extent does it influence attendance at the recruitment event?
- b. How many people enact this behavior? How many do not?
- 2. Feasibility: How likely is it that this behavior can be changed?
- a. Can we modify any of the factors influencing the behavior?
- b. Would the required changes be politically palatable? Are they likely to be affordable? Could they be accomplished in the available time frame?
- c. Are there other demands, in terms of either time or resources, on the relevant individual or organization that will make changing this behavior difficult?
These questions are deliberately general and at a high level; in reality, the ranking is informed by additional factors and depends on context. The conclusion of this assessment in Bedford was that we should focus on two interrelated behaviors identified in figure 9:
- • 2: A Bedford Jobcentre staffer constructs and sends the invitation (British, “the invite”) to the event via SMS.
- • 3: On receiving the SMS, the recipient decides whether to attend the event.
Specifically, this ranking identifies the factors relating to “motivation” in each of these behaviors to be both malleable and impactful in improving the overall outcome. Figure 10 gives a simple visual representation of the ranking results.
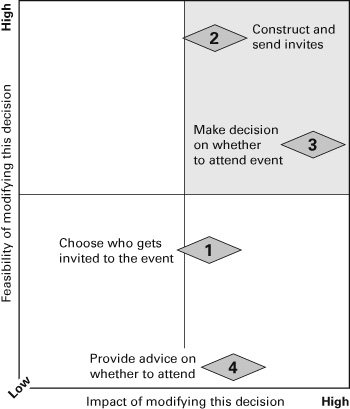
Figure 10
Result of this step: We identified two priority behaviors to target with the intervention: the construction and sending of the SMS invitation; and determining whether to attend the event.
Step 7: Create Evidence-Led Interventions to Produce the Priority Behaviors
By the end of this seventh step, we will have a proposed intervention that should result in the priority behavior(s) we have identified. First, we need to specify the solution requirements based on the factors that we know will influence the behavior. Figure 11 shows how this was done in Bedford. The influencing factors in gray are considered out of scope because changing them was not judged to be feasible. The ones in black, meanwhile, need to be addressed by our solution. To identify the specific solution requirements, we conducted a literature review looking at how barriers and enablers similar to those identified in the COM-B exercise have been overcome or exploited in other projects. In this case, our search focused on how to attract attention and make mass messaging feel personal; how to change perceptions of the likelihood of getting a job; and how to prompt action in the face of low morale.
To meet the requirements associated with devising and sending the message, we chose to test whether varying the wording of existing SMS invitations would increase attendance. To select this intervention, we again applied the criteria of impact and feasibility, but added two additional considerations: acceptability and scalability. Acceptability concerns whether there are political or ethical issues with a proposed intervention (we discuss this issue in depth in the next chapter). Scalability concerns whether the intervention could be used beyond an initial pilot or test site. For example, we made sure that—if successful—the message that performed best could replace the existing default template in the national system. While this requirement increased scalability, it also created trade-offs: Any message produced had to be generic enough to remain accurate and relevant at a national level. Therefore, the message could not state that the recruitment event was likely to lead to a job, since this was not always the case. These trade-offs are a common part of policy and service design.

Figure 11
Once we had agreed to use the SMS system, the question was how to construct messages that met the solution requirements in fewer than 200 characters. A review of existing evidence had not revealed any clear best practices for encouraging this particular behavior. Therefore, we had to draw more on general principles from behavioral science, many of which we set out in the first three chapters. The process of moving from general principles to concrete interventions requires a book-length treatment itself; as we noted, the precise way in which a message is formulated or a choice is presented can have important effects on behavior. We can summarize two main aspects of the process here.
The first is to review existing evidence to anticipate how potential interventions will be received. You may want to revisit the findings from steps 4 and 5 that illuminate people’s capability and motivation, and the context in which the behavior(s) are occurring (or not). You may wish to directly experience the context or service yourself again, with the potential interventions in mind. Your aim is to make a focused attempt to simulate the likely reactions of people experiencing the intervention. The difficulty here is that we often suffer from an “illusion of similarity” that produces inaccurate assumptions about what people think or know, as well as inaccurate predictions about how people will react to something.4 In particular, the person creating an intervention may overestimate the extent to which others share their views or—because the creator is so deeply involved—the extent to which people will understand or engage with their work.5
Given these challenges, a second approach is valuable: presenting potential interventions to participants directly as part of the creation process. One way of doing this is to pre-test the intervention in low-cost ways. Assessing how the intervention affects a small number of participants in real-world settings can be valuable, if the intervention is low-risk and can be implemented cheaply. If not, an alternative is to create a close equivalent of the intervention and run a test with an online sample of participants.
The key priority here is to use the findings in the right way. Obtaining people’s opinions about an intervention is useful for understanding how they will feel if it is implemented. But, while valuable, these findings are not always a good guide to how they will behave. For that reason, standard focus groups are generally less useful. If you are trying to understand behavior, however, then focus on the nearest equivalent to the real-world behavior and simulate the decision-making context as closely as possible.
Another option is to work with potential participants to develop simple prototypes of interventions. These prototypes can then be refined further or used to reveal new approaches. The advantage of prototyping is that it provides a much deeper engagement with participants’ worldview, which may present new perspectives that were not accessible to the project team.
Whatever method is used, when creating a solution there is often a creative leap where evidence, theory, and context suddenly come together to bring a new possibility into view. While that may sound challenging to achieve, there are several helpful frameworks that provide more support for developing interventions. For example, the Behavioural Insights Team’s EAST framework synthesizes much of the literature using four key principles—if you want someone to do something, then make the behavior easy, attractive, social, and timely.6 Each of these categories includes several useful concepts and techniques that expand on what we have put here.
This process produced four messages for testing with Bedford Jobcentre. We now show each of these messages and provide a brief explanation of how we translated the relevant evidence into specific language. To give a sense of context, we present them as if a factory called SystemLink is hiring for security jobs. In each case, we have italicized any words that are different from the preceding messages.
- A. Control. The “control” message was the existing message used by the Jobcentre, which we retained because we could not simply assume that new messages would perform better.
- “8 new security jobs are now available at SystemLink. Come to Bedford Jobcentre on Monday 10 June at 11am and ask for Sarah to find out more.”
- B. Personalization. A well-established body of research shows that use of a recipient’s name is effective at attracting attention and making a communication seem more relevant. In this case, the system made it possible to insert the recipient’s name into the message.
- “Hi Elspeth, 8 new security jobs are now available at SystemLink. Come to Bedford Jobcentre on Monday 10 June at 11am and ask for Sarah to find out more.”
- C. Endorsement. Jobseekers are assigned a specific Bedford Jobcentre employee to advise them (a “job coach”). Our hypothesis was that mentioning the name of a specific individual that jobseekers had met could (a) signal that the opportunity was legitimate (b) connect the immediate opportunity to past and future conversations with the coach. We drew on a similar study that showed that showed loan repayments could be increased by including the loan officer’s name—but only if the recipient had met that officer.7 Again, it was technically feasible to obtain and insert the correct job coach name.
- “Hi Elspeth, 8 new security jobs are now available at SystemLink. Come to Bedford Jobcentre on Monday 10 June at 11am and ask for Sarah to find out more. Michael”
- D. Reciprocity and luck. Many studies show that individuals often powerfully motivated to reciprocate actions—for example, to return a favor. In this case, we developed the phrase “I’ve booked you a place” to highlight that the JobCentre had invested some effort in supporting the event and inviting the recipient. We hypothesized that signaling this effort may trigger the desire to reciprocate by attending. We followed the phrase with a short “Good luck” message, which was informed by the concept of “locus of control.” Some jobseekers are likely to have an “internal locus of control,” which is the belief that someone’s own actions can meaningfully influence what happens to them. Others will have an “external locus of control” and think that what happens to them is mostly determined by factors outside of their control. Jobseekers with an external locus of control conduct less job search activity.8 At the same time, they may also be more likely to have a stronger belief in the concept of “luck.”9 Therefore, we anticipated that evoking luck may be effective for jobseekers in this camp, and increase attendance overall.
- “Hi Elspeth, 8 new security jobs are now available at SystemLink. Come to Bedford Jobcentre on Monday 10 June at 11am and ask for Sarah to find out more. I’ve booked you a place. Good luck, Michael”
You will notice that we created each message so that it builds on the next one, meaning that the final message contains all the preceding elements. This kind of additive design allows us to see the combined impact of the phrases, but it is less useful for isolating their specific effects. If we were more interested in those specific effects, we would structure the design of the experiment accordingly.
Result of this step: We designed four SMS invitation messages, informed by practical considerations and evidence from behavioral science.
Step 8: Implement
Steps 8 and 9 happen in parallel. In reality you cannot launch an intervention you plan to evaluate without also designing and implementing the evaluation itself.
In this case, implementation was quite straightforward. First, we needed to automatically generate text messages using the appropriate wording for each individual invited to a recruitment event. We built a basic spreadsheet to create the messages and upload them as a batch to the messaging system. This spreadsheet also used random number generation to assign jobseekers to one of the four message groups. To test whether the spreadsheet worked, we ran a prototyping process and fixed the small issues that emerged—for example, we shortened the original messages because they broke into two parts on older phones if recipients had long first names. We also checked whether attendance was being automatically and reliably recorded, and developed a procedure to handle people who had already been sent a message as part of the trial. We then supervised the use of the text generation tool for the first of the three recruitments involved in the trial period. For the later recruitments we simply checked the output messages for errors before they were uploaded to the texting system.
In other trials, implementation is a far more complex matter that requires active management and constant monitoring. One inconvenient truth of implementation is that the motivation of those charged with implementation will wane considerably as soon as the hassle factor of testing a new intervention exceeds that of running things the usual way. Small irritations loom large. For example, on another trial set in unemployment centers, BIT implemented a new process that required the use of a goal-setting booklet for each client. The booklets were of standard size but the desk drawers in which they would be stored were not. This created a huge hassle factor for the staff members who could no longer close their drawers and the inconvenience had to be fixed before it created irreversible damage. In most implementations there is a “desk drawer” moment, and the main takeaway is this: Do not ignore it. Whatever you or the project team can do to remove a burden associated with testing a new way of working will help ensure that the results of the test reflect the efficacy of the new intervention—and not the costs associated with managing the test.
Result of this step: Attendees were sent one of four SMS invitations, based on random assignment.
Step 9: Assess the Effects
We have already alluded to randomized controlled trials (RCTs) in chapters 1 and 2. In this section we recap the basic premise of an RCT and give more detail on how to actually run one. While we use RCTs when possible, they are not always suitable as an evaluation method. Other analytical approaches are available; we do not cover them in detail here, to avoid turning this into a book on experimental methods.
Let’s start with a quick recap of what RCTs are. RCTs are experiments that allow researchers to establish whether and how much an intervention has an effect on a particular outcome. More formally, they allow us to be very confident that one thing caused another (causal inference), which is attractive to those charged with protecting public investment or calculating returns on that investment. Causal inference sounds complicated but is a product of three simple features of the RCT.
First, well-constructed RCTs use a large sample. RCTs rely on splitting participants into groups. By including a large enough number of participants in each of these groups, we can be sure to gather enough data to iron out flukes, outliers, or other noise that might skew the results. A simple way to think about the value of more data is to imagine you are buying a product online. You have two different suppliers to choose from, both selling identical products. Supplier A charges $9.50, has an average rating of 3.5/5 stars, and has been reviewed by 1,000 customers. Supplier B charges $10.00, has an average rating of 4.8/5 stars, and has also been reviewed by 1,000 customers. Since you have 1,000 reviews apiece to go on, it is likely in this scenario that you can be pretty sure supplier B is better than supplier A and you can then make an informed decision about whether the difference in quality is worth $0.50 or not. However, if both suppliers had just ten ratings each you might be less confident about how meaningful their overall ratings are; one unfortunate experience could be enough to have hurt Supplier A’s score unfairly. In other words, when there are fewer data and the difference is small, it is harder to be certain about any conclusions you may draw.
RCTs are experiments that allow researchers to establish whether and how much an intervention has an effect on a particular outcome.
This isn’t to say that small samples cannot ever be informative, just that you would need a much bigger difference in ratings (1/5 stars versus 5/5 stars, for example) to be confident in your inferences. It is the same way in RCTs: the larger the sample, the clearer the picture, and the smaller the effect that can be detected. A “power calculation” is usually used to compute the sample size needed to detect a specific difference between groups with a certain level of confidence. Power calculations use a mix of conventional assumptions, such as standard levels of tolerance for false positive (5 percent) and false negative (20 percent) findings, and trial-specific inputs. Along with these conventional assumptions, the simplest version of a power calculation also requires the researcher to specify two of the following: the sample size you have to work with; the expected effect size of your intervention; and the baseline level of the outcome of interest at present. Several websites can help you do this kind of simple power calculation for free. For more complex calculations, you may also need to know additional information, such as the variance within the sample.
The second key feature of the RCT is the use of a control group. As previously mentioned, we split the sample into groups: one for each solution being tested (often called treatment groups) and one “control” group that experiences the usual process. This control group provides a counterfactual. That is, the control group tells us—through the outcomes we observe for it—what would have happened if we had not changed anything (in this case, what would have happened if the preexisting recruitment event message had continued to go out with no modifications). In effect, this control group means that we are factoring in any other changes that might be affecting our outcome. For example, let’s imagine we introduced our new messages for recruitment events in September, and then compared the attendance rates for those events against the ones held in August, when we were using the old message. If our new messages yielded higher attendance, we could not be sure whether that was due to the messages or some other factor. Perhaps the weather was better, perhaps there were fewer jobs available outside the events, or perhaps the event fell after a holiday when people felt more invigorated. Without a control group showing us the effect of the preexisting message on attendance, we might never be able to tell whether the higher attendance levels were because of our intervention. Of course, other factors inherent to the individuals could vary between the groups, which leads us onto the final design feature of RCTs: random assignment.
Random assignment means that people are randomly divided up into the control group or one of the treatment groups. Doing this randomly makes sure that the groups receiving each intervention have similar characteristics, which means that they are likely to behave similarly if treated the same. For example, in the case of event attendance, all the factors that determine whether someone shows up or not (e.g., whether they can afford the bus fare, the likelihood that they have other plans, their organizational skills, or their perception of whether the event is a valuable use of time) will be equally prevalent in each group. This means that if we introduce an intervention to one of the groups, we can say that any changes in that group’s behavior are due to the intervention—rather than any other cause.
While it sounds straightforward, random assignment can be surprisingly tricky, and we advise running the process using a computer program wherever possible. Handily, even common software, such as Microsoft Excel, has an inbuilt function, =randbetween(), that enables assignment to a random group. Where it is not possible to use machine-led random assignment, proceed with caution. Even strategies that seem “random” can prove to have hidden bias within them. For example, in Britain house numbers typically result in odd numbers being on one side of the street and even numbers on the other. In many towns and cities, housing quality varies depending on the side of the street because of exposure to air pollution from factories during the industrial revolution; the direction of the wind means that houses with odd numbers may be systematically different from their even-numbered neighbors.
When planning an evaluation like this, it is important to document each of the steps, assumptions, and analytical choices that have been made. This will help avoid common pitfalls and also keep the person running the analysis honest when the data come in. By prespecifying what analysis will be performed, the risks associated with overinterpretation are minimized (more on this in the next chapter).
Figure 12 shows the evaluation plan for the trial in Bedford.
In this case, we randomized each individual jobseeker to one of the messages, but sometimes this is not the right strategy. For example, imagine that instead we were texting to workers within a supermarket information about a promotion opportunity: The outcome is still whether they attend a recruitment event, but it is held within their own workplace. Randomizing at the individual level is certainly viable but it is also risky. If everyone’s phone beeps at the same time, and workers start to compare messages, then some may be demotivated because they have not been told “I’ve booked you a place.” On the other hand, those who have received that message might infer they have a better chance. These perceptions change attendance; the demotivated go less often and their buoyed-up colleagues go more often. This spillover of treatments means that we cannot isolate the true effect of a certain message. Instead, it would be more prudent, assuming this was a regional or national program, to randomize by store or shift-work team. That way everyone who is likely to compare their message to others is treated the same and the risk of spillover is mitigated. This approach is known as cluster randomization. Of course, the point on sample size still stands: We would still need to calculate how many stores or teams are needed to be sure of our conclusions (although the calculation is different when randomizing by clusters).

Figure 12
Finally, as RCTs allow us to estimate a range within which the true effect lies, we don’t just learn whether something worked, but we are also gifted with a reliable estimate of its impact. The gray bars in figure 13 show the range of impact for each text message in Bedford.
Getting an estimate of the size of the impact is especially useful because policymakers with limited budgets (or business people with shareholders to reward) often need to choose which of several approaches give them the best return. For example, we are able to conclude not only that text D was better but also that it meant between 46 and 53 extra job seekers attended recruitment events during the trial period. When samples are large enough, we can also learn what worked for whom and attend to any differences or inequities that arise as a result (more on this in chapter 5). With unemployment, for example, we might be interested in whether these messages work differently for men and women, or whether recruitments for some skill sets are more likely to generate attendance than others.

Figure 13
At this point we reflected back on the goal set out in step 1: to increase attendance by 50 percent. Our intervention, although small, led to more than a 150 percent increase in attendance. There is still a good way to go, with 73 percent of people choosing not to attend, but this is a significant improvement both in the sense of statistics and policy.
Result of this step: We evaluated the intervention using a randomized controlled trial. The results indicated that the most effective message more than doubled attendance at recruitment events.
Step 10: Take Action Based on the Result
Whether your intervention was effective, was ineffective, or even backfired, you will probably need to take further action to reap its full potential. Unfortunately, this step can be harder than many people expect. After all, adoption of a new way of doing things is a behavioral challenge of its own; just because something is proven to work does not mean it will be ushered in immediately as business as usual. Just because something was ineffective doesn’t mean the plan to roll it out will be automatically wound back. Sometimes this may be for good reason. For example, an intervention that worked in one local context may not work somewhere else, and further testing is therefore required before scaling up nationally. Often, however, things will simply go with the flow of the default way of doing things.
In the case of our texting trial, we were able to replace the default message structure in the nationally held SMS system, meaning the solution was spread to unemployment centers across the country at the press of a button. This was, as stated in step 7, by design: we knew that expecting staff members in one unemployment center, let alone across the UK, to make a deliberate change to their standard practice was likely to mean our intervention never scaled. If we replace the default message with the new, more effective variant, then we are not requiring staff members to change their behavior.
Of course, improving attendance at a recruitment event is a relatively small change. As we mentioned in step 1, there are many other ways that we might be able to improve employment prospects for out-of-work individuals. Thus, once success has been proven in one area, it is always worth returning to other behaviors or problems, if budgets permit. As mentioned previously, the approach set out in this chapter has also been used to fundamentally redesign the operating practices of unemployment centers.10 From 2012 to 2013, BIT devised interventions in this category that led to unemployed people leaving benefits 1.5 days earlier than they would have otherwise. While this may sound small, this effect has large economic benefits when scaled: in this trial alone, more than 88,000 unemployed individuals were involved.
The solutions were devised and tested based on three months of research about how users experience unemployment centers, what the process underpinning the user journey entails, what the evidence can tell us about the experience of being unemployed, and how the process feels in practice. The new process involved shortening and simplifying paperwork; tailoring plans more to the jobseeker’s life and routine; making meetings focus on future ambitions rather than past compliance; and improving jobseeker morale.
Scaling this intervention was very different from switching an SMS template, since it required significant buy-in from staff and managers. We spent a further six months helping to train trainers, producing videos to provide easy-to-access support, and working out how to supply the new materials to 700 unemployment centers across the country at scale. Now the process is embedded in all UK unemployment centers.
Result of this step: The message that performed best became the new default SMS template in the national texting system.
The behavioral insights approach has also been applied to employment policy in areas such as closing the gender pay gap, reducing hiring bias, and speeding up returns to work in the event of illness. Beyond this policy area, as the scope of this book shows, there are no limits to the issues that can be addressed by the approach. With such wide-reaching potential, we must, of course, be aware of the limitations, criticisms, and considerations that accompany behavioral insights. We turn to these topics in the next chapter.