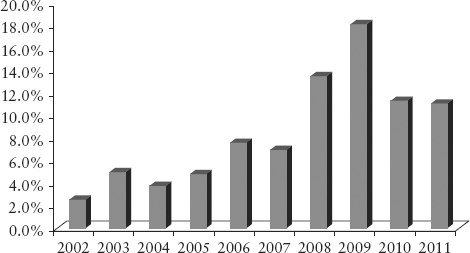
FIGURE 5.1 Emerging Markets PE Flows as Percent of Total PE Flows
Source: EMPEA Industry Statistics, 2011, author’s analyses.
Another indicator to consider is the private equity industry and their selection of markets. Private equity (PE) can be simply defined as active investing. In other words, private equity is the combination of capital under freely negotiated contracts with active contributions to the investment company at strategic, management, or operational level. By contrast, investing in public equities is generally standardized. That means there are no tailored contracts and no additional shareholder contributions to the company. Buyouts, takeovers, and majority acquisitions may have hallmarks of private equity but within defined parameters that are given by prevailing shareholder rights, the stock market, and the existing company constitution.
Because private equity allows for negotiated contracts and active management participation, private equity can by definition invest in more markets. First, there is no requirement of an active and broad stock market or for a minimum level of stock market regulations and second, framework conditions are of less relevance because most barriers can be overcome by contract and structuring. Contracts and investment structures can change a company’s constitution, avoid restrictive company law or foreign investment laws, and make extensive use of offshore jurisdictions more conducive to the investment objective, the shareholder agreement, or any security for the investment.
This contribution looks at the theoretical argument and considers the long-standing International Finance Corporation (IFC)1 experience in support of the argument.
Private equity investors look primarily at target investment companies and appropriate capital structures and secondarily at local framework (market) conditions. Public equity is quite the opposite. Public market investors seemingly look first at stock market standards and then at the most attractive companies within. The analyses of market selections and market classifications argue that due to a restrictive perspective with essentially three classes of markets (emerging, frontier, and unclassified), many worthwhile investment opportunities at company level are excluded because overall market conditions do not meet the required standards.
Since private equity investors have more markets to choose from but are return maximizers, the question arises whether cumulative and unrelated private equity flows have any predictive value with respect to the rise or advent of investable markets that should be considered on a broader scale. For the purpose of this discussion, we shall define investable markets as markets with a stock exchange that has a minimum level of regulations, size, and liquidity, and listed companies from several economic sectors. It also includes exchanges that have just started. Essentially, this is relevant for markets outside the MSCI Emerging Markets Index but covers most frontier markets and those markets yet unclassified but with exchanges.
From the outset there are two logic arguments why the lead function of private equity should hold true:
Both factors are a necessary albeit not sufficient condition for rapid growth of any developing stock market.
Private equity flows to emerging markets changed considerably over the past decade.2 First, the relative proportion of flows to emerging or developing markets is rising (see Figure 5.1). Emerging markets exclude the United States, Western Europe, Japan, and Australia/New Zealand.
FIGURE 5.1 Emerging Markets PE Flows as Percent of Total PE Flows
Source: EMPEA Industry Statistics, 2011, author’s analyses.
Second, private equity flows within emerging markets have experienced a reversal of flows over the past decade (see Figures 5.2 and 5.3). From a relative dominance of Latin America in 2002, flows changed to a relative dominance of Emerging Asia.
FIGURE 5.2 Emerging Markets PE Investments by Region, 2002
Source: EMPEA Industry Statistics, 2011, author’s analyses.

FIGURE 5.3 Emerging Markets PE Investments by Region, 2011
Source: EMPEA Industry Statistics, 2011, author’s analyses.

Essentially, from 2003 onward, the private equity industry took aim at two elements of the BRIC (Brazil, Russia, India, China) opportunity and refocused investments toward emerging Asia, mainly China and India, and away from Latin America and Russia/Central Eastern Europe (CEE).
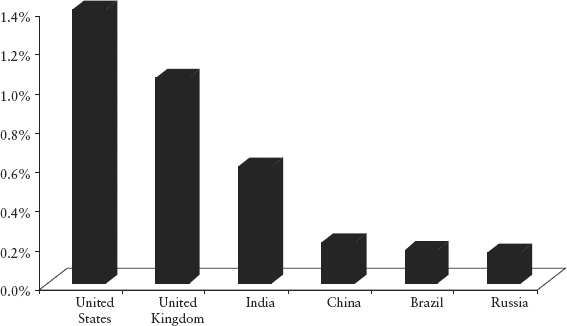
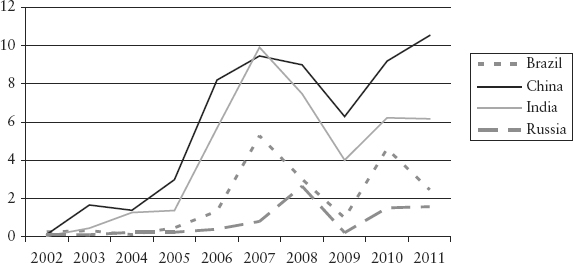
This is confirmed by a detailed review of private equity flows among the BRIC economies. China and India are dwarfing flows to Brazil and Russia (see Figure 5.4).
FIGURE 5.4 Private Equity Flows to BRIC 2002 to 2011 in US$B
Source: EMPEA Industry Statistics, 2011, author’s analyses.
Private equity has turned to emerging Asia. However, the dominant recipients, China and to a lesser degree India, mask the relevance of multiple other emerging Asian investment destinations for private equity (see Figure 5.5).
FIGURE 5.5 Emerging Asia Excluding China and India—PE Investments 2002 through 2012 in US$B
Source: EMPEA Industry Statistics, 2011, author’s analyses.
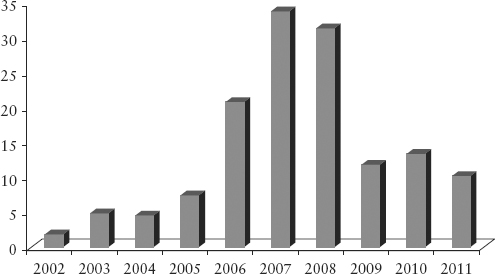
Clearly the sheer dominance of China and India overshadows other emerging Asia investment destinations, but volumes excluding China and India remain significant and were well above US$30B during the bumper years prior to the financial crisis.
Looking at all emerging Asia countries in detail, we see newcomers and prospective high flyers (Table 5.1). It must be noted that at country level, these statistics are most certainly incomplete because they rely on reported transactions. Not all fund managers or private equity investors report investments, and based on anecdotal evidence the true value is probably double if not more as private transactions with prominent individuals are a significant pool of development capital in frontier and unclassified markets. Therefore numbers are understated, but the reported direction makes for interesting observations.
TABLE 5.1 Emerging Asia (excluding China and India) Reported Private Equity Transactions by Country, 2008 to 2011
Source: EMPEA Industry Statistics, 2011, author’s analyses.
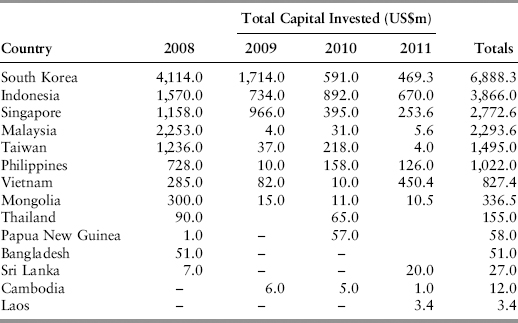
Following the usual suspects at the top of the list, markets like the Philippines, Vietnam, Mongolia, Bangladesh, Sri Lanka, Cambodia (recent stock market), and Laos (new stock market) make their appearance. Emerging Asia numbers are understated as a matter of fact. For example, Mongolia, Cambodia, and Thailand attract many investments that are not reported. Although these markets collectively only amount to slightly over 13 percent of all Emerging Asia private equity flows, they could be a lead indicator.
The same conclusion applies to CEE and the Commonwealth of Independent States (CIS) (Table 5.2).
TABLE 5.2 CEE and CIS (excluding Russia) Reported Private Equity Transactions by Country, 2008 to 2011
Source: EMPEA Industry Statistics, 2011, author’s analyses.
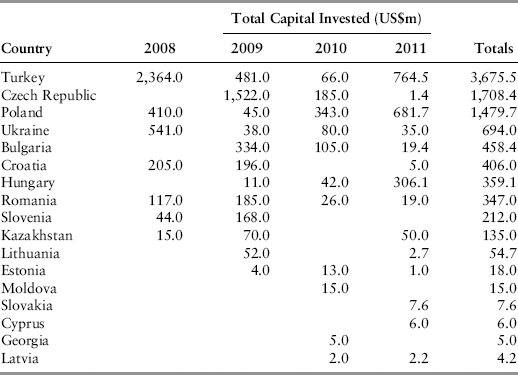
While a number of markets are already included in the MSCI Index or are advanced emerging markets (FTSE), a good number of markets remain unnoticed by most investors.
Equally, other regions such as Latin America and the Caribbean sport some interesting investment destinations (Table 5.3).
TABLE 5.3 Latin America and the Caribbean (excluding Brazil) Reported Private Equity Transactions by Country, 2008 to 2011
Source: EMPEA Industry Statistics, 2011, author’s analyses.
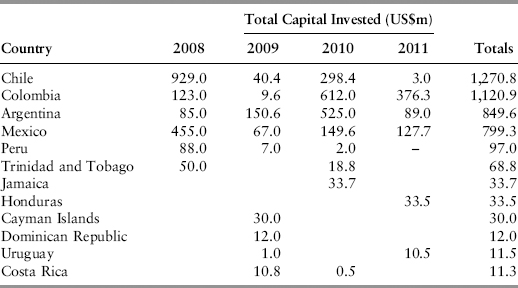
Outside Chile, Colombia, Argentina, and Mexico, most economies are not commonplace investment destinations. Yet investment in these other minor economies already amounts to some 7 percent of total private equity investment in the LATAM and Caribbean region.
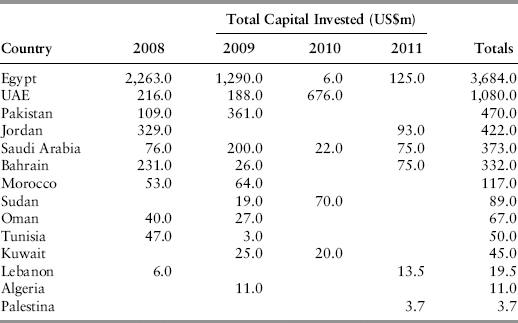
The Middle East North Africa region (MENA) (Table 5.4), although small overall, sports another array of markets often overlooked. Egypt and the United Arab Emirates are clearly attractive investment destinations, although the Arab Spring will constrain further growth in Egypt and some other affected markets.
TABLE 5.4 Middle East Reported Private Equity Transactions by Country 2008 to 2011
Source: EMPEA Industry Statistics, 2011, author’s analyses.
Finally, the African continent is growing as a private equity investment destination (Table 5.5). Multiple countries are attracting private equity investment indicative of future investment growth in public markets. Many of these markets have fledgling or developing stock markets that could provide one of the opportunities going forward.
TABLE 5.5 Sub-Saharan Africa Reported Private Equity Transactions by Country, 2008 to 2011
Source: EMPEA Industry Statistics, 2011, author’s analyses.
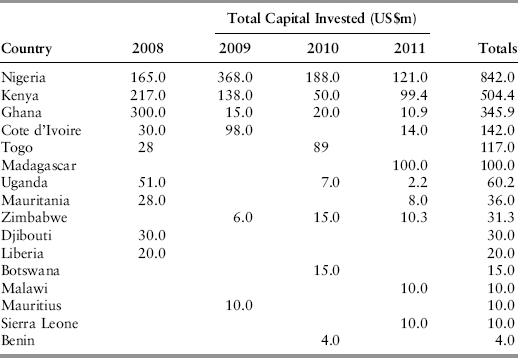
Overall, private equity flows show appreciable activity in some 60 markets outside the emerging markets of the MSCI index. These markets are not considered mainstream or even frontier markets by many index, research, and analysis providers.
The outlook and future strategies for Asia-Pacific articulated by private equity investors3 confirms an upcoming change of emphasis and shows a remarkable appetite for new opportunities, as shown in Figure 5.6, away from the past mainstream markets of China, Hong Kong, and India.
FIGURE 5.6 Limited Partners Strategies 2012 and Beyond in Percent Allocation
Source: PEI Surveys, 2012, author’s analyses.
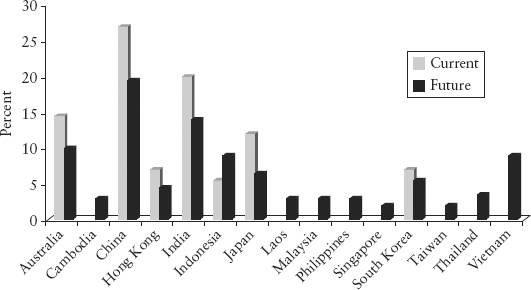
For Asia-Pacific, this means that several economies considered today frontier or unclassified are attracting the interest of private equity investors. Other regions may show a similar picture of moving cautiously away from traditional markets.
If private equity investors have adequate confidence in managing and exiting investments in these markets with above US$100M in aggregate investment over the past four years, other investment should follow suit.
To establish whether existing or future private equity investment is a lead indicator would require either to establish causality, which in the best of a fully researched world with complete information would be a stretch, or to show some correlation between private equity investment flows and general market size or growth. To develop the argument of causality exceeds the scope of this book. This subject is reserved for academic studies and deserves further attention but will require long and well established data series.
However, some correlation can be established. To this effect, we differentiate between MSCI Emerging and Frontier markets and others; we also segregate economies by the volume of private equity investment received (above and below US$100 million) over the period 2008–2011. The US$100 million delineation is arbitrary but seems indicative of serious investment flows.
For each of these groups of economies, we review the ratio of private equity to public equity market capitalization and control this ratio by the level of market capitalization to GDP.
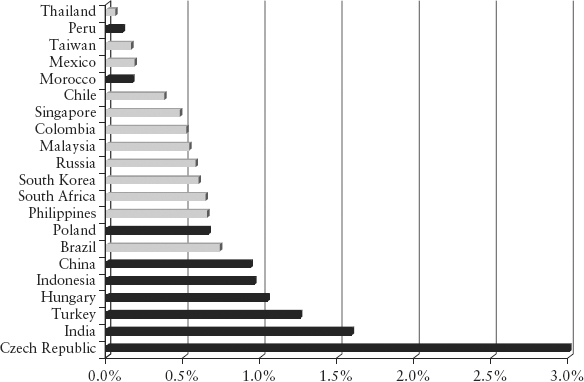
Of the MSCI emerging economies attracting more than US$100 million in private equity, almost all have a private equity to market capitalization ratio of below 1 percent. The exceptions are the Czech Republic, India, Turkey, and Hungary. These exceptions can be explained by the level of stock market development. In each of these markets, stock market capitalization as a percentage of GDP (in purchasing power parity) is below 40 percent, indicating a relatively less developed stock market as do those markets highlighted in Figure 5.7.
FIGURE 5.7 Ratio of Private Equity Investments 2008–2011 to Stock Market Capitalization—MSCI Emerging Markets Index Constituents above US$100 million private equity flows
Note: Excludes Egypt due to irregular stock market developments following the Arab Spring; market capitalization is generally as of May 2011.
Source: EMPEA, Bloomberg, Everest Capital, author’s analyses.
For emerging markets (excluding MSCI Emerging Markets) that received in excess of US$100 million in private equity investments over the period 2008 to 2011, the ratio of private equity to stock market capitalization tends to be in the range of 1 to 2.5 percent and above. The majority of these economies also have a ratio of stock market capitalization to GDP (in purchasing power parity) of well below 40 percent, except for the major Arab states (see Figure 5.8).
FIGURE 5.8 Ratio of Private Equity Investments 2008 to 2011 to Stock Market Capitalization (economies above US$100M private equity investments excluding MSCI Emerging market constituents)
Note: Excludes Côte d’Ivoire and Togo (regional exchange with several other West African markets), and Madagascar (no exchange); market capitalization is generally as of May 2011.
Source: EMPEA, Bloomberg, Everest Capital, author’s analyses.
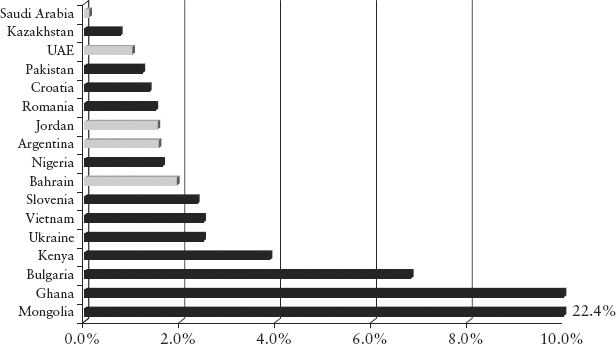
Saudi Arabia is a major exception with very low private equity. This can be explained by prevailing barriers to private equity for foreign investors and the lack of reporting of private transactions locally.
While recognizing the deficiencies of available data and the selection of time lines, we can conclude that we are faced with two distinct groups of emerging markets within our chosen parameters:
If we assume that equity investment is driven by the attractiveness of the investment destination and the opportunities afforded, there is no apparent reason why private equity investors would value one market so much above public equity investors.
Leaving distortions on reported private equity aside, the obvious explanation for the difference in relative private equity investment is that private equity investors are ahead of public markets and subsequent MSCI inclusion and/or the MSCI inclusion fosters faster public market development. Either way, private equity looks ahead by maybe two to five years, because private equity is less constrained by stock market governance issues.
It is very difficult to test the hypothesis with the most advanced markets because the by far leading private equity markets of the United States and Western Europe are dominated by mega deals and buyouts. These transactions do not allow for a proper comparison of developed market private equity flows to market capitalization.
We therefore conclude that if economies with established private equity investment flows (above US$100M between 2008 and 2011) also have a low stock market to GDP ratio, then such stock markets are likely to expand faster than others.
The lead function of private equity seems logical for three reasons:
There is a second hypothesis to be considered. If market capitalization is comparatively small in proportion to GDP (at PPP), continued and high GDP growth will foster growing and successful companies and requires more corporate funding. Equity is a major solution in particular in times of restrictive banking conditions.
We may therefore assume that rapid economic growth goes generally together with stock market development, albeit with a time lag—the time investors need to appreciate that economic growth is stable, investment conditions are attractive, and sizable transactions are possible.
For public equity markets to grow, more companies need to list or prices need to increase. Since prices are somewhat constrained by company growth and comparable price earnings, more companies need to come to market to increase market capitalization in a meaningful way.
Private equity fosters the supply side to stock markets and supports existing stock market investments and IPOs. This leads to increased supply and volumes on the stock markets. Thus market capitalization is likely to increase if and when private equity starts to play a bigger role in economies with a lower relative importance of the stock market to the overall economy.
We have two asymmetries that suggest some form of forthcoming stock market growth:
We therefore look for markets that have more than 1 percent private equity flows to public equity (provided private equity is in sizable amounts) (point 1) and high-growth markets with relatively low market capitalization to GDP but high private equity (point 2).
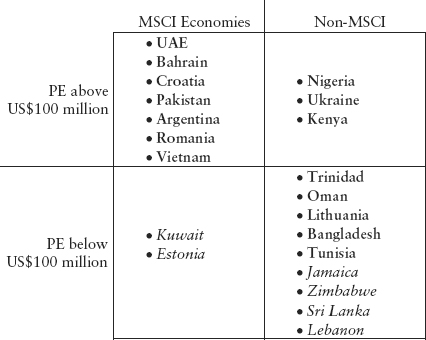
If we divide markets with at least US$100M private equity into those above 1 percent private to public equity and into markets below 40 percent market capitalization to GDP, we find an interesting mix of economies not generally considered the next winners by many investors (Figure 5.9).
FIGURE 5.9 MSCI Emerging Markets and Frontier Markets with over US$100M in Private Equity, 2008 to 2011
Source: EMPEA, Bloomberg, Everest Capital, author’s analyses.
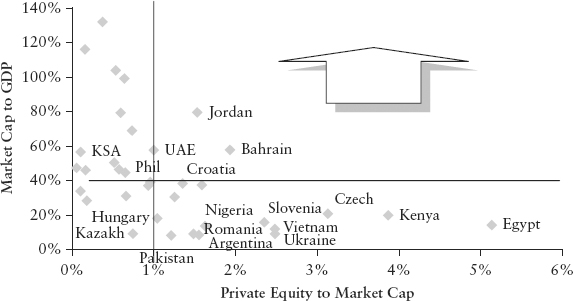
Based on our observation, the non-MSCI markets of Jordan, UAE, Bahrain, Croatia, Pakistan, Argentina, Romania, Nigeria, Vietnam, Ukraine, and Kenya are poised to expand their stock markets over the coming years.
Kazakhstan and Saudi Arabia (KSA) do not fully meet the attractiveness criteria, but deserve further attention. Both markets have very specific issues to deal with—rule of law and barriers to investment.
We should also not ignore those economies with a lower level of private equity investment. There are numerous reasons why reported private equity flows understate the true private investment volume. In most if not all developing economies, the first port of call for equity and risk funding is friends and family, as well as prominent (ruling) family members as well as the national diaspora. The most successful or promising companies in developing economies do not always invite foreign private equity investors. There are good reasons for funding preferences between equity and debt and between independent and connected equity. In many cases private equity acts dysfunctionally and has a poor reputation.
Because of these issues with private equity, we cannot be solely guided by reported private equity flows. We may thus include countries in our selection with a lower level of reported private equity.
Related private equity cannot be easily measured. Several publications have tried to establish sources of funds in Asia. For example, in 1988 early studies4 show the dominance of Chinese family capitalism across Southeast Asia and the connectivity of family owned business groups. This has persisted and was only disturbed by the various financial crises. Yet in Thailand,5 a review of the capital structure for 384 listed companies in 2004 well after the Asian crisis shows that 290 companies (75 percent plus) still had 61 to 80 percent+ shares held by the top 10 shareholders. A further review of the type of ownership of 419 listed firms in 2006 shows that 211 or 50 percent were fully or partly family owned. Related or connected transactions are not reported as private equity. In these environments, private equity from third parties is also not as attractive. This could well explain a low private equity role in many frontier economies. Paucity of data prevents a country by country review and estimate of true private investment flows.
We therefore review all countries with both low private equity (not desirable but possibly understated) and low stock market development as secondary candidates (see Figure 5.10).
FIGURE 5.10 Frontier and Unclassified Markets with under US$100M in Private Equity, 2008 to 2011
Source: EMPEA, Bloomberg, Everest Capital, author’s analyses.
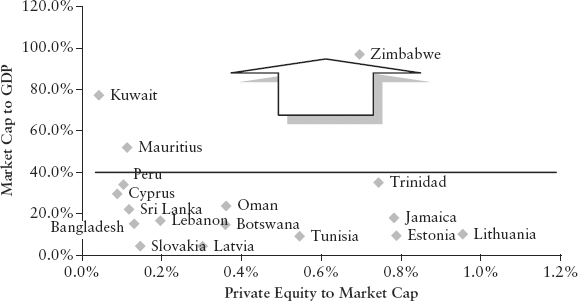
All these markets attracted US$10 million to US$99 million of private equity investments over the past four years and are therefore of interest to at least some investors.
They should develop into bigger investment destinations for public equity over the coming years. A judgment call is required to determine exactly which markets are at the forefront. Let us assume that US$50 million or thereabouts in third party and reported private equity is a minimum benchmark. This gives us another five non-MSCI markets to consider, namely Trinidad, Oman, Lithuania, Bangladesh, and Tunisia. However, Kuwait, Jamaica, Zimbabwe, Sri Lanka, Lebanon, and Estonia are not far off the mark.
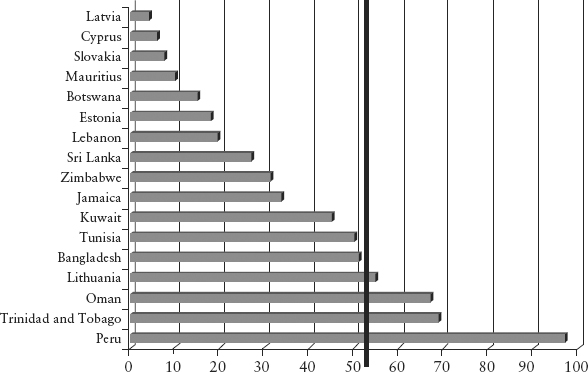
Going further down the ladder we find serious watch candidates in Figure 5.11.
FIGURE 5.11 Frontier and Unclassified Markets by Private Equity Investments Made between 2008 and 2011 (in US$M)
Source: EMPEA, Bloomberg, Everest Capital, author’s analyses.
The argument that private equity is a lead indicator does not mean that the opposite is equally true. The lack or absence of private equity does not mean that stock markets are not worth investing in or could not become the next growth wave. It simply says that other indicators must be used.
Private equity is a very powerful and immensely relevant pioneer in investing in new markets and should not be ignored as major selection criteria for public equity investors. In fact, in some economies private equity is a necessary precursor because either the stock market is really small or does not yet exist, such as in Cambodia. With growing investment interest, stock markets develop and the leading role of private equity remains for a period of time. Then size and diversity of the stock market makes private equity a separate business. Until then, however, private and public equity are complementary and should benefit from each other.
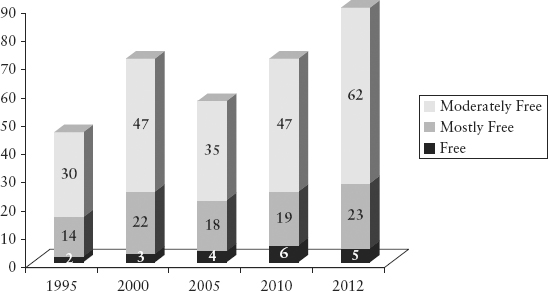
The number of countries that are suited to private equity has increased noticeably. As an indicative measure, the Economic Freedom Index of the Heritage Foundation can be taken. In 2012 alone, the scores of 75 economies improved, of which 73 are considered developing or emerging countries. Over the past two decades, the number of mostly free countries has almost doubled and so has the number of countries that are moderately free.
With some concessions, there are today around 90 markets that can be considered investable for private equity from an overall perspective (see Figure 5.12). That is about half of all economies globally.
FIGURE 5.12 Number of Countries and Level of Freedom (1995–2012)
Source: The Heritage Foundation, 2012, author’s analyses.
The opportunity is therefore larger than generally recognized. Specifically for private equity, the number of markets that meet the basic criteria for successful private investment is growing. For private equity to succeed, principal framework conditions fall into two categories:
With respect to enabling conditions, the rule of law is most certainly the toughest criteria to fulfill. By the very nature of an emerging market, the rule of law criterion suffers from two major deficiencies: First, while generally and increasingly solid and well-reasoned laws are enacted, the implementation of these laws depends on an efficient court system. This in turn depends on well-educated and experienced judges, prosecutors, and advocates or arbitrators. Unfortunately, the development of human resources does not keep pace with economic development. It takes years if not decades to bring human resources to the level of education and experience required. Thus in most emerging economies economic success is far ahead of public legal administration and the courts. Private equity investors can protect themselves to some extent against this deficiency through intelligent corporate and financial contracting.
Second, in all emerging economies there is a tendency to have a gray or informal economy that invariably engenders some form of irregularity. This behavior pattern ranges from business facilitation to outright malfeasance. More often than not, corrupt practices serve to overcome stumbling blocks or deficient processes rather than perverting the course of public administration. It represents a form of tax on doing business and in many cases this tax is indirectly legalized. Another aspect is transfer payments and the taking of commissions for business introductions or simply executing a transaction. This practice is often a matter of public knowledge and pride, although in our world such commissions would not fall under appropriate rewards for arm’s-length transactions.
Variations are endless. One of the fine examples of commissions was the recapitalization of Barclays Bank PLC after the financial crisis. Two members of the ruling families of the United Arab Emirates and Qatar, also respectively top government officials and executives, brokered the capital contributions of the equivalent of sovereign funds and received several hundred millions of pounds of commissions in their private offshore accounts,6 all properly and publicly documented in the prospectus to shareholders of Barclays Bank PLC and voted on by shareholders.
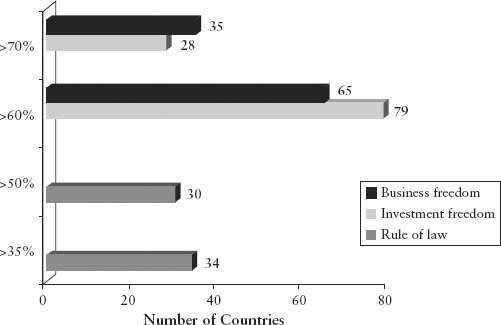
As a consequence, some concessions need to be made on the rule of law because weaknesses are inherent in the nature of any emerging economy. Various indexes can be taken to measure progress on the rule of law criterion. The Heritage Freedom Index, for example, scores rule of law and includes the Transparency International corruption perception index. When excluding advanced OECD economies, over 30 countries achieve a 50 percent or higher score for rule of law and some 34 other countries achieve 35 percent or better. With a 50 percent score, economies are on par with advanced OECD countries such as Italy for property rights and on par with countries like South Korea for freedom from corruption.
On the criterion of open markets, most economies (globally more than 125) score 70 percent or better on the aspect of trade freedom. Clearly, globalization has caused widespread trade liberalization. Trade barriers are generally not a restriction for private equity.
The two other aspects of open markets are investment and business freedom. Investment freedom measures the national treatment of foreign investors, land ownership and sectoral restrictions, foreign exchange and capital controls as well as expropriation incidents; 28 emerging markets score 70 percent or better for investment freedom and 51 markets score above 60 percent.
Business freedom is the quantitative measure of the ability to start, operate, and close a business and represents the overall burden of regulation as well as the efficiency of government in the regulatory process. Thirty-five markets score above 70 percent and 30 markets above 60 percent, as seen in Figure 5.13. Equally in this aspect many economies have made significant progress.
FIGURE 5.13 Number of Countries and Business Freedom
Source: The Heritage Foundation, 2012, author’s analyses.
Overall, some 60 to 70 emerging economies meet the basic qualifications for private equity investment regardless of the existence of a stock market. Almost all the economies will also have a stock market and thus be investable in general, but the stock market may be narrow, illiquid, or fail to meet governance standards.
Potential destinations for private equity cover about one third of the world.
Three trends have increased both the number of businesses and the ability to acquire influence:
Measures of conditions for private business have improved across a wide range of emerging markets since the 1990s, leading to an increase in the number of companies of interest to private equity. The scale of improvements in private business conditions in emerging markets is significant (see Figure 5.14). Developed markets seem to be moving in the other direction.
FIGURE 5.14 Change in Economic Freedom of the World Index
Source: Fraser Institute, Economic Freedom of the World Index (EFW), author’s analyses.
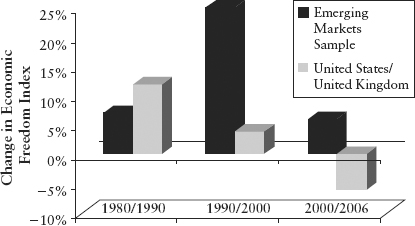
Emerging markets have opened their trade and capital accounts since 2000, increasing opportunities to both expand and compete in domestic markets. This creates situations where the sale of equity with influence over the business is seen as desirable by owners in order to attract the capital or the skills necessary to expand, compete, or increase focus on the core business by the sale of non-core businesses.
Even in the BRICs (Brazil, Russia, India, and China), private equity funds as a percentage of GDP are low compared to the United States and the United Kingdom, indicating much room for growth (see Figure 5.15).
When further considering restrictions and capital constraints of the local banking systems as indicated by the comparatively low financial freedom scores of many emerging markets, private equity has a true role to fill in augmenting the entrepreneur’s ability to meet domestic market demand and exploit regional export or contract manufacturing opportunities.
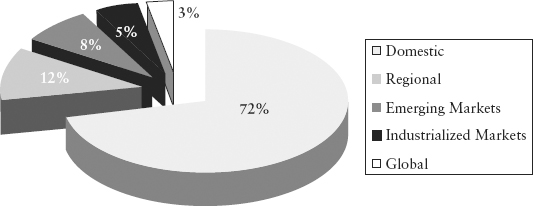
Overwhelmingly, domestic expansion is the target for companies taking private equity investment (see Figure 5.16).
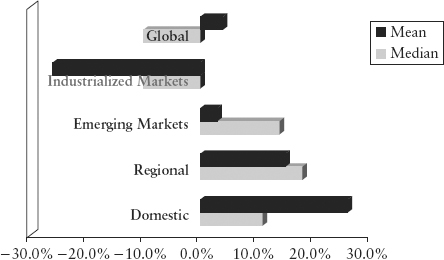
Domestic and to some extent regional expansion provides vastly superior returns compared to focusing internationally (see Figure 5.17). Domestic opportunities in emerging markets are growing much faster than those in global markets with arguably less competitive rivalry. Familiarity and proximity reduce transaction costs. The average annual revenue growth rate in sample private equity investee companies is a staggering average of 37.8 percent (across 527 companies in IFC invested funds with a holding period of at least one year) and job creation achieves an average growth rate of 22.3 percent (412 invested firms).
This stellar performance is achieved with an average debt to equity ratio of 0.74. To replicate similar benchmarks in advanced economies would be hardly possible across such a broad spectrum of companies and industry sectors.
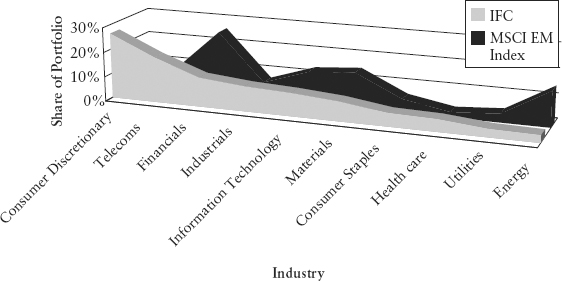
Private equity funds back more consumer oriented businesses and demonstrate a very different structure than public market investments, as indicated by the MSCI Frontier Index weight (see Figure 5.18). The continued argument made, namely that emerging economies are getting more self-sufficient and are increasingly providing a sustainable domestic consumer base, is well recognized by private equity investors.
FIGURE 5.18 Industry Exposure IFC Private Equity—MSCI EM Index
Source: IFC investee companies within IFC backed funds, 2000 and later.
While the performance and opportunity for private equity in emerging markets seems underestimated, risks in emerging market private equity seem overestimated.
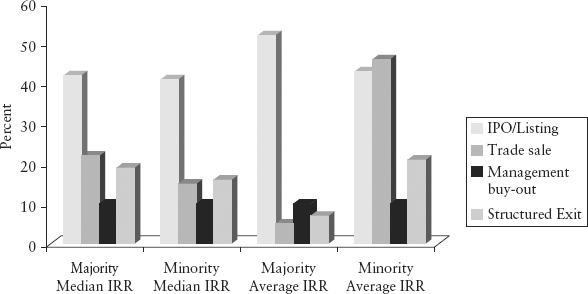
Many investors see minority positions in private equity as an additional risk and drag on the return. Experience to date suggests otherwise (see Figure 5.19). Minority positions performed well in all forms of exit, indicating that risks associated with minority positions can be managed effectively. They also performed well in terms of exit values.
FIGURE 5.19 Median and Average IRR (Internal Rate of Return) at Exit—Minority and Majority Stakes
Source: IFC, 61 exits from majority positions and 251 from minority positions.
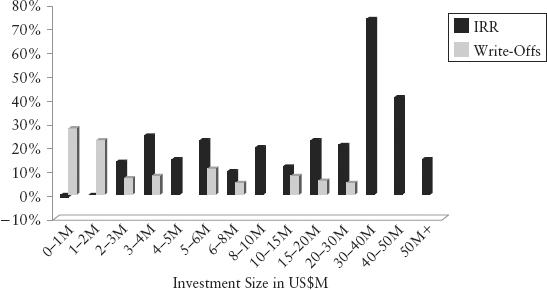
Another often cited risk factor that does not bear out is the notion that emerging market private equity tends to be in smaller companies that are inherently riskier and less attractive. Experience suggests that while smaller deals are riskier, they are not inherently unattractive provided investments are adequately managed to minimize write-offs that are higher for smaller transactions. Mean returns are in fact higher for smaller deals than for medium deals, as shown in Figure 5.20.
FIGURE 5.20 Median IRR and Write-offs by Investment Size
Source: IFC, 313 exits for IRR analysis and 323 exits for write-off analysis.
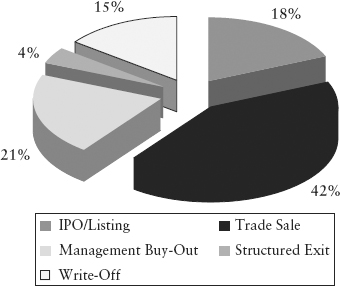
Many critics argue that exits are not available. IFC private equity investments made 325 exits in emerging markets through a variety of channels, as shown in Figure 5.21.
While IPOs did provide the highest returns with an average return of just above 40 percent, trade sales did very well and achieved on average in excess of 30 percent IRR. MBOs and structured exits were in the low to middle teens. The average holding period was 4.9 years.
Finally, in the IFC experience it does not take longer to exit the typical private equity J-curve in emerging markets. Comparing all IFC funds by vintage year with IFC private equity funds by the same vintage year does not show any noticeable differences.
Private equity in emerging markets has great potential as more and more economies reach the stage where they provide the necessary conditions for private investment. The role is to foster the development of high growth companies even if they are smaller. In this respect, private equity has a lead function for capital market development.
There are a number of attractive markets hereto not adequately considered based on strong private equity flows and stock market growth opportunity (Figure 5.22). Private equity invested companies tend to focus on domestic and regional markets for high returns, which provides for attractive exits. This strategy also supports the stabilization of local companies and makes them attractive to a wider investor community.
FIGURE 5.22 Potential Stock Market Winners
Note: primary economies in bold, secondary economies in italic.
Risks need to be managed but with lower leverage, private equity investee firms also present lower risks during times of stress.
1. Special thanks to David Wilton, head of private equity investments, IFC, for providing the data and supporting material/presentations as well as his profound insights.
2. Emerging Markets Private Equity Association—EMPEA, Industry Statistics, 2011 (published March 15, 2012).
3. Private Equity International, PEI Surveys, Asia-Pacific Private Equity Review (March 2012).
4. Yoshihara Kunio, The Rise of Ersatz Capitalism in South East Asia (Singapore: Oxford University Press, 1988).
5. Pasuk Phongpaichit and Chris Baker, Thai Capital: After the 1997 Crisis (Silkworm Books: Chiang Mai, Thailand, 2008).
6. Barclays Bank PLC prospectus and notifications to investors.