Chapter 3
Experts Are Biased and Overconfident
“How were you feeling when you got out of bed thirteen years ago, when you're looking at historical simulations? Did you like what the model said, or did you not like what the model said? It's a hard thing to back-test.”
—Jim Simons, CEO, Renaissance Technologies, LLC
While stationed in Iraq, Wes saw stunning displays of poor decision-making. Obviously, in areas where violence could break out at any moment, it was of paramount importance to stay focused on standard operating procedures, or SOPs. But, in extreme conditions where temperatures regularly reached over 125 degrees, stressed and sleep-deprived humans can sometimes do irrational things.
For example, carrying 80 pounds of gear in the frying desert sun makes you hot and uncomfortable. But many things that are necessary for survival in a combat environment, such as extra water, ammunition, and protective gear, are heavy and bulky. A completely rational thinker weighs the cost of carrying gear (profuse sweat, physical discomfort, and so forth) against the benefits (a better chance of not dying). A more emotionally driven decision maker disregards a cost/benefit analysis and goes with his natural instinct—toss all the gear, get some fresh air, hope for the best, and statistical likelihood of death be damned. An example of a rational approach to combat and an irrational approach to combat are highlighted in Figure 3.1.

Figure 3.1 Rational and Irrational Behavior
In Figure 3.1, Wes is situated at a combat checkpoint in Haditha, a village in Al Anbar Province of Iraq. Wes is explaining to his Iraqi counterparts how to set up a tactical checkpoint. A quick inspection of the photograph highlights how a stressful environment can make some people do irrational things. Wes and his Iraqi friend to his right in the photo are wearing their Kevlar helmets, carrying extra ammunition, and have a water source on their gear. The Kevlar is important because mortar rounds are periodically inbound. Rational reaction: Wear Kevlar to prevent hot metal fragments from entering one's head! The ammunition is important because one needs ammunition in a gunfight. Rational reaction: Carry ammo! Finally, water is important, because in 125-degree weather, a lack of hydration can lead to heat stroke. Rational reaction: Carry water! And while all of these things sound rational, the Iraqi on the far right isn't wearing a Kevlar, isn't carrying extra ammo, and doesn't have a source of water.
Is our irrational Iraqi friend abnormal? Not really. All human beings suffer from behavioral bias and these biases are magnified in stressful situations. After all, we're only human.
The conditions we describe in Iraq are analogous to conditions investors find in the markets. Watching our hard-earned wealth fluctuate in value is stressful—and although it is not as stressful as being in a war, it is still emotionally taxing. Stressful situations breed bad decisions. To minimize bad decisions in stressful environments, we need to deploy systematic decision-making.
The Marine Corps solution to bad decision-making involves a plethora of checklists and SOPs, as discussed earlier. To ensure these processes are followed, the Corps is religious about repetitive training. The Marines want to “de-program” our gut-instincts and re-program each Marine to “follow the model.” And while this might sound a bit Orwellian, automated reactions in chaotic situations give us the best chance of survival. In combat, something as simple as a dead battery in a radio, or a forgotten map, can be the difference between life and death. To make good decisions in stressful situations, Marines follow a rigorous model that has been systematically developed and combat-proven. The lesson seems to be clear: in order for decision-making to be effective, it must be systematic. But to understand why systematic decision-making is important, we must first understand why ad-hoc decision-making is flawed.
The Biased Brain
Humans are not wired to engage in detailed cost/benefit analysis decision-making all of the time. It is too cognitively demanding. Natural selection has blessed—and cursed—us with efficient decision-making shortcuts known as heuristics. There are many heuristics our minds use to keep us working in our day-to-day lives. We highlight some of the more important heuristics and how they can lead to flawed decision-making in the context of financial markets. We cover the following in this chapter:
- Anchoring
- Framing
- Availability
- Physical state
- Overconfidence
Anchoring
Stimuli from the environment affect our discretionary decisions subconsciously. Oftentimes, we don't even know we are vulnerable to these subconscious actors on our conscious decisions. One important example is anchoring. Broadly defined, anchoring describes our tendency to rely too heavily, or anchor, on irrelevant information when making decisions.
An example comes from research by Professors Simonson and Drolet, who study how consumer behavior is affected by irrelevant anchors (Figure 3.2).1 The researchers ask buyers to assess their willingness to pay for a variety of products, to include a Black & Decker toaster. The setup is simple. Group A is asked how much they are willing to pay for a toaster. Group B is asked the same question; however, the researchers play a sinister trick on these hapless consumers. The Group B buyers are asked to write down the last two digits of their social security number (SSN) prior to asking the question about willingness to pay. The anchoring hypothesis predicts that buyers with higher SSN values will be willing to pay a higher amount and those with lower SSN will be willing to pay a lower amount.

Figure 3.2 Anchoring Example
Remarkably, the value for the last two digits of one's social security number actually influences the buyer's willingness to pay. Buyers with SSNs above 50 report a willingness to pay $32.50, whereas, buyers with SSNs less than 50 report being willing to pay $25. Those in the control group, who were not asked their SSN in advance, reported being willing to pay an average price of $30. The researchers repeat this experiment on different consumer products (phones, backpacks, headphones, etc.) and find similar results. The evidence from this study—and many similar studies—highlight the power of anchoring on our decision-making process (see Figure 3.3).
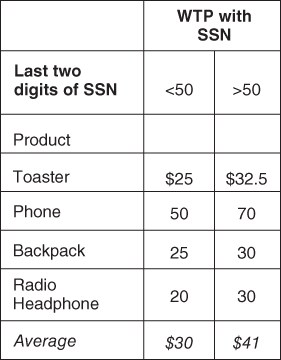
Figure 3.3 Anchoring Example Results
Marketing departments and retailers around the world are aware of this powerful effect and deploy it against us every day. Think about the last time you went to the store and found an item “on sale.” “Wow!” you might think, “I can get this $80 shirt for 40 percent off!” The dramatic discount and the high price anchor triggers an emotional response, which make us more likely to buy the shirt! The same tactic is used by real estate brokers, car salesmen, and teenagers every day. The original purchase price acts as an “anchor,” which subliminally impacts our “rational” minds and nudges us toward making a purchase.
But how might anchoring affect a professional stock-picking portfolio manager? Imagine the manager is conducting a discounted cash-flow analysis to determine a “buy” or “sell” recommendation. Her model requires an entry for what she believes to be the company's 10-year revenue growth forecast. Immediately before she enters in her assumption, two scenarios play out:
- The manager's assistant walks in and mentions that her prior meeting with a new client has been moved to the 5th of January.
- The assistant walks in and mentions that her prior meeting with a new client has been moved to the 30th of January.
The only difference in the two scenarios is the mention of “5th” and “30th.” Is the manager going to enter the same revenue growth projection in both these scenarios? If Professor Kahneman's description of the strength of the anchoring bias is accurate, it is likely she will enter a higher growth rate number in the “30th” scenario:
“[Anchoring is] one of the most reliable and robust results of experimental psychology.”2
Anchoring suggests that the portfolio manager will enter different growth forecasts into the model in these separate scenarios. The scariest part is that the manager won't even know this subliminal nudge is occurring, because anchoring effects are influencing the decision-making process subconsciously.
Scary stuff.
Framing
Framing is another bias that creeps into our minds behind the scenes and influences our behavior. The framing bias occurs because different ways of presenting information can evoke different emotions or alter our perceptions, which then leads to different decisions.
Consider the two middle circles in Figure 3.4.3 Even though the middle circles are the same size, it appears that the circle on the right is larger than the one on the left because of framing. The right circle is surrounded by smaller circles, causing our brains to perceive the right circle as being large when compared with the surrounding smaller circles. However, the left circle is surrounded by larger circles, leading our brain to interpret it as being relatively smaller than the right circle. Go ahead, stare at the circles as long as you'd like. Our brains are programmed to perceive the two circles differently, based on the context, or frames, even though they are exactly the same size.
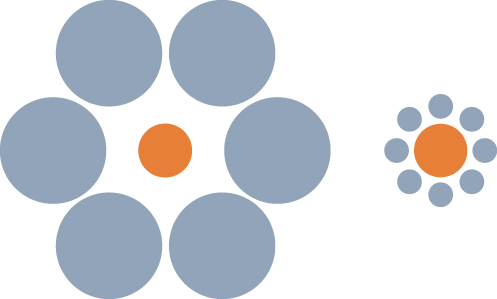
Figure 3.4 Framing Effect
Amos Tversky and his colleagues study framing by changing how questions are asked.4 They find that the same information can be conveyed using two different frames and people will respond in completely different ways, depending on which frame is used.
We highlight a few representative examples below:
Do you prefer ground beef that is:
- 75 percent lean?
- 25 percent fat?
Who would ever want “fat” beef? Most people will choose ground beef that is 75 percent lean over 25 percent fat, without recognizing that the questions are exactly the same.
Another example:
Do you prefer a medication that has a:
- 90 percent chance of keeping you alive?
- 10 percent chance of killing you?
Our brains immediately think, “Staying alive or dying?—that's an easy question. I choose staying alive.” Of course, we have to strain a bit to realize that the two propositions are exactly the same.
One doesn't have to think too hard to see how a financial advisor with training in psychology could influence her customers. Consider once again the financial advisor we discussed earlier, who tells her client the following:
“Stocks are better for the long run because they earned 9.91 percent a year from 1927 through 2013.”
Take that same financial advisor, but have her frame the information a bit differently:
“Stocks are better for the long run because they grew $100 into $371,452 from 1927 through 2013.”
This same advisor frames the information in a chart, shown in Figure 3.5.
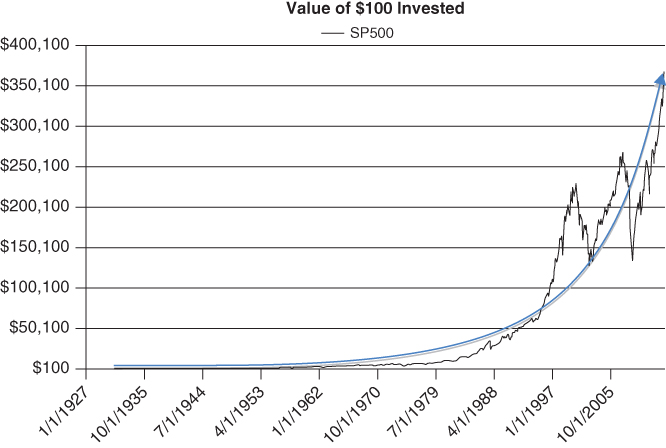
Figure 3.5 Value of $100 Invested
Although the advisor technically offered the exact same information (stocks grew at 9.91 percent from 1927 to 2013), the framing of the second statement, alongside a fancy chart that enhances the framing effect, might encourage a client to allocate more to stocks. The thought of turning $100 into $371,452 is much more appealing at first glance than earning a comparatively “measly” 9.91 percent a year, which is an abstraction with less immediately perceived value. We are poor natural statisticians, and interpreting geometric growth rates is not intuitive to the human mind.
Availability Bias
Availability bias is an artifact of System 1, which causes our mind to overemphasize the importance of recent or easily recalled information. An applied example: Imagine that someone asks you whether there are more English words that begin with a k or have k as the third letter. Your mind is slowly churning: kid, kiss, key…
Did you think of any words with k as the third letter?
Probably not—it's difficult to recall these words. By contrast, words starting with a k spring effortlessly to mind. Naturally, words that start with a k must therefore be more prevalent in the English alphabet, right? Wrong. There are three times as many words that have k in the third position in the English language than there are words beginning with k.5
We see availability bias in a number of contexts when there is an availability shock in the news media. Two examples include the Fukushima Nuclear Disaster in Japan (see Figure 3.6) and the BP oil spill in the Gulf of Mexico (see Figure 3.7).
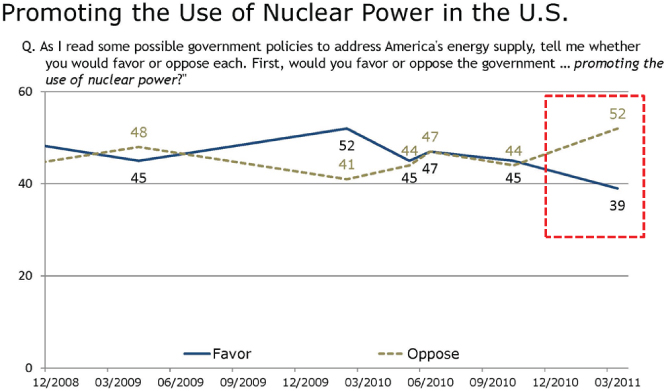
Figure 3.6 Promoting the Use of Nuclear Power in the US
Source: This graph is attributed to Jenkins Research, LLC. The data source is from Pew Research Center.
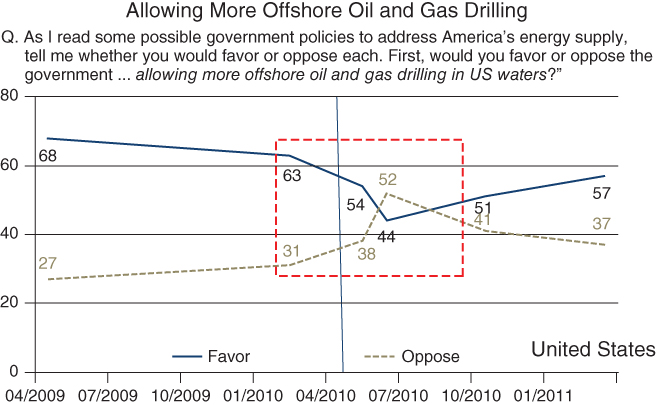
Figure 3.7 Allowing More Offshore Oil and Gas Drilling
Source: This graph is attributed to Jenkins Research, LLC. The data source is from Pew Research Center.
Pew Research Center conducts periodic sentiment polls on the use of nuclear power and oil and gas drilling in the United States. The polls clearly show how recent events—especially those spectacularly displayed in the media—can change implicit assessments of disaster probabilities. For example, sentiment on the use of nuclear power in the US shifts from an even split in June 2010 to 52 percent opposed and 39 percent in favor in March 2011, at the time of the Fukushima disaster. Similarly, in March 2010, 63 percent favored and 31 percent opposed offshore oil and gas drilling. However, after the BP oil spill disaster in the Gulf of Mexico, the June 2010 poll numbers showed 44 percent favored and 52 percent opposed offshore drilling.
Perhaps you don't believe this would affect investors? All one needs to do is read the Franklin Templeton Annual Global Investment Sentiment Survey, which asked investors—after the fact—to estimate the S&P 500 index performance for 2009 and 2010.6 The survey said that 66 percent of investors believed the S&P 500 was down or flat in 2009, when the S&P was up 26.5 percent; 49 percent thought the market was down or flat in 2010, when the S&P was up 15.1 percent. The massive drawdown associated with the 2008 financial crisis obviously left a stinging—and available—impression on market participants.
Physical State
Are you a fellow coffee addict drinker? If we don't have our coffee in the morning, we feel sluggish, our heads start nodding, and crankiness abounds. And we are certainly not the exception. If you were to lay out a set of financials in front of us and demand an earnings forecast, we guarantee you that our answer would be highly dependent on our coffee consumption that morning. Physical state, while often overlooked by those discussing behavioral finance, is probably the most intuitive and compelling reason why a human expert can have the same set of facts, and yet arrive at different conclusions.
An interesting empirical study highlights the power of basic biological impulses (in this case, circadian rhythm) on the human mind. Bodenhausen conducts a study highlighting varying degrees of discrimination exhibited by individuals who self-identify as either “morning types” or “evening types.”7 Each individual is asked, at different times of the day, to state his opinion on the guiltiness of a suspect associated with an alleged crime. The descriptions of the suspects are purposely stereotyped in a way that should appeal to innate discrimination, thereby triggering System 1 heuristic decision-making.
The author tabulates the results for the perceived guilt by time of day for all participants in the study. Figure 3.8 breaks out the results for the 9:00 a.m. and 8:00 p.m. surveys for both morning and evening types. Morning types were more likely to give a suspect the benefit of the doubt when they were feeling bright and chipper early in the day, but much more likely to view the suspects as guilty when asked later in the day when their minds were wandering. Evening types exhibited the same pattern, but in reverse. Suspects were more likely to be considered guilty by the evening types in the morning, when they were presumably grumpier and less aware, but these same individuals were more lenient on suspects when asked in the evening, during a time when they were feeling more wakeful.
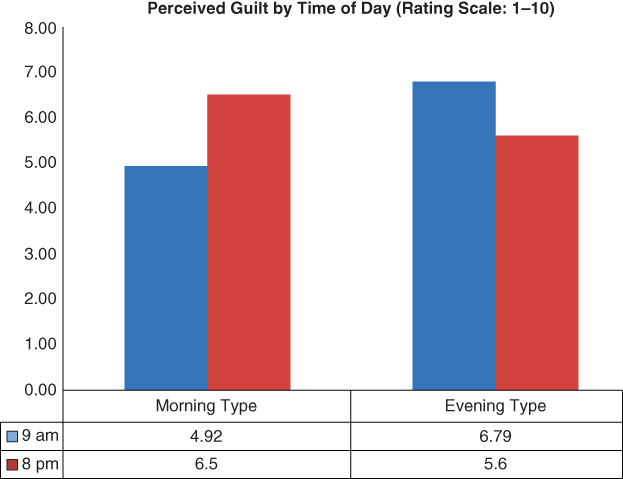
Figure 3.8 Perceived Guilt by Time of Day
Overconfidence
Overconfidence, or the inability to appropriately calibrate our forecasts, is often cited as among the most robust empirical finding in psychology experiments.
Let's try a game.
Spend a couple of minutes identifying a low- and high-value answers to the questions in Table 3.1, such that you are 90 percent confident the answer lies in between your upper and lower bound. To be clear, answering “negative infinity” and “positive infinity,” while clever, is missing the point of the game. You want to calibrate your upper and lower bound appropriately: not too cold, not too hot—just right. Go for it.
Table 3.1 Ten Question Overconfidence Test
| Low | High | Units | |
| Martin Luther King's age at death | ____ | ____ | |
| Length of Nile River | ____ | ____ | Miles |
| Number of countries that are members of OPEC | ____ | ____ | |
| Number of books in the Old Testament | ____ | ____ | |
| Diameter of the moon | ____ | ____ | Miles |
| Weight of an empty Boeing 747 | ____ | ____ | Pounds |
| Year in which Wolfgang Amadeus Mozart was born | ____ | ____ | |
| Gestation period (in days) of an Asian elephant | ____ | ____ | |
| Air distance from London to Tokyo | ____ | ____ | Miles |
| Deepest (known) point in the oceans | ____ | ____ | Feet |
If you are like most people who play this game, you are reliably overconfident. Wes has collected ad-hoc experimental evidence on around 2,000 subjects who have taken this questionnaire. He finds that individuals typically get 30 percent correct, when a well-calibrated individual should, on average, get 90 percent correct, consistent with the 90 percent confidence interval. This low-scoring result holds even when Wes warns test-takers that prior test-takers have been systematically overconfident in their upper and lower bounds. Wes then encourages them to increase the bounds of their ranges. Of course, nobody listens, and on average, only three-tenths of the correct answers actually sit within the individual's confidence range. We are hard-wired to be overconfident.8
A common example of such overconfidence used to occur in the office when talking about sports. Jack is the resident sports expert. He is an avid fan of most sports and can easily recall random statistics for many teams and players. However, in the past, Jack used to be very certain about the outcome of games, and would let everyone know. But a funny thing happened to our “expert” when we began measuring his success rate: It was not as high as his confidence! Over the years (especially as we were writing this book), he learned to limit his “guarantees” with regard to the outcome of sporting events. While we all have some topic that we follow all the time (such as Jack with sports), the reality is that we may be overconfident in our own ability to predict future events. What cognitive biases are causing us to be overconfident? One answer may lie in our human desire to pursue and misuse useless information. Our brains immediately interpret more information as better information, which leads to more confidence, with no corresponding increase in forecast accuracy.
There is a compelling study by Bastardi and Shafir illustrating this effect that is appropriately titled, “On the pursuit and misuse of useless information.”9 The paper is filled with experiments that show our brain's inability to properly process information in a variety of circumstances. The abstract of the paper says it best:
“Decision makers often pursue noninstrumental information—information that appears relevant but, if simply available, would have no impact on choice. Once they pursue such information, people then use it to make their decision. Consequently, the pursuit of information that would have had no impact on choice leads people to make choices they would not otherwise have made.”
Below is an example experiment from Bastardi and Shafir's research. The authors ask different groups to make a decision on a mortgage application. One group is faced with the following information set:
Group 1: Imagine that you are a loan officer at a bank reviewing the mortgage application of a recent college graduate with a stable, well-paying job and a solid credit history. The applicant seems qualified, but during the routine credit check you discover that for the last three months the applicant has not paid a $5,000 debt to his charge card account.
- Do you approve or reject the mortgage application?
Group 1 approves only 29 percent of the applications and rejects 71 percent.
The authors play a trick on the second group by leading them to believe they have more information. The hypothesis is that the subjects will interpret their supposed “special information” as information that can lead to a more accurate decision.
Group 2: Imagine that you are a loan officer at a bank reviewing the mortgage application of a recent college graduate with a stable, well-paying job and a solid credit history. The applicant seems qualified, but during the routine credit check you discover that for the last three months the applicant has not paid a debt to his charge card account. The existence of two conflicting reports makes it unclear whether the outstanding debt is for $5,000 or $25,000, and you cannot contact the credit agency until tomorrow to find out which is the correct amount.
- Do you approve or reject the mortgage application or wait?
Only 2 percent of the respondents approve the application, while 23 percent reject the application, and a majority (75 percent) chooses to wait for the additional information. For the majority who wait a day to get the additional information, the authors present them with the following tidbit:
The next day, they find out the amount is $5,000.
- Do you approve or reject the mortgage application?
For the majority who held out, 72 percent approve the application and 28 percent reject the application. In sum, for group 2, 56 percent approve the application and 44 percent reject the application. The approve rates are substantially higher than for group 1.
What is going on in this experiment? The authors have effectively given group 1 and group 2 the exact same information set, but because it is meted out over time, the second group perceives they have more information, which changes their decision-making process. Humans are cognitively inclined to overvalue information that requires effort or time to obtain.
To underscore the point that more information doesn't necessarily translate into better decisions, Professor Claire Tsai and colleagues directly test the relationship between information and forecast accuracy.10 The rational hypothesis suggests that each information piece received will be appropriately weighted and integrated into a forecast (the econ hypothesis). Confidence in the forecast will be updated via appropriate statistical means (i.e., Bayesian updating). The irrational hypothesis is that humans will interpret more information as better information, without considering whether the additional information actually enhances their forecast ability (the human hypothesis). The prediction is that forecast accuracy will not improve as people receive more information, but their confidence in their forecast will increase linearly with more information.
The authors collect subjects who self-identify as being knowledgeable about college football. They present different subjects with up to 30 data points. The subjects are then asked to present a forecast for football game outcomes and their confidence in their forecast. To spice things up a bit, the researchers give the subjects the information set in such a way that they received the most predictive pieces of information first while each subsequent piece of information was less and less useful for predicting football game outcomes. In Figure 3.9, we highlight the summary results from the paper. The dark line represents the accuracy of subjects' forecasts over successive trials (where with each trial they are given more information); the dotted line represents the subjects' confidence with respect to their forecast.
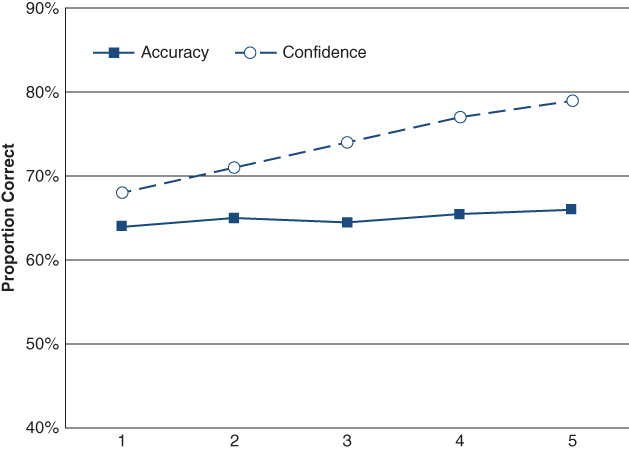
Figure 3.9 Overconfidence
The results of the study support the human hypothesis and reject the econ hypothesis. Humans incorrectly interpret more information as being better information than it really is. Their forecast accuracy does not improve with more information, but their confidence in their forecast grows linearly with the amount of information received.
How does the overconfidence effect play out in the financial realm? In another study, a team of scientists examines the effects of incremental information on market traders' forecasting ability and their confidence.11 The researchers create an experimental trading lab where traders are randomly given different information sets with nine different levels of information. Information set I1 has no information about the market, while information set I9 is essentially inside information, with a nearly perfect picture about the future price of stocks. Once traders receive their information sets, they play a live trading game where the subjects try to maximize their returns. The intent of the experimental design is to capture an element of the real-world marketplace where some traders are better informed than others and these traders trade with each other in financial markets.
The results are shown in Figure 3.10, where the returns are shown net of the market. So a positive return means the investor beat the market, a negative number means the investor lost to the market, and a score of 0 means the investor tied the market. Amazingly, only the most informed traders with complete insider information can reliably beat the market. While it is unsurprising that a total insider could beat the market, it is striking that the partially informed traders do not. While the partially informed traders should outperform the market because they have privileged information, they do not, largely because they suffer from overconfidence and overvalue their own information set, and are therefore unable use it effectively. In fact, partially informed traders, on average, underperform. Uninformed investors, who know they have no information, are less likely to suffer from the cognitive bias of overconfidence, and thus end up achieving the market return, which in this experimental setting, is an admirable achievement.
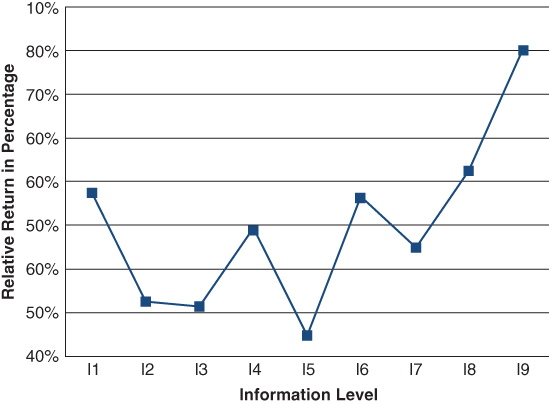
Figure 3.10 Nine Levels of Information
What are we to make of this study? Is the takeaway that insider information is helpful for generating market-beating returns? Well, no kidding. In a game setting, we would all trade on insider information if we had it (and of course, assuming it was legal). However, in the real world, we must weigh the benefits of beating the market against the direct costs of being holed up in a cell wearing an orange jumpsuit and the indirect costs of having to shamefully stare into the jailhouse mirror every morning.
And for the rest of the traders in the marketplace with a partial information sets? These investors should be wary of interpreting their information as a way to enhance performance. If experimental evidence is any guide, it is more likely that additional information is causing us to make worse decisions, not better decisions. We must always ask ourselves if the information we are collecting is adding value by enhancing our forecasts or detracting from value by making us more overconfident.
In addition to correctly assessing the value of information we receive, we must avoid self-attribution bias, which is our innate desire to attribute good outcomes to skill and bad outcomes to bad luck. A good trade does not necessarily imply that the investor was better at “doing his homework,” nor does a bad trade necessarily imply that the investor did a poor job of “doing his homework.” And yet, our minds will often attribute a successful trade to our wonderful ability to collect and interpret mounds of filings submitted to the SEC, our ability to do the “hard work” of conducting channel checks on suppliers and customers, and our magnificent skill in being better than the average investor in the marketplace. Of course, when we endure a poor trade, we don't attribute the bad performance to a lack of skill, but instead, the bad trade can be squarely blamed on bad luck: an unforeseen change in government policy, or perhaps a remarkable change in the price of underlying commodities that “nobody could have seen coming.”
A better approach for dealing with success and failures is to systematically discount success and overemphasize failures. Flip self-attribution bias on its head, or as Charlie Munger, vice chairman of Berkshire Hathaway, has promoted from time to time as a useful guiding principle, “Invert; always invert.” While unappealing to most, reiterating that we are not as smart as we thought we were and realizing the pain of bad decisions can actually make us stronger, since it is a more accurate representation of reality. As the saying goes in the Marine Corps, “Pain is weakness leaving the body.”
Overvaluing additional information and attributing success to our “personal skill” is a dangerous trait we should all monitor and be aware of. These two forces contribute to systematic and predictable overconfidence. For sports predictions, the bias is relatively harmless and amusing; however, the same bias, when deployed in the financial realm, can have disastrous consequences. Be wary of experts and their incremental information. It's not as valuable as you (and they) might think.
Summary
In this chapter, we reviewed Wes's experience in Iraq, and how stressful combat conditions could drive soldiers to make irrational choices that were clearly inconsistent with their instinct to survive. In parallel, we examined specific biases that can impair human judgment. These include anchoring, framing, availability, effects of physical state, and overconfidence. The results, and takeaways, are strikingly similar. Human beings, including experts, suffer from subconscious biases. Unrelated data points and occurrences (ran out of coffee filters, CNBC reported earnings for Malaysian toothpaste companies, etc.) can subconsciously alter our decision-making. From bricklayer to hedge fund manager, the impacts are the same—we all suffer from subconscious bias.
Notes
- 39 yrs
- 4,187 miles
- 13 countries
- 39 books
- 2160 miles
- 390,000 pounds
- 1756
- 645 days
- 5,959 miles
- 36,198 feet