15: DAX Topic: Time Intelligence
Time intelligence is a very important and powerful feature in DAX. Time intelligence refers to the ability to write formulas that refer to other time periods within a visual without needing to change the time filters. Consider the following matrix, which shows sales for the year 2003.

Now what if you wanted to see the sales for the preceding year as well as the change in sales compared to the preceding year? Well, one thing you could do is to toggle the filter between the calendar years 2003 and 2002 to see the results for the preceding year, or you could bring CalendarYear and place it on Columns and then filter out the years that you are not interested in, as shown below.

But doing it this way is a bit of a hack, and it isn’t reusable in other matrixes without doing further hacks. And besides, you can’t calculate the change compared to the preceding year.
Using Time Intelligence Functions
You can use time intelligence functions to create new relative measures, such as [Total Sales Last Year], as discussed above without having to change the date selections in the matrix to see the prior year. This makes everything easier to do, and it also means you can build visuals, like the one shown below, that would not be possible any other way.

DAX comes bundled with a number of inbuilt time intelligence functions, and you can also write custom time intelligence functions yourself when needed. There are some limitations to the inbuilt time intelligence functions, and they work only under certain circumstances. These are a couple of the rules for using inbuilt time intelligence functions:
- You must have a Calendar table that contains a contiguous range of dates that covers every day in the period you are analysing. Every date must exist once and only once in the Calendar table. You can’t skip any dates (e.g., you can’t skip weekend dates just because you don’t work weekends).
- Inbuilt time intelligence works only on a standard calendar—that is, a calendar like one that you might hang on a wall, where the start of the year is January 1, the end of the year is December 31, the last day of May is May 31, etc. A standard calendar can also be customised for different financial years (e.g., you can set the end date for a calendar to be June 30 instead of December 31, or any other date for that matter).
If for some reason these rules can’t be met, then you can’t use the inbuilt time intelligence functions. In such a case, you can write your own custom time intelligence functions from scratch, using FILTER(). The DAX for this tends to be a bit complex, but don’t worry, you can learn it and I explain it later in this chapter.
In some cases, you may need to use a nonstandard calendar for your reports. These are some examples of when you could not use a standard calendar:
- When you are building a data model using weekly or monthly time periods and using a weekly or monthly calendar instead of a daily calendar. (Note that you could load your data weekly or monthly and still use a daily calendar—and this would still work with inbuilt time intelligence, as long as all the other criteria were still met.)
- If you use an ISO or 445 calendar for your accounting periods. This is very common in the retail industry, where businesses want to have regular trading periods. In the case of a 445 calendar, there are 2 months that consist of 4 calendar weeks followed by 1 month with 5 calendar weeks. This helps smooth the months so they all start on a Monday and finish on a Sunday (for example) while also having 91 days in the quarter (91 × 4 quarters = 364 days)
- With 13 4-week periods instead of calendar months.
- If you had a calendar that uses time as well as date (e.g., an hourly calendar).
There are so many variations that it is impossible to mention them all here, and it is also impossible for Power BI to cater for them all with inbuilt functions. So the rule is, if you have a standard calendar, you can use the inbuilt functions. If you don’t have a standard calendar, then you need to write your own custom time intelligence using FILTER().
Here’s How: Turning Off Auto Date/Time
At this writing, Power BI has a feature called Auto Date/Time that acts like an automatic time intelligence feature for anyone who doesn’t want to learn about calendar tables and time intelligence. I personally do not like this feature. It automatically creates time intelligence–like behaviour for every table in your data model that has a date column—which can make your data models very large very quickly. Besides, you are learning to write DAX, so why not learn to do it properly with a dedicated calendar table? I recommend that you turn off the Auto Date/Time feature. If you want to do so, follow these steps:
1. Select File, select Options and Settings, and select Options.
2. Navigate to the Current File section and choose Data Load (see #1 below).
3. Uncheck Auto Date/Time (#2).
At this writing, it is not possible to turn off the Auto Date/Time feature by default; you must do it for each workbook.

Inbuilt Time Intelligence
Before using the inbuilt time intelligence functions, you need to validate that the prerequisite requirements are covered.
Using a Contiguous Date Range
In the sample data that you have been working with, the Calendar table already contains all the days of the year for the period that covers the Sales table. It is easy to check this. Just create a new matrix, put 'Calendar'[CalendarYear] on Rows, and drop any string-based column (such as MonthName) into the Values section. After adding MonthName to the Values section (see #1 below), click the drop-down arrow and change the settings so that Values displays Count (#2).

You’re right. I did tell you never to create implicit measures unless you are just doing a quick test. This is one of those cases where it is fine to use them, though. These are not wrong; it is just that you can’t reuse implicit measures inside other formulas. In this case, I don’t need to reuse this measure, so it is fine. As you can see above, the Calendar table has half a year for 2001 plus a full year for each of the following three years (including a leap year for 2004). Now that I have confirmed the data in my Calendar table, I can just remove this implicit measure from my visual as I don’t need it any more.
The SAMEPERIODLASTYEAR() Function
Let’s look at an inbuilt time intelligence function you can use to easily write the [Total Sales Last Year] measure discussed earlier.
First, set up your matrix like the one below, with 'Calendar'[CalendarYear] on Rows and [Total Sales] on Values.
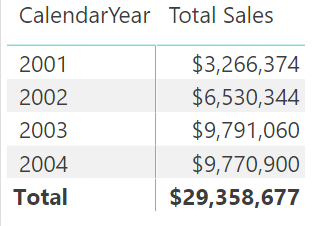
Right-click on the Sales table, select New Measure, and write the following measure:
Total Sales LY
= CALCULATE([Total Sales],
SAMEPERIODLASTYEAR('Calendar'[Date])
)
As shown below, if you pause after typing SAMEPERIODLASTYEAR(, IntelliSense says that this function will return a list of dates from the current filter context but time shifted back by a year.

You should recognise that SAMEPERIODLASTYEAR() is a table of values and that that table is being used inside CALCULATE() as an advanced filter.
Note: The word Calendar is a reserved word in Power BI. Calendar is actually a function that will return a calendar table. Personally I never use this function as I think there are better ways to create calendar tables. It is still okay to call a calendar table Calendar, but you must always add single quotes when referencing the table inside your formulas, as shown in the formula above.
Also notice in the IntelliSense that SAMEPERIODLASTYEAR() takes a single Dates parameter as its only input. All inbuilt time intelligence functions ask for this Dates parameter, and it always refers to the date column in the Calendar table.
How Does SAMEPERIODLASTYEAR() Work?
In Chapter 14 I explained that CALCULATE() can take a table as an advanced filter input, and you can imagine the new table being connected to the data model. The table inside CALCULATE then filters the rest of the tables in the data model (in this case, the Calendar table and the Sales table) before CALCULATE() completes the calculation. It is exactly the same with SAMEPERIODLASTYEAR(), as shown below:
Total Sales LY
= CALCULATE([Total Sales],
SAMEPERIODLASTYEAR('Calendar'[Date])
)
In this instance, SAMEPERIODLASTYEAR() returns a table of dates that are the same dates coming from the matrix for the selected year, but SAMEPERIODLASTYEAR() time shifts the original dates back by one year.
Consider the cell highlighted in the matrix below. The function SAMEPERIODLASTYEAR() first reads the filter context from the current matrix to see which dates apply for “this year.” In this case, the filter is on CalendarYear, and the filter for this cell is 2003 (see #1 below). So the dates for “this year” are all dates from January 1, 2003, through to December 31, 2003. The SAMEPERIODLASTYEAR() function then takes the dates from the current filter context in the matrix, removes the current filters, and then time shifts them back one year before returning a table of dates from January 1, 2002, through December 31, 2002.

You can imagine the new table created by SAMEPERIODLASTYEAR()as a temporary table sitting above the Calendar table and retaining a relationship to the original Calendar table, as shown below. Remember that this is logically how it works; you can’t actually see this table.

This table is then passed to CALCULATE(), and CALCULATE() uses this temporary table to rerun the filter propagation. The temporary table (the table of dates from SAMEPERIODLASTYEAR()) filters the Calendar table, which then filters the Sales table before the calculation for [Total Sales LY] is evaluated.
Tip: Read the paragraph above a couple of times if you need to until you have it clearly in your head.
Calculating Sales Year to Date
A very common business need is to calculate figures on a year-to-date (YTD) basis. Fortunately, there is an inbuilt function for this. Before you write any YTD formula, it is a good idea to set up a matrix that will give you immediate feedback if your formula is performing as expected. It is also important to set up your matrix so that you have a continuous date range. Set up a new matrix like the one shown below before proceeding. Note the filter on CalendarYear = 2003.

Note how the periods in the matrix are contiguous (i.e., the months of the year 2003). If you didn’t have a filter on CalendarYear = 2003 but instead had CalendarYear = ALL, the matrix would show the total sales for January across all years, for February across all years, etc. This would not be a contiguous range, and hence the formula would not work.
Now right-click on the Sales table and write the following measure:
Total Sales YTD = TOTALYTD([Total Sales], 'Calendar'[Date])
Apply appropriate formatting to the measure and then add the measure to your matrix.
When you are done, it is very easy to check whether the formula is working correctly. As you can see below, I have added a new slicer (see #1 below) and turned off Single Select. To do this, go to the Format pane and select General (#2), select Selection Controls (#3), and turn off the Single Select option (#4). You can then select the months January, February, and March in the slicer, and it is easy to compare the YTD value for March YTD (#5) with the summed total of January, February, and March (#6).

Note: It is very important that you test your measures after you write them. You are a data modeller now! Along with this title comes the responsibility to check that the measures you write are returning the expected results.
This is a really good example of the benefit of writing measures in the context of a matrix. The immediate feedback you get allows you to check whether your formula is correct and is well worth the effort. Once you have written a formula, you can apply some conditional formatting to your matrix, as shown below, to get another visual clue about whether all is working well.

Practice Exercises: Time Intelligence
When writing the previous formula, you may have noticed from the IntelliSense tooltip that there are two other functions that are very similar: TOTALMTD() and TOTALQTD(). In this section you’ll get some practice using these two functions. Before you do these two exercises, make sure you set up a matrix like the one below that will give you feedback if your formula is correct. Set up the matrix like this:
1. Place CalendarYear and MonthName on Filter.
2. Filter for CalendarYear = 2003 and MonthName = January.
3. Put ‘Calendar’[DayNumberOfMonth] on Rows.
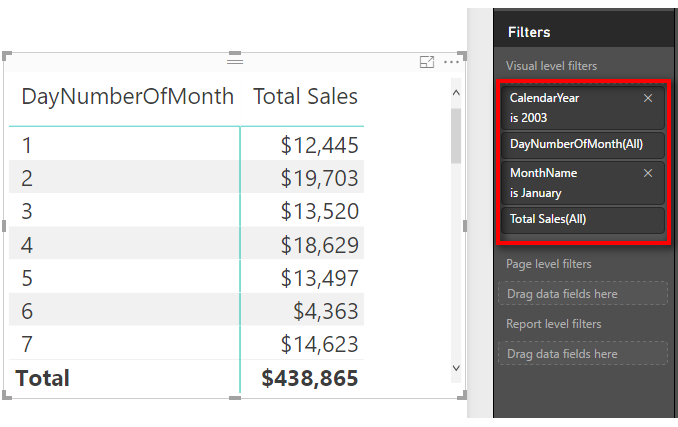
Write formulas for the following measures. Find the solutions to these practice exercises in "Appendix A: Answers to Practice Exercises" on page 214.
61. [Total Sales Month to Date]
62. [Total Sales Quarter to Date]
Tip: Did you set up a matrix with suitable values on rows like I showed with [Total Sales YTD] earlier in this chapter? Placing MonthName on rows will not work for Practice Exercise 61. Instead you need to put a column such as DayNumberOfMonth in the matrix if you want to be able to “see” that the formula is working correctly.
Changing Financial Year-Ending Dates
Many of the inbuilt time intelligence functions allow you to specify a different end-of-year date. In such a case, there will be an optional parameter where you specify the year-end date:
Total Sales FYTD
= TOTALYTD([Total Sales],
'Calendar'[Date],"YearEndDateHere"
)
Here’s an example for a financial year ending June 30:
Total Sales FYTD
= TOTALYTD([Total Sales],
'Calendar'[Date],"30/6")
Note that this example uses a non-U.S. date format. If you are using the U.S. date format, then it would be as follows:
Total Sales FYTD USA
= TOTALYTD([Total Sales], 'Calendar'[Date],"6/30")
Notice that there is no need to specify a year when referring to the year-end date. It is simply day and month.
Practice Exercises: Time Intelligence, Cont.
Write formulas for the following measures. Find the solutions to these practice exercises in "Appendix A: Answers to Practice Exercises" on page 214.
63. [Total Sales FYTD 30 June]
64. [Total Sales FYTD 31 March]
Format your matrix by selecting Conditional Formatting, Data Bars to make it easier to spot the pattern.
Practicing with Other Time Intelligence Functions
There are a lot of inbuilt time intelligence functions, and it’s easy to tell what most of them do. PREVIOUSMONTH(), PREVIOUSQUARTER(), and PREVIOUSDAY(), for example, all return tables of dates referring to the previous period and probably don’t need further explanation. To see how they work, set up a matrix with contiguous months, as shown below.

Practice Exercises: Time Intelligence, Cont.
Write the following formulas. Find the solutions to these practice exercises in"Appendix A: Answers to Practice Exercises" on page 214.
Tip: As always, I suggest that you set up a suitable matrix with a suitable column on Rows and [Total Sales] on Values before writing these measures. Doing this will help you check whether the measures are working and also should help you comprehend how the measures work. If you don’t understand, go back and re-read the section about SAMEPERIODLASTYEAR(). These functions in this practice section work in exactly the same way.
65. [Total Sales Previous Month]
Given that the PREVIOUSMONTH() function will return a table of dates, you need to embed the time intelligence formula inside a CALCULATE() function.
66. [Total Sales Previous Day]
You need to set up a suitable matrix that gives you immediate feedback about whether your formula is working. Put ‘Calendar’[DayNumberOfMonth] on Rows and make sure you filter for a single month.
67. [Total Sales Previous Quarter]
As with Practice Exercise 66, you need to set up a suitable matrix for context. You can work out how to do this one yourself.
Writing Your Own Time Intelligence Functions
As mentioned earlier in this chapter, writing your own time intelligence functions is a bit harder than using the inbuilt functions, particularly when you are learning. However, once you get the hang of it, you will find it quite easy, and this will also be a good sign of how much progress you are making in your understanding of DAX.
There are a couple of strange things in the syntax that you need to get your head around before you can fully understand what you’re doing. The good news is that I explain these things in this section, and you will be writing your own custom time intelligence functions in no time at all. These are the two concepts you need to get your head around:
- Concept 1: Thinking “whole of table” when thinking about filter context
- Concept 2: Knowing how to use MIN() and MAX()
Let me cover these concepts before we get into any examples. That way, by the time you reach the examples, you will be primed and ready to go.
Concept 1: Thinking “Whole of Table” When Thinking About Filter Context
Consider the single row highlighted in the matrix below. (This is the same matrix you were just looking at above.)
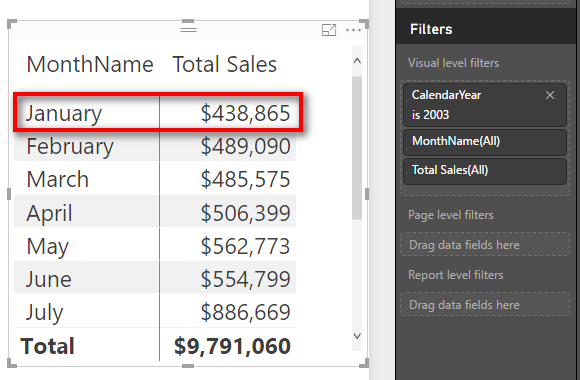
This matrix is filtered for ‘Calendar’[CalendarYear]= 2003 in the filter. Also, the highlighted row (January) is also filtered—by 'Calendar'[MonthName]="January", which appears in the Rows drop zone for the matrix. When these two filters are combined, the single cell/value for [Total Sales] is filtered for the period January 2003. So there are only 31 days that are used in the Calendar table in the data model for this cell. With this in mind, it is possible to imagine this filter applied on the back end.
Tip: Practice using your imagination to think about what these “filtered” tables would look like after the filters have been applied. (For example, in the example above, the Calendar table would have only 31 days visible.) This is all happening in computer memory, on-the-fly. You can’t peek in the back end and see this filtering happening, but it is important that you be able to imagine it happening in your mind. Thinking about what is happening behind the scenes like this will make it easier to write custom time intelligence formulas.
When thinking about the filtering that is being applied, you should think about the whole table, not just the two columns with filters applied. It is clear that there is only one month visible (January) and only one year visible (2003), but it is also true that there are 31 DayNumberOfMonth values visible (those from 1 through 31), and there are 4 different WeekNumberOfYear values (1 through 4). It is possible to reference any and all of these other columns and values in your DAX formulas after the initial filter context is applied, and this makes it very powerful indeed.
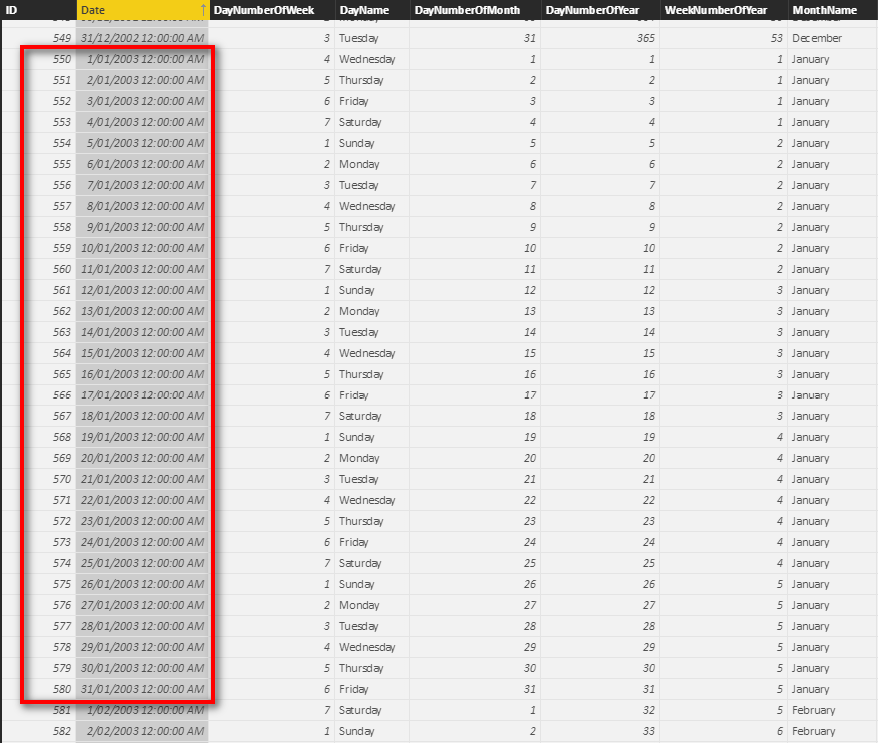
This is one of the main reasons you should also include an ID column in your Calendar table if you are going to write custom time intelligence functions. As you can see in the next image, after you filter the Calendar table based on January and 2003, there are actually 31 rows in the table, and the ID numbers of those rows run from 550 to 580. You can reference these ID values that remain in the filtered table in your DAX formulas to write very powerful DAX. But you need to be able to think “whole of table” to be able to understand how to do this.
Concept 2: Knowing How to Use MIN() and MAX()
It is very common to use the MIN() and MAX() functions inside FILTER() when you write custom time intelligence functions. (You can also use FIRSTDATE() and LASTDATE() if you prefer.) You’ll learn more detail in the examples that follow, but for now there is one key concept about MIN() and MAX() that you should understand: Whenever you use an aggregation function around a column in a DAX formula, it will always respect the initial filter context coming from the visual.
So let’s go back to the matrix from before, shown here again for convenience.
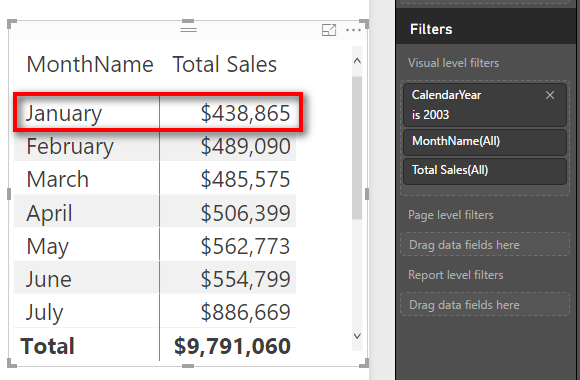
You know that the matrix has filtered the Calendar table so that only 31 days remain. Given that MIN() and MAX() always respect the current filter context, what would be the results of the following DAX formulas for the highlighted row in the matrix above? Answer in your head before moving on. It will help you if you can imagine the filtered copy of the table in your head.
1. = MIN('Calendar'[Date])
2. = MAX('Calendar'[Date])
3. = MIN('Calendar'[ID])
4. = MAX('Calendar'[ID])
The answer to Question 1 is, of course, January 1, 2003—the first date in the filter context. It’s not the first date in the Calendar table but the first date in the current filter context. And the answer to Question 2 is January 31, 2003, the last date in the filter context. But, importantly, the answers to Questions 3 and 4 are 550 and 580, respectively, even though this ID column was not part of the filter.
So you can think of MIN() and MAX() as tools that can “harvest” the value from the current filter context, in any available column across the whole table, and you can use this harvested value in your DAX formulas. Remember this fact about MIN() and MAX() when you get into the examples below.
Note: If you want to validate the answers 550 and 580, go to the Calendar table, find the rows January 1, 2003, and January 31, 2003, and check 'Calendar'[ID] for each row.
Writing Custom Time Intelligence Functions
Now you are going to write a custom version of [Total Sales YTD], using CALCULATE() and FILTER(). I strongly encourage you to write this formula yourself for practice. There is a lot that can (and will) go wrong when you type your own custom time intelligence functions, and you will need lots of practice to get it right. There are square bracket sets, sets of parentheses, new line spacing to make it easier to read, commas to be added in the right places, etc. So make sure you actually write the following formula on your own computer. Go ahead and do that now before moving on to the explanation:
Total Sales YTD Manual = CALCULATE([Total Sales],
FILTER(ALL('Calendar'),
'Calendar'[CalendarYear]=MAX('Calendar'[CalendarYear])
&& 'Calendar'[Date] <=MAX('Calendar'[Date])
)
)
Also make sure you set up a matrix like the one you used earlier so that you can get immediate feedback about whether your formula is correct.
This formula needs a bit of explanation. I have used http://daxformatter.com in the following pages to make it easier to refer to the lines in the formula. I mentioned DAX Formatter in Chapter 9, and you can see here that it is a great tool for helping you read DAX formulas.
You can see below that lines 4 through 8 are all part of a FILTER() function because you can see that the ) on line 8 is left aligned to the F in FILTER() on line 4.

This FILTER() function returns a table to the function CALCULATE(). CALCULATE() then applies a filter for this table of dates and propagates this filter to the Sales table prior to evaluating [Total Sales]. Let’s look more closely at lines 6 and 7 in the FILTER() function. Line 6 reads:
'Calendar'[CalendarYear] = MAX('Calendar'[CalendarYear])
Okay, I hear you saying, “How can the calendar year be equal to the MAX() of the calendar year?” What is really happening is that there is a column name on the left side of the equals sign, and there is a MAX() function on the right side. Remember from earlier in this chapter that whenever you see MIN() or MAX() in a formula like this, it always respects the current filter context. So the way to read line 6 of this formula is as follows: “Add a filter to the table so that the column 'Calendar'[CalendarYear] is equal to the maximum value in my current filter context coming from my matrix.”
For example, in the matrix below, the maximum of the highlighted row is March 31, 2003, and hence MAX('Calendar'[CalendarYear]) = 2003.

See how you need to think “whole of table” here? The initial filter context is applied over the month of March 2003, but the MAX() formula is working over the year column. Imagine this filter context acting on the table in your data model by mentally applying the filters: There were 31 rows left in the Calendar table, and for each of these rows, the value in 'Calendar'[CalendarYear] was 2003. As a result (in this case), the MIN() of 'Calendar'[CalendarYear] would also return 2003, as would SUM() and AVERAGE(), for that matter. So line 6 is really saying “filter my table where 'Calendar'[CalendarYear] = the current filter context year,” which is 2003 in this case.
Let’s move on. Line 7 starts with the double ampersand operator (which means and—i.e., do both line 6 and line 7) and then says:
'Calendar'[Date] <=MAX('Calendar'[Date])
The same applies here as with line 6. MAX('Calendar'[Date]) reads the initial filter context from the matrix and hence returns the value March 31, 2003, for the highlighted row in the matrix. Therefore, this part of the formula adds an AND condition so that the underlying table is filtered for 'Calendar'[CalendarYear] = 2003 and also for the condition 'Calendar'[Date] is on or before March 31, 2003. As you can deduce, this is all the dates year to date.
As you go to the next row in the matrix, the calendar year stays the same, but the month-end date moves to the end of the next month. So the number of days that are included increases as you work down the rows in the matrix.
Now it is important to point out that you could not use MIN() in line 7 as you could do in line 6; this time it has to be MAX(). If you used MIN(), you would get March 1, 2003, as the last date, and the year-to-date result would be out by almost a full month of sales. It is important to think about what your formulas need and make sure you provide the right formulas to achieve that outcome (of course).
Now let’s go back to ALL('Calendar'). Line 5 of the formula refers to ALL('Calendar') instead of just the Calendar table (which you have used previously). ALL(), as discussed in Chapter 13, is the “remove filter” function. (If necessary, go back and refresh your memory about ALL() before moving on.)
It is important to use the ALL() function here because you know that the matrix reads the current filter context before doing the calculation. Probably the easiest way to explain why you need the ALL() function is to consider what would happen if you didn’t use ALL().
Consider again the highlighted row in the matrix above. You know that the initial filter context for this row of the matrix is for all 31 days in the month of March 2003. You can “imagine” that the Calendar table is filtered behind the scenes so that only these 31 days of March 2003 are visible.
Now let’s look at why the [Total Sales YTD] formula does not work without the ALL() function. You should write the following formula and add it to your matrix, as shown below. (Don’t miss the opportunity to practice now!)


You can see in the matrix above (and in the one you have created yourself) that this formula is giving the sales for the current month rather than YTD in each row of the matrix. The reason it doesn’t work is related to the initial filter context discussed earlier. For the row of March 2003, the initial filter context applied a filter so that only the 31 days of March 2003 were “visible” in the Calendar table (behind the scenes). So how can the formula possibly return sales for all days “year to date,” including the sales from January and February? The dates in January and February were already filtered out by the matrix from the initial filter context, so you can’t get the sales for these months to somehow reappear for the new formula if you write it this way.
If you want to include sales from January and February in the row next to the actual sales for March, you must first “remove the filter” created by the matrix. This is what ALL() does when it is wrapped around the Calendar table in line 5: It removes the filter context that comes from the matrix that is automatically applied to the Calendar table. You then reapply the filters you want to use in lines 6 and 7 so that you end up with all the dates YTD.
Note: Custom time intelligence always uses some form of ALL('Calendar') to remove the initial filter context. The FILTER() function therefore iterates through an unfiltered copy of the Calendar table. But the MIN() and MAX() functions operate in the initial filter context before the ALL() function removes it.
Tip: Go back and read this section again if necessary until you understand it well.
Now let me come back to that ID column I talked about earlier. A good ID column in a Calendar table starts at 1 and increments by 1 for each row in the table. So in the case of this Calendar table, each day of the year has an ID value that increments by 1. But the same applies to 445 calendars and weekly calendars. You should always have an ID column that increments by 1 for each row in the table (in chronological order, of course). This gives you a nice clean numeric column to move back and forward inside your formulas. To illustrate this point, the following formula will work for YTD:
Total Sales YTD Manual ID = CALCULATE([Total Sales],
FILTER(ALL('Calendar'),
'Calendar'[CalendarYear]=MAX('Calendar'[CalendarYear])
&& 'Calendar'[ID] <=MAX('Calendar'[ID])
)
)
Notice that here you replace the Date column with the ID column. Using the ID column like this is very powerful and allows you to jump back and forward in time, using your knowledge of the Calendar table structure by just doing numeric addition and subtraction on the ID column.
For one more example using the ID column, write a measure that returns the total sales for the same period last year. You did this earlier, using the function SAMEPERIODLASTYEAR(), but recall that this inbuilt time intelligence function works only for a standard calendar. You can also write a custom time intelligence function that works with a custom calendar using FILTER(). Note in the matrix below that [Total Sales LY] works on both the month level and the year level.
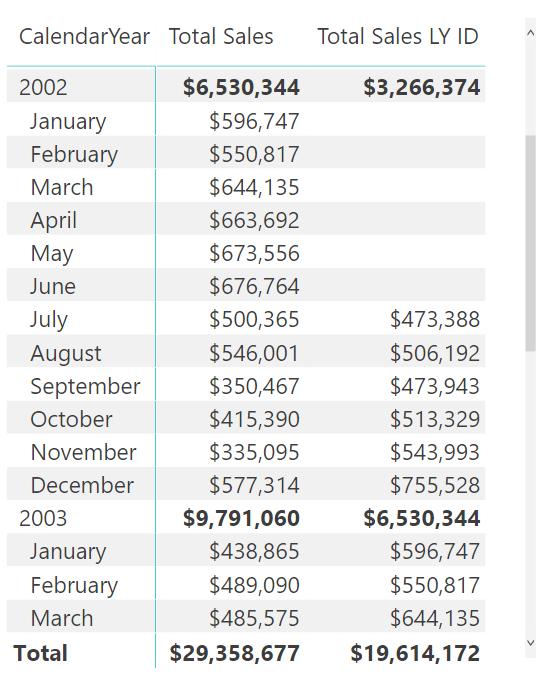
Here is the formula you need to write for this:
Total Sales LY = CALCULATE([Total Sales],
FILTER(ALL('Calendar'),
'Calendar'[ID] >=MIN('Calendar'[ID]) -365 &&
'Calendar'[ID] <=MAX('Calendar'[ID]) – 365
)
)
Note that you can use the ID column to your advantage here to move back in time by 365 days. Also note how the first reference inside FILTER() is to MIN('Calendar'[ID]), and the second one is to MAX('Calendar'[ID]). It’s time to think “whole of table” again. Let’s take a look at two different areas of the following matrix.

In the matrix cell marked #1 above (October 2003), you need to be able to visualise the Calendar table as it is currently filtered. In the case of October 2003, there are 31 rows that remain unfiltered. The first (earliest) of these rows is October 1, 2003, and it has an ID of 823. The last unfiltered row is October 31, 2003, and it has an ID of 853. So “October this year” can be thought of as:
'Calendar'[ID] >=823 && 'Calendar'[ID] <=853
And October last year can be thought of as:
'Calendar'[ID] >=823 - 365 && 'Calendar'[ID] <=853 - 365
When you write it this way, it is obvious why you use >= MIN for the first filter line and <= MAX for the second one. And the really great thing is that this works regardless of the time period you are looking at. In this first example, you are looking at a month, but if you look at the #2 in the matrix above, this time the filter context is on an entire year. The formula therefore is filtering for all periods after the first date of the entire year (1/1/2003: 'Calendar'[ID] = 550) and also for less than the last date of the calendar year (31/12/2003: 'Calendar'[ID] = 914). Once you learn to trust this “whole of table” behaviour, you will be able to very quickly write custom time intelligence formulas by referencing the ID column alone.
Astute readers will be crying foul about leap years by now. In fact, if you compare the measure [Total Sales LY ID] with the measure [Total Sales LY], you will notice that there is a different answer for leap years. Well, as I said earlier, every business is different, and different businesses handle these things in different ways. It is beyond the scope of this book to provide solutions to this problem, but you can read about some possible approaches at http://www.daxpatterns.com/time-patterns/.
In the examples above, we have used an ID column on the day level of granularity—the same level of granularity as the Calendar table. I also like to load integer ID columns for the other important columns of data in a Calendar table. For example, I like to add a MonthID column to my Calendar tables. It starts with 1 for the first January in the calendar, 2 for the first February, . . . 12 for the first December. But then it would become 13 for the second January, 14 for the second February, etc. Having a MonthID column like this makes it easy to reach back in time and grab the same monthly period from any time in the past.
Practice Exercises: Time Intelligence, Cont.
It’s time for some more practice. Write the following formulas. First set up an appropriate matrix so that you will get immediate feedback about whether your formula is correct. Find the solutions to these practice exercises in "Appendix A: Answers to Practice Exercises" on page 214.
68. [Total Sales Moving Annual Total]
With this DAX formula, you need to create a rolling 12-month total of sales. It will always show you 12 months’ worth of sales, up to the end of the current month. Think about the problem using English words first and then convert that to DAX, using the techniques you have learnt here. I show my tips for writing this measure later in this chapter, but give it a go yourself first.
69. [Total Sales Rolling 90 Days]
This is the same as the formula for Practice Exercise 68, but instead of delivering a rolling 12-month total, you will instead deliver a rolling 90-day total. Try to do this one from scratch, without referencing Practice Exercise 68. This is good practice to help you think like the DAX engine.
Tips for Writing a Moving Annual Total
This section walks through how to create the formula in Practice Exercise 68. Start by setting up a new matrix with Years and Months on Rows and [Total Sales] on Values, as shown below.
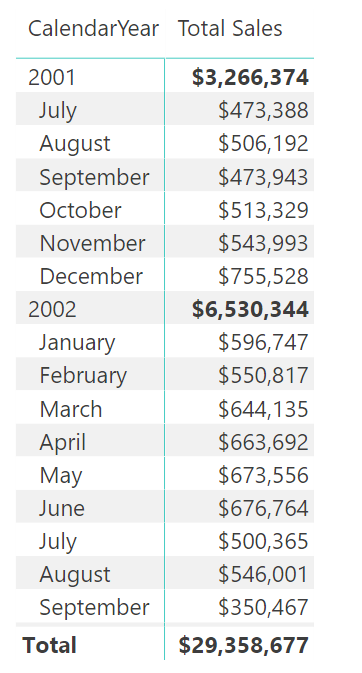
Then write your formula:
Total Sales Moving Annual Total
= CALCULATE([Total Sales],
FILTER(ALL('Calendar'),
'Calendar'[ID] > MAX('Calendar'[ID]) - 365
&& 'Calendar'[ID] <= MAX('Calendar'[ID])
)
)
Note: This is not the only way to write this formula. Just as in Excel, there are often multiple ways to write a formula in Power BI. If you have something different and it works, that’s great. Also note that this formula may not work with leap years, depending on how your business handles the extra day. (Some businesses ignore the extra day and actually have 6 × 364-day years followed by 1 × 371-day extraordinary year, so it depends.)
Now check your formulas against the matrix, as shown below. You can check the Moving Annual Total at the end of December 2002 (see #1 below) against the matrix calculated total (#2) to validate that the formula is working.

One thing to note is that the first FILTER() line in the formula says greater than, and the last FILTER() line says less than or equal to. It is easy to get these things wrong when writing formulas, but you should not worry about this because it is easy to check and verify. As long as you set up a matrix so that you can test the formulas you are writing, you can just take a guess and then change it if you need to (i.e., if you got it wrong). In this example, if you used greater than or equal to, you would end up with 366 days, which is incorrect.
But What About the First Year?
Now, if you want to get technical, the [Total Sales Moving Annual Total] result really doesn’t make sense in the first 11 months of the sales data because you didn’t have a full year of sales until the end of June 2002. There are many ways to solve this problem by using the IF() function. Here is one solution:
Total Sales MAT Improved = IF(MAX('Calendar'[ID])>=365,
CALCULATE([Total Sales],
FILTER(ALL('Calendar'),
'Calendar'[ID] > MAX('Calendar'[ID]) - 365
&& 'Calendar'[ID] <= MAX('Calendar'[ID])
)
)
)
Tip: By now you may have realised that it is easiest to copy one formula and then edit the copied version for the new formula. Indeed, this is a good idea, but try to keep the copying and changing to a minimum while you are learning. It’s a good idea to get as much DAX writing practice as you can. Once you know how to do it, using copy and paste is a great way to go faster.
There are a lot of other time intelligence functions that you can use to write time-based DAX formulas. A key piece of advice as you learn how to use these other time intelligence functions (indeed, all other DAX functions) is to do a quick online search and read the relevant information in the documentation. To do this, do a web search for the function name followed by the word DAX. In the example below, I have searched for “DATEADD DAX.”

The first result returned is normally the official Microsoft documentation (MSDN) site. When you click on this MSDN link, you see something like the following.

In many cases, the official documentation is not as useful as other websites. But there is some very important information that you can get from MSDN: the syntax, parameters, and return value. You can find the syntax and parameters by typing a formula directly into the formula bar, but sometimes the IntelliSense help doesn’t clearly tell you the return value—and this is where doing a web search can help. The return value is a key piece of information that helps you understand how to use a function. In the case of DATEADD() above, the return value is a table, and hence you would use DATEADD() inside CALCULATE() to do a time shift. So you might write something like this:
Total Sales LY DATEADD = CALCULATE([Total Sales],
DATEADD('Calendar'[Date],-1,Year)
)
This formula works on various different time horizons, including quarters as well as years, as shown below. (You may realise that this is basically the same as the SAMEPERIODLASTYEAR() example shown earlier in this chapter.)

As another example, when you do a quick search for FIRSTDATE, you find the MSDN site the first time again.

If you click through to the MSDN site, you can see that the returned value is a special table that has a single column and a single row, as shown below.

FIRSTDATE() returns a single value in a table. This is a special type of table that can be placed directly into a cell in a matrix. (Normally you cannot do this.) So you could write a formula like this:
First Date = FIRSTDATE('Calendar'[Date])

Other Time Intelligence Functions
Here is a list of other time intelligence functions that you might want to explore:
DATESINPERIOD(date_column, start_date, number_of_intervals, intervals)
DATESBETWEEN(column, start_date, end_date)
DATEADD(date_column, number_of_intervals, interval)
FIRSTDATE (datecolumn)
LASTDATE (datecolumn)
LASTNONBLANKDATE (datecolumn, [expression])
STARTOFMONTH (date_column)
STARTOFQUARTER (date_column)
STARTOFYEAR(date_column [,YE_date])
ENDOFMONTH(date_column)
ENDOFQUARTER(date_column)
ENDOFYEAR(date_column)
PARALLELPERIOD(date_column)
PREVIOUSDAY(date_column)
PREVIOUSMONTH(date_column)
PREVIOUSQUARTER(date_column)
PREVIOUSYEAR(date_column)
NEXTDAY(date_column)
NEXTMONTH(date_column)
NEXTQUARTER (date_column)
NEXTYEAR(date_column [,YE_date])
DATESMTD(date_column)
DATESQTD (date_column)
DATESYTD (date_column [,YE_date])
TOTALMTD(expression, dates, filter)
TOTALQTD(expression, dates, filter)
A Free Quick Reference Guide
I have produced (and I maintain for new functions) a quick reference guide of all DAX functions in PDF format that you may like to download and use. The DAX Reference Guide PDF is not meant to replace the online documentation but to supplement it. As shown below, the PDF is fully indexed, and you can jump to the relevant sections by clicking on the hyperlinks in the table of contents.
You can download the DAX Reference Guide for free by visiting my online shop at http://xbi.com.au/shop and then navigating to the Books section.
