18: Concept: Multiple Data Tables
So far in this book, we have used only a single data table, the Sales table. It is quite likely that you will want or need to use multiple data tables in your data models. When you bring a second data table into Power BI, it is common for people to think that they should join the new data table to the original data table, but this is incorrect. The correct way to join a second data table to a data model is to treat the new data table exactly the same as the first data table.
To help you understand how to do this, let’s look at a common business scenario in which a business wants to load a budget table as well as a sales table. One of the challenges of this scenario is that the budget is often at a different level of granularity than actual sales. For example, sales may be captured and reported every day for every individual product, but budgets may be set only for each month and for each product category.
Here’s How: Adding a Budget Table
The following steps walk you through the process of importing a Budget table, creating a new BudgetPeriod table, and then creating a measure for the budget:
1. In Power BI, click Get Data, More, Access Database and navigate to the Access database you used in Chapter 2.
2. Select the Budget and BudgetPeriod tables from the list, as shown below.

3. Click Load. You now see that the Budget table has a monthly sales budget for each category. The Period column is in the format YYYYMM for year and month, as shown below.

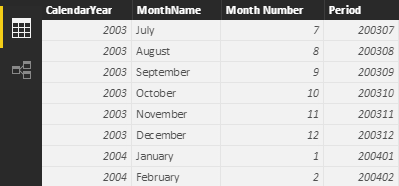
4. You can also see that the BudgetPeriod table is a type of calendar table and is different from what you have used so far. Like the Budget table, it contains a Period column in the format YYYYMM, as shown below.

5. You need a ProductCategory table, so click the New Table button and type the formula shown below.

6. The new ProductCategory table has a list of the four possible product categories.
Note: The reason you need all these new tables will make sense shortly.
7. Switch to Relationships view.
8. Rearrange your tables as shown below. Place the BudgetPeriod table (see #1 below) above the Calendar table and place the Budget table (#2) next to the Sales table. Put the ProductCategory table (#3) above the Products table, as shown.
Note: The relationship between BudgetPeriod and Budget is a physical relationship automatically created by Power BI when the New BudgetPeriod table was created. Don’t confuse this with lineage, which is an inherited relationship for a virtual table that exists only during formula evaluation.

9. Now let me explain why you need the BudgetPeriod table. Go ahead and try to join the Budget table to the Calendar table. It is a bit hard to drag and drop the Period column, so instead go to the Home tab, click Manage Relationships, and try to create a new relationship between the Budget table and the Calendar table, as shown below. Note the error message.

10. Click Cancel and close the Create Relationship window. Do you see the issue? The Calendar table is a daily calendar, but the Budget table is a monthly budget (a very common business scenario). The Period column in the Calendar table has between 28 and 31 entries for each month in the budget table. But Power BI supports only one-to-many relationships. The lookup table (Calendar) at the top simply must have a single value for Period if you are to make the join, so this is not going to work. You therefore need the BudgetPeriod table. There is only one value for each period in the BudgetPeriod table, and hence you are able to join the Budget table to the BudgetPeriod table. In fact, this relationship (see #1 below) was auto-created when the data was loaded.
11. Join the Calendar table to the BudgetPeriod table by dragging the Period column from the Calendar table to the Period column in the BudgetPeriod table (see #2 below).

12. Now you need to join the ProductCategory table to the Budget table. If you try to join the Budget[Category] column to the Products table, you get the same error as before.
13. To join the Budget table to the ProductCategory table, click and drag the column Budget[Category] to ProductCategory[Category].
14. To join the Products table to the ProductCategory table, click and drag the column Products[Category] to the ProductCategory[Category] column.
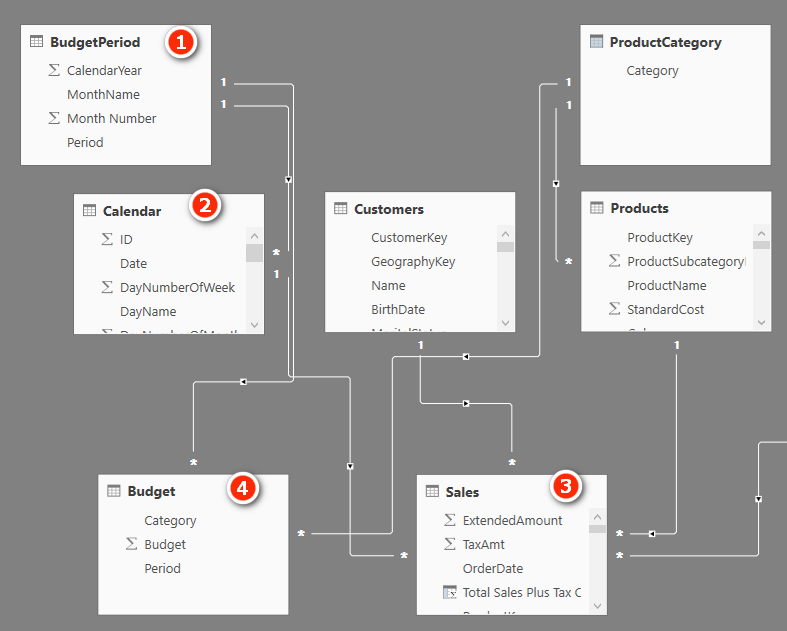
When you are finished, you should have something like the layout shown below. Notice that it becomes difficult to keep track of all the relationships when you have lots of tables in a data model. This is one reason I recommend arranging the tables using the Collie layout methodology, as shown below.

As you can see in the image above, the tables on the “many” side of the relationship should be down below, and the tables on the “one” side of the relationship should be up high. The filters always flow downhill, and this layout makes it much easier to understand how the filters flow. So if you filter on the BudgetPeriod table (see #1 above), this table directly filters the Budget table (#4) via the direct relationship. In addition, the BudgetPeriod table (see #1) directly filters the Calendar table (#2), and the Calendar table (#2) filters the Sales table (#3). So the net result is that any filter you apply to the BudgetPeriod table (#1) filters both the Sales table (#3) and the Budget table (#4). The same concept applies with the ProductCategory table.
When working with data tables of differing granularities, as in this case, it is important to use the correct tables and columns in your matrix filters. So when working with both the Sales table and the Budget table, you must use the columns from the BudgetPeriod table in your matrixes; columns from the Calendar table will not work.
Practice Exercises: Multiple Data Tables
It’s time to get some practice writing new DAX formulas across the two data tables: Budget and Sales. First, create a new matrix. Then put ProductCategory[Category] on Rows, BudgetPeriod[Period] on Rows, and [Total Sales] on Values. Make sure you select the correct columns from the two new tables (ProductCategory and BudgetPeriod).
Once your matrix is set up, click on the Expand All Down icon, as shown below, to expand all levels in the matrix.

Note that the periods shown on Rows in the image above are not formatted properly. The periods should be in the format YYYYMM, but they are displayed with commas and decimal points. This is an easy fix. Just select the BudgetPeriod[Period] column in the fields list and change the data type to Whole Number.
Now it is time to create some measures. Right-click the Budget table, select New Measure, and then write the following new measures. Find the solutions to these practice exercises in"Appendix A: Answers to Practice Exercises" on page 214.
71. [Total Budget]
72. [Change in Sales vs. Budget]
73. [% Change in Sales vs. Budget]
The image below shows what the matrix looks like with these formulas and the addition of conditional formatting.
