Measures have been around for many years in the enterprise versions of Microsoft BI tools, such as SQL Server Analysis Services. Measures have now made it into the world of business users who want to learn to create Power BI reports. There is nothing confusing or hard to learn about measures. A measure is simply a DAX formula that instructs Power BI to do a calculation on data. In a sense, a measure is a lot like a formula in a cell in Excel. The main difference, however, between a formula in a cell in Excel and a measure is that a measure always operates over the entire data model, not over just a few cells in a spreadsheet. You’ll learn more about this later, but for now you can just think of a measure as a formula that calculates a result from the loaded data.
Techniques for Writing DAX Measures
Measures in Power BI are always written in the formula bar, as shown below.

The formula bar is not visible unless you have a measure selected. When you select a measure, the formula bar appears just below the ribbon, as shown above.
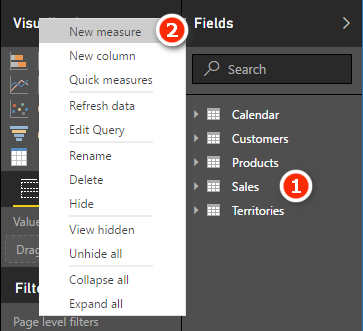
There are two ways you can start the process of writing a new measure in Power BI:

- I don’t recommend that you use this approach to create a new measure as it has one major problem: Any time you create a new measure by clicking the New Measure button (see #1 below), the measure is automatically added to whichever table you have selected in the fields list on the right (#2). It is far too easy to place the measure in the wrong table when you use this approach. I therefore recommend that you use the approach described next.

- The second way to write a new measure in Power BI is to right-click the table where you want to store the measure (see #1 below). (Best practice is to store the measure in the table where the data comes from. You’ll learn more about this later.) Then select New Measure from the menu (#2) and write the measure from there.
The approach to writing new measures described here is the best approach I have found to ensure that you get the best possible outcome with the least amount of rework. Follow these steps:
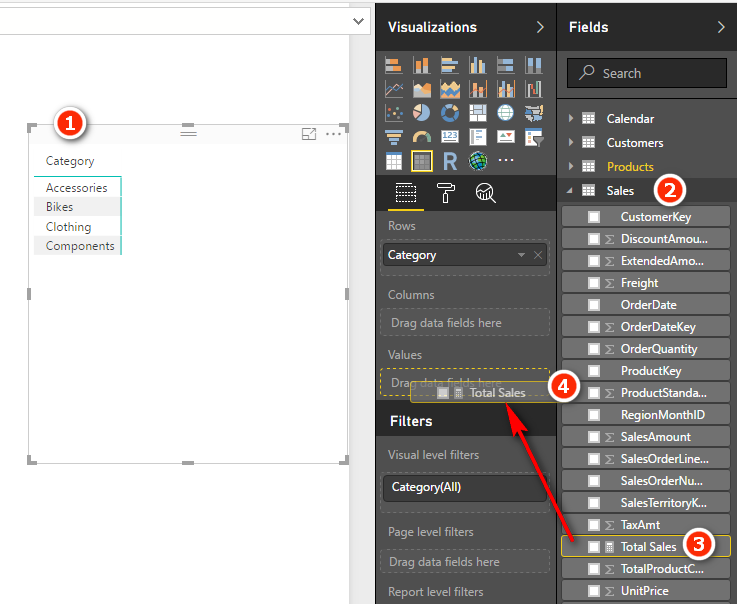
1. Create a new blank matrix (or use an existing one if you already have one set up from earlier). Make sure that you have the matrix selected on the report canvas. You can see the drag handles (see #1 below) when the matrix is selected.
2. Add some relevant data to the rows in your matrix. For the sample database used in this book, I suggest that you go to the Products table and place Products[Category] on Rows in the matrix. To do this, select the Products[Category] column (see #2 below) and then drag and drop the column into the Rows drop zone for the matrix (#3). Keep an eye out for the yellow dotted line around the drop zone. When you see the yellow dotted line, you can release the column, and it will be correctly placed in the matrix. You should always place measures in the table where the data comes from. In this case, you write the measure [Total Sales], and the “data” you are using is in the Sales[ExtendedAmount] column, which is in the Sales table.

3. Right-click the Sales table (see #1 below) and select New Measure (#2).

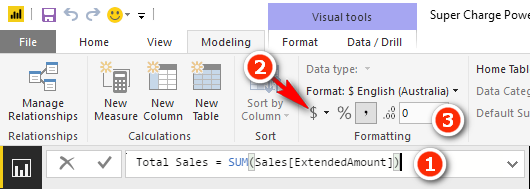
4. You now see Measure = appear in the formula bar at the top of the page, as shown below.

Note: The new measure has been given a default name, Measure, and an equals sign has been automatically added. Also note that the entire text above Measure = is highlighted in blue, indicating that it has been selected. The easiest way to proceed now is to simply type over the top of this text. Don’t waste your time and effort trying to “save” the equals sign and trying to edit the word Measure. It is just not worth the effort. It is much faster to simply type over the top.
5. In the formula bar, type in the DAX formula Total Sales = SUM(Sales[ExtendedAmount]) and press Enter. Type it directly over the highlighted text Measure =.
6. Immediately click back into the formula bar (see #1 below) and apply the formatting $ (#2), Currency General, and zero decimal places (#3) and then press Enter again. Get used to applying the formatting immediately so you don’t forget.
7. Check to make sure you still have the matrix selected by ensuring that you can see the drag handles (see #1 below), navigate to the Sales table (#2), locate the new measure [Total Sales] (#3), and drag and drop the measure into the Values drop zone for the matrix (#4).
Tip: Following this procedure will save you time because you will not have to go back and fix things you missed. Practice doing it this way right from the start, and you will develop a good habit that will serve you well in the future.
Your matrix should now look something like the one shown on the left below. You may want to increase the font size of your matrix to make it easier to read, like the one on the right below.

Here’s How: Increasing Font Size
To increase the font size in a matrix, follow these steps:
1. Ensure that the matrix is still selected (see #1 below).
2. Navigate to the Format pane (#2).
3. Select Grid (#3).
4. Change the Text Size slider to an appropriate size or enter a new font size in the box (#4).

You can add up the values in a column of numbers by dragging the column from a table (see #1 below) and dropping it in the Values drop zone for the matrix (#2), as shown below. You can then see the column in the matrix (#3). Note that you get the same answer this way as by using the measure [Total Sales].

If you then click the drop-down arrow next to the column [ExtendedAmount] (see #1 below), you can see a range of options for changing the default aggregation behaviour (#2).

When you do this, you create what I call an implicit measure (although Kasper de Jonge tells me this is not the official name). This is not wrong, but personally I am not a fan of using implicit measures, and I recommend that you avoid using them—for a number of reasons:
- The name of an implicit measure is not very helpful. Compare the name of this implicit measure, [ExtendedAmount], with the name [Total Sales] that you provided when you explicitly wrote the measure yourself. You can change the name of an implicit measure, but the name changes only for the current visual (a matrix in this case). If you later add the same column again in a different visual, you have to change the name again.
- No formatting is applied when you drag to create an implicit measure. Again, you can add the formatting, but you will have to do it each time you create an implicit measure.
- You can’t reference implicit measures inside other measures, so they have limited use.
- You won’t learn how to write good DAX if you always use implicit measures.
So do yourself a favour and don’t drag and drop your table columns. Of course, if you just want a quick look at a field for some testing, then doing this is fine. But undo the change immediately after you have taken a look. If you want to keep a measure, you should write it from scratch, using your DAX skills. It will be your skill in writing DAX that will set you apart from other users of Power BI.
Here’s How: Using IntelliSense
When you type in a DAX formula in the formula bar, I recommend that you learn to leverage the IntelliSense tooltips that appear. Follow these steps to see how it works:
1. Type a function into the formula bar, as shown below, and you see the IntelliSense pop up to show you the syntax of the function (on the first line) and also how the function works (on the second line).

Tip: IntelliSense is your friend. Reading the information it provides will help you build your DAX knowledge and skills.
2. It is best practice in DAX to always type the table name before the column name. Power BI has a very good user interface that will help you do this. If you start typing the name of any column in your data model, as shown in the example below, where I’ve typed ex, IntelliSense prompts you with the full name TableName[ColumnName], as you can see here.
Tip: Always, always, always include the table name before the name of a column in your formulas.

3. Simply use the up and down arrow keys to highlight the column you want from the list presented by IntelliSense and then press Tab to select the column highlighted in blue. The table name is then included automatically for you.
4. Finally, type ) (a closing parenthesis) and press Enter.
Tip: Try to use the keyboard and not the mouse to select from the tooltips, particularly if the list is short. This method may be slower for you to start with, but it will be faster in the long run if you learn to do it this way.
It is easy to go back and edit (or simply review) measures after you have written them. Follow these steps:
1. Find the measure you want to edit from the fields list on the right-hand side and click the measure once to select it. The formula bar reappears at the top of the page.
2. Click in the formula bar and edit the measure as required.
Here’s How: Adding Comments to Measures
Power BI allows you to add notes and comments inside the measures you write. Follow these steps:
1. Select a measure from the fields list. It should then appear in the formula bar at the top of the page.
2. Expand the size of the formula bar by clicking the down arrow if needed (see #1 below).

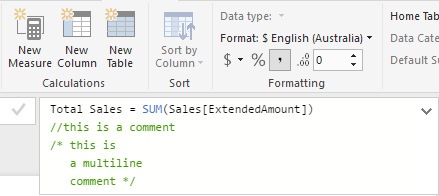
3. Start a new line in the measure by pressing Shift+Enter.
4. Add comments as shown below. Use a double slash (//) at the start of a single-line comment and use the /* */ pattern to create a multi-line comment, as shown below.
When Something Goes Wrong as You Write DAX
At some point, you will start the process of creating a new measure, and something will go wrong. For one reason or another, you will need to stop what you are doing and go and do something else. In cases where you are partway through writing a formula but it is not finished, you can use the comments feature so that you don’t have to scrap your measure.
Consider the following complex partially written measure (which is not from AdventureWorks).
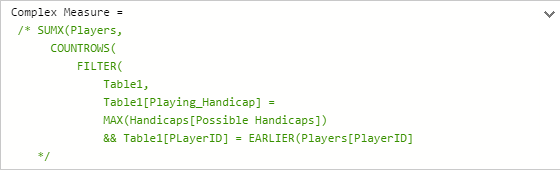
The formula shown in this example is not important; this example simply shows you what to do when you are not finished writing a measure in order to avoid leaving it half written, going off and doing something else, and forgetting to finish it. The easiest thing to do is to wrap the measure inside the multi-line comment indicators /* */. This makes the entire measure a comment that can be stored in your table without throwing an error.
Here’s How: Creating New Pages in Power BI
Power BI has a tab section at the bottom of Report view where you can see the various pages you have created. It is easy to create new pages by clicking the yellow plus symbol or by right-clicking any existing page to create a duplicate (shown below).

An alternative to adding a new page is to duplicate an existing page. Duplicating is a great approach especially in this case because it means you get a new page that already has one or more visuals (e.g., a matrix) that you can use for the next exercise. You can also rename the pages to something more descriptive to help find the exercises again later. You should duplicate instead of add new pages if you want to add similar visuals to a new page.