8: DAX Topic: Calculated Columns
It’s time for a change of pace. I have deliberately left the main discussion of calculated columns until now to allow you to get accustomed to the power of measures. As mentioned in Chapter 7, the most common mistake I see Excel users make is to use too many calculated columns. And when you think about it, a calculated column is a very comfortable place for an Excel user to hang out because a table in Data view in Power BI looks and feels a lot like Excel. But as I warned previously, you should avoid using calculated columns until you know when and why to use them. Consciously avoiding calculated columns and trying to find a measure solution will make you a stronger DAX user. Trust me.
In general, you should not use a calculated column if:
- You can use a measure instead.
- You can bring the data into a table directly from the source data.
- You can create the column during data load by using Power Query.
I always recommend that you prefer the following order to source a missing column (when a measure will not do the job):
1. Get it added to the source and import it from there.
2. Create it in Power Query on data load.
3. Use a calculated column.
By pushing the column as far back to the source as possible, you increase the possibility of reuse down the track. But the truth is that this is a purist view, and it doesn’t really matter that much. If you know how to do it in a calculated column and you don’t know how to do it in Power Query, then there is no harm in using the calculated column. Indeed, you can and should use calculated columns when you need them. You should definitely use a calculated column when both of the following two conditions are satisfied at the same time:
- You need to filter/slice a visual based on the results of a column (i.e., you want to use the column on Filter, Slicer, Rows, or Columns). Measures don’t work in this case.
- You can’t bring the column of data you need in from your source data or by using Power Query (for whatever reason).
These are the most common reasons you can’t get a column you need from your source data:
- It doesn’t exist.
- You can’t arrange to get it added (e.g., you don’t have access to the source system).
- You can’t get it added in a timely manner.
- You want to reuse measures that exist in your data model as part of the formula needed to create the new column.
As mentioned earlier, if possible, you should try to get the column you need added to the source data. When you do this, you get the full benefit of compression on data import; in addition, the column is available for reuse in all your future workbooks. But sometimes this simply isn’t possible, and other times it is possible, but you can’t wait two weeks (or two years!) to get it done. Calculated columns are useful in such cases. And if a new column becomes available in the future, you can simply delete your calculated column and replace it with the new column coming in from the source.
Here’s How: Creating a Day Type Calculated Column
Let’s look at an example of where you should use calculated columns. Let’s say that you extract the Calendar table from your enterprise database, and you want a new column that shows whether each date is a weekend, but you can’t arrange to have this column added for now. Of course, you could use Power Query, but this book is about DAX, so this section discusses how to create a calculated column to solve this problem.
Follow these steps to create a Day Type calculated column in the Calendar table:
1. Select the Calendar table from the fields list on the right-hand side of Power BI.
2. Right-click the table name and select New Column.
3. Immediately start typing the following over the top of Column = in the formula bar:
Day Type = IF('Calendar'[DayNumberOfWeek] = 1 || 'Calendar'[DayNumberOfWeek]=7,"Weekend","Weekday")
Note: Note the use of the two pipe symbols (||) in the formula above. The pipe can be found on your keyboard above the backslash key (which is right above the Enter/Return key). The two pipe symbols are the inline text version of a logical OR function.
4. You can also write an OR function in DAX as follows:
OR('Calendar'[DayNumberOfWeek] = 1, 'Calendar'[DayNumberOfWeek] = 7)
5. Personally, I prefer to use the two pipes because you can have as many of them as you like in a single formula. The OR() function above accepts only two parameters as inputs; if you have more than two “or” logical inputs, you need to use multiple nested OR() functions to make it work.
Note: The inline version of the logical AND is the double ampersand (&&), which equates to the AND() function.
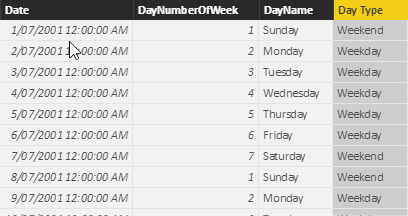
6. If you are not currently in Data view, switch to it now and check to make sure your column is calculating correctly. You are the person writing the formulas, and hence you are personally responsible for making sure they are evaluating correctly.
7. Note that the formula you just created, as shown below, is a single formula for the entire column. Just as with Excel tables, with Power BI, it is not possible to have more than one formula in a calculated column. You therefore have to write the one formula so that it evaluates and handles all the possible scenarios you need.
8. Now that you have the new calculated column, go to a new page in your workbook and create a new matrix. Place Products[Category] on Rows, place your new column 'Calendar'[Day Type] on Columns, and then add [Total Sales] to the Values section. You end up with the matrix shown below.

You have successfully extracted some new insights from the data that didn’t exist before: You have used data modelling techniques to enhance the data for weekday/weekend analysis. Sweet!
Practice Exercise: Calculated Columns
Write the following calculated column in the Calendar table. Find the solution to this practice exercise on"Appendix A: Answers to Practice Exercises" on page 214.
31. Creating a Half-Year Column
Write a calculated column in the Calendar table that returns the value H1 for the first half of each year (January through June) and H2 for the second half of each year (July through December). Hint: You might want to use an IF statement to do this.