Sometimes, we might not want to use different colors to represent different groups of data points. For example, some journals accept graphs only in grayscale. In this recipe, we will learn how we can highlight grouped data points by symbol size and type.
We will use the ggplot2 library, so let's load it by running the following command:
library(ggplot2)
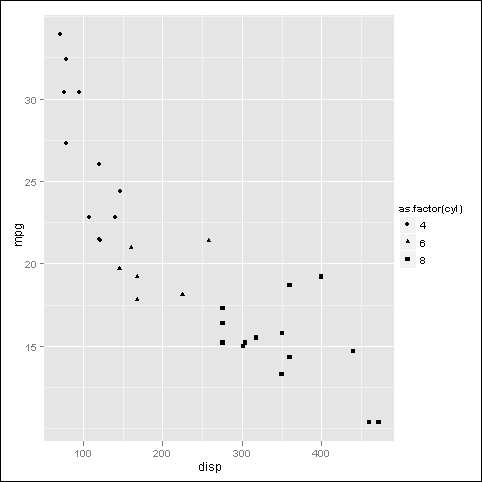
First, let's group points by the symbol type. Once again, we use the qplot() function:
qplot(disp,mpg,data=mtcars,shape=as.factor(cyl))

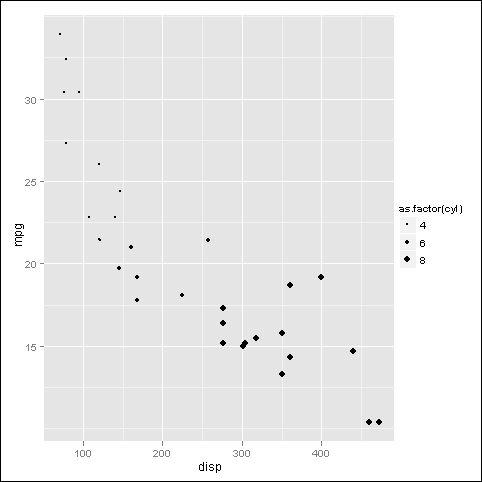
Next, let's group the points simply by the size of the plotting symbol:
qplot(disp,mpg,data=mtcars,size=as.factor(cyl))

Highlighting groups of points by symbol type and size works exactly like colors using the qplot() functions. Instead of the col argument, we used the shape and size arguments and set them to the factor we want to group the points by (in this case, cyl). We can also use combinations of any of these arguments. For example, we can use colors to represent cyl and size to represent the gear.