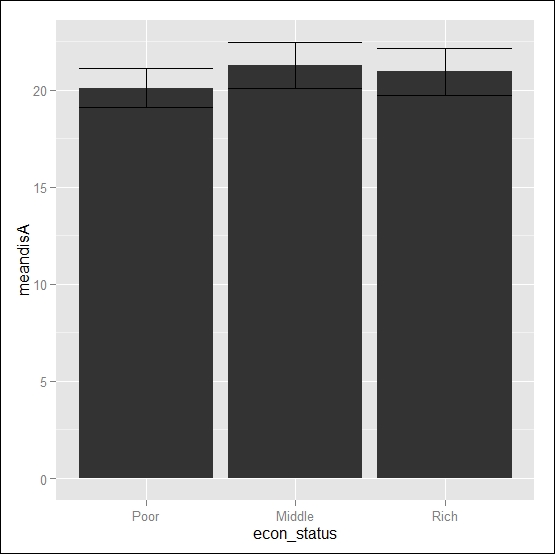
A bar chart with error bars is another commonly used data visualization technique. In this recipe, we will produce a bar chart with error bars.
To produce a bar chart with error bars, we need to process the dataset in such a way that we have the relevant data at hand. In fact, to produce the error bar, we need to have the standard error of the mean that can be transformed into the lower and upper limit. To make this happen, we will call ggplotdata first, and then will do some processing using the following code:
# Summarizing the dataset to calculate mean
# calculating margin of error for 95% confidence interval of mean
bardata <- ddply(ggplotdata,.(econ_status),summarize,n=length(disA),meandisA=mean(disA),sdA=sd(disA),errMargin= 1.96*sd(disA)/sqrt(length(disA)))

# transforming the dataset to calculate
# lower and upper limit of confidence interval
bardata <- transform(bardata, lower= meandisA-errMargin, upper=meandisA+errMargin)
Now, we will use bardata to produce the bar chart with the error bar representing a 95 percent confidence interval of the mean.
To produce a bar chart with an error bar, firstly, we will create the basic bar chart with the following code and store it in an R object, which is errbar:
errbar <- ggplot(data= bardata, aes(x=econ_status, y=meandisA)) + geom_bar(stat="identity")
The preceding code will produce the bar chart, but it will not display the output until we call the object separately. Now, we will add the error bar with the basic chart as follows:
errbar + geom_errorbar(aes(ymax=upper,ymin=lower),data=bardata)
The plot looks like what is shown in the following figure:

The main mechanism of this plot is the data processing itself. We need to create the variables for each part of the bar chart. In this case, our objective was to create a bar chart of the mean of the disA variable over the category of economic status. At the same time, we wanted to create the error bar in order to represent a 95 percent confidence interval of each mean. So, we have created variables for the mean and the lower and upper limit of a 95 percent confidence interval.
Once we have the data in hand, we can just produce the bar chart following the basic command. To add the error bar, we need to add a layer to the existing plot using geom_errorbar(). Within geom_errorbar(), we used the lower and upper limit of the 95 percent confidence interval as the minimum and maximum value of the y-axis.
Initially, the bar width looks very thick, and we can easily control this using the width argument within the geom_bar() function. We can do the following with the basic bar chart:
- To change the bar width:
geom_bar(width=0.5) - To change the fill color of each bar:
geom_bar(fill="green") - To change the bar outline color:
geom_bar(col=="red") - To flip the orientation:
coord_flip()
Now, it's your turn to try the various options in order to play with the bar charts.