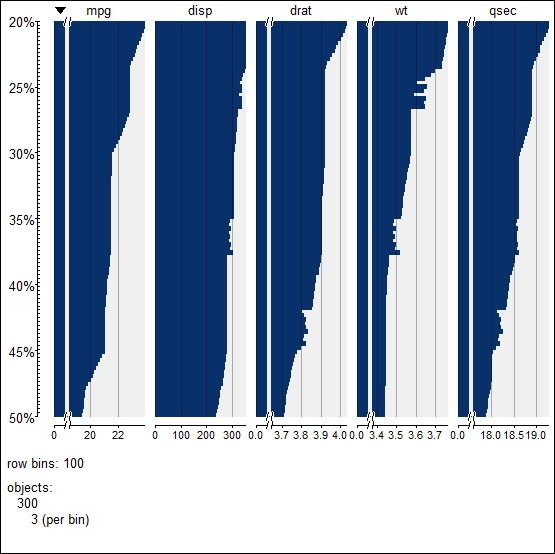
Sometimes, we need to zoom in to see the special pattern in the dataset. In this recipe, we will see how we can zoom in to the plot with the use of a simple argument in the existing function.
Let's recall the same data with continuous variables only (con_dat). We want to create the plot with 20 to 50 percent of the data based on sorted variables.
The code to produce the plot by zooming into the mpg variable with 20 to 50 percent of the observation is as follows:
tableplot(con_dat,from=20,to=50,sortCol=mpg)

The from and to arguments specify which part of the data needs to be used during plotting. These two arguments work on the variable that is mentioned in the sortCol argument. If sortCol is not specified, then the tableplot function takes the default sort column that is usually the first variable in the dataset by default.
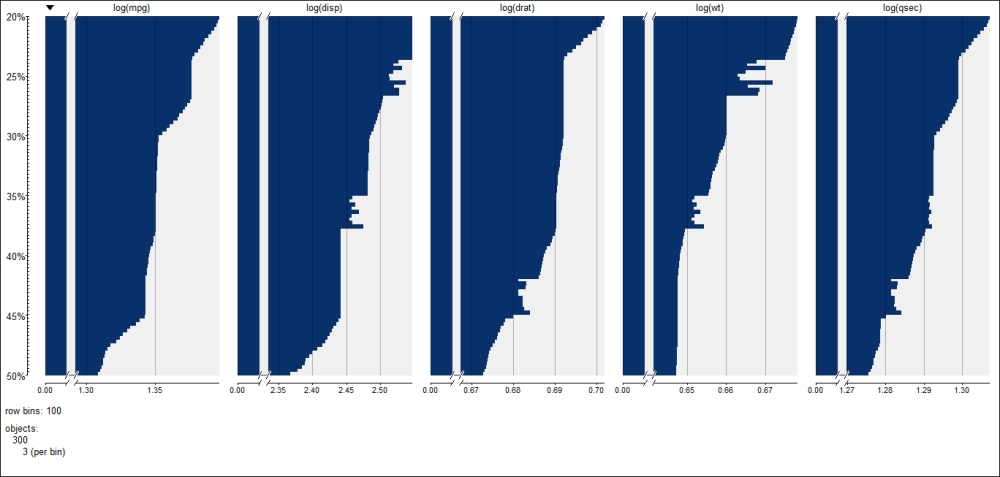
There is another argument for continuous variables, which is scales. With this argument, we can specify the mathematical transformation that is required to be performed with the continuous variables. For example, if we want to plot all the log-transformed continuous variables, then the code will look like the following code snippet. However, if we want to perform log transformation on some of the variables, then we need to perform that transformation separately:
tableplot(con_dat,from=20,to=50,sortCol=mpg,scales="log")

To filter the observation, we can use the subset argument. The subset argument is used to specify which observation we should use during plotting.