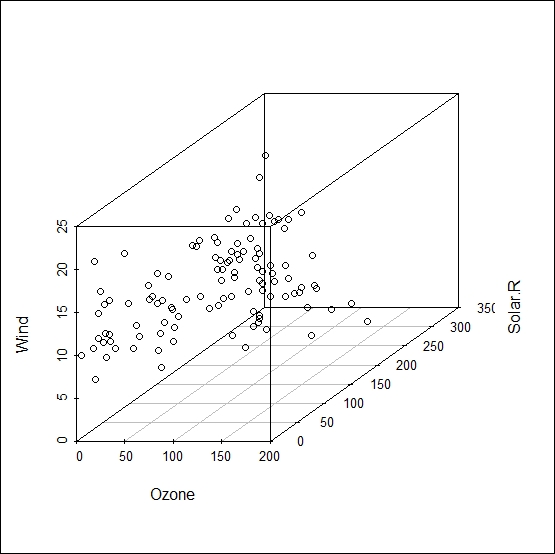
A scatter plot is one of the simplest plots that help us view the relationship between two numeric variables. In this recipe, we will see how we can produce the scatter plot from three variables with a 3D plot. A 3D plot is good way to visualize the pattern of relation among three variables at a time. Sometimes, it could happen that a 3D plot is not depicting the relation pattern in a good shape; in this case, we might rotate the plot to find out the correct pattern. However, in this recipe, we will create a simple 3D scatter plot using three continuous variables.
To produce a three-dimensional scatter plot, we need to load the scatterplot3d library. If it is not already installed, then we can install it using the following command:
# To install scatterplot3d library
install.packages("scatterplot3d")

# Loading the library
library(scatterplot3d)
We will use the airquality dataset for this recipe.
The primary command to produce a three-dimensional scatter plot is as follows:
# Attach the dataset in the current environment
# so that we can call using the variable names
attach(airquality)

# Basic scatter plot in 3D space
scatterplot3d(Ozone,Solar.R,Wind)

The scatterplot3d function seeks three numeric variables as input in order to produce the plot in a three-dimensional space. If we do not specify a third variable, then it still produces a 3D scatter plot. If we specify only two variables, then two axes are represented by two variables, and the third axis is represented by a sequential number; the sequential number here acts as third variable.
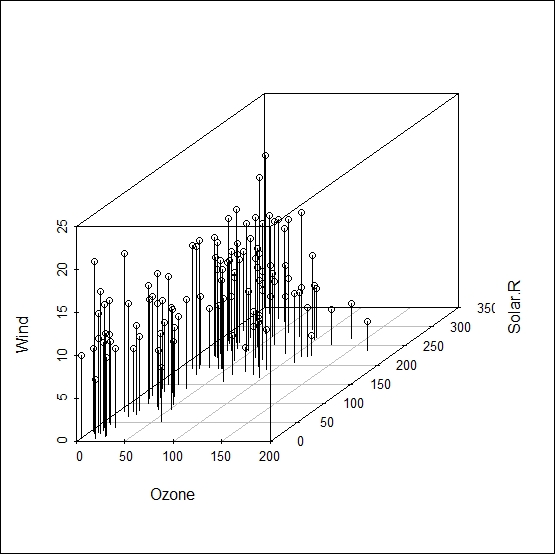
After creating the basic plot, we can add more information, such as a vertical drop line, by specifying the type="h" argument. Also, as we mentioned, if we do not specify the third variable, then it still produces the plot. An example of this situation is as follows:
# adding horizontal drop line
scatterplot3d(Ozone,Solar.R,Wind,type="h")

The code to create a three-dimensional scatter plot is as follows but this time we will only use two variable in the input. The third variable is not specified but still it will create a 3D scatter plot assuming the third variable is a sequential number:
scatterplot3d(Ozone,Solar.R)