Chapter nine

The Solar Investment

Abstract

The cost of solar DHW and photovoltaic systems versus conventional systems using electricity, natural gas, and oil are discussed. The life cycle cost analysis of these alternative energy systems are evaluated in terms of financing and yearly cash flow. Capital recovery factors from Chapter 6 are used to determine actual system series of monthly repayments. Examples using costs of solar DHW and photovoltaic systems to determine present worth of money from previous calculations performed in Chapters 7 and 8 respectively are discussed. The actual cost of financed systems is evaluated by calculating the present worth of money. Energy choices and considerations for using solar energy as a savings and investment versus the continued use of fuels such as oil, natural gas, and electricity conclude the chapter.

Keywords

Capital Recovery Factor (CRF); Cost benefits; Decisions; Economy; Electricity; Inflation; Internet; Investment; Life cycle cost analysis; Loan; Natural gas; Oil; Photovoltaics; Present worth of money; Repayment; Savings; Solar DHW; U.S. Department of Energy Database of State Incentives for Renewables and Efficiency (DSIREUSA.org); Websites
In July 1979, the State of Maine Office of Energy Resources reported the cost of electricity in that northern state to be $0.04/kWh and the cost of oil to be $0.57/gallon. By 2012, those costs were up 400 and 650%, respectively. The technology and practical economics of solar domestic hot water (DHW) systems were viable in the late 1970s, but photovoltaic (PV) systems were in the early stages of development and somewhat cost prohibitive. Since that time, the improvement in materials, increased efficiencies, and technological advancements have made both solar DHW systems and PV systems cost competitive in terms of economic payback periods versus fossil fuels. The economic climate for such systems has improved as predicted since that time because of escalating fuel costs, and the fact that tax incentives have been reintroduced, decreasing breakeven cost periods. Since the costs of fuel sources, unlike the sun’s free radiant energy, continue to increase, it is important to understand the potential economic benefits of these alternative energy-producing systems. The economic portions of this book, therefore, are intended to provide a basic understanding of the economic decision-making process using examples throughout, but they are not intended as a complete course in managerial and financial engineering analysis.
The cost of installing a solar DHW system is an alternative to reducing the cost of using existing conventional energy systems, such as an electric, natural gas, oil burner, or other types of hot water delivery systems. Its purpose is to supplement the energy required to heat water for your residence. The cost of installing a PV system is an alternative supplement to reducing the cost of electrical energy received from your power utility company. So why would you pay more for equipment to supply energy for your daily requirements? The answer is fairly simple. The cost of energy from the sun remains free. Inflation does not affect its energy output. To measure the benefits of using these alternative energy systems, you need to add up the dollar savings from energy produced by each of these solar alternatives over their expected lifetime and compare the cost benefits against the actual costs. Economists call this type of analysis “life-cycle cost analysis”.
This book addresses both payback periods and yearly cash flow over the expected life of a solar energy system to determine the value of a potential investment. If you have the ability to purchase a system with cash, you are looking for an investment comparison with that of other alternative investments. The family with the financial resources to purchase a system with cash has the most opportune position from an investment standpoint. If that is the case, the payback period and additional resulting return of equity over the life of the system will provide useful information regarding the actual value of the alternative energy system. The investment discussions in Chapters 7 and 8 were predicated on these types of evaluations. If you require financing a system with a loan, however, it is not necessary to compare the solar cost investment with any other alternative investment. If you finance a system, you are likely to be concerned with minimizing monthly energy expenditures. In that situation, a yearly cash-flow evaluation will illustrate the amount of your yearly loan payment that would be offset by the cost savings of your fuel or electric bill.

9.1. Cash-Flow Evaluation

An informative way to understand and examine a cash-flow analysis is to follow a particular example. Once the logic and calculation methods are understood, you then can substitute your own estimate costs relative to the type of alternative energy system under consideration and determine your own economic analysis.

9.1.1. Solar Domestic Hot Water System

Suppose you purchase the solar DHW system proposed in Chapter 7, Section 7.6, in the amount of $10,891 before tax credits. The actual system costs were as follows:

SolarDHWsystemcost=+$10,891.00Federaltaxcredit(30%)=$3267.30¯Actualsystemcostafterfed.taxcredit=$7,623.70Statetaxcredit(i.e.,billings,MT)¯=$1000.00¯Finalsystemcostaftertaxcredits=$6,623.70

image
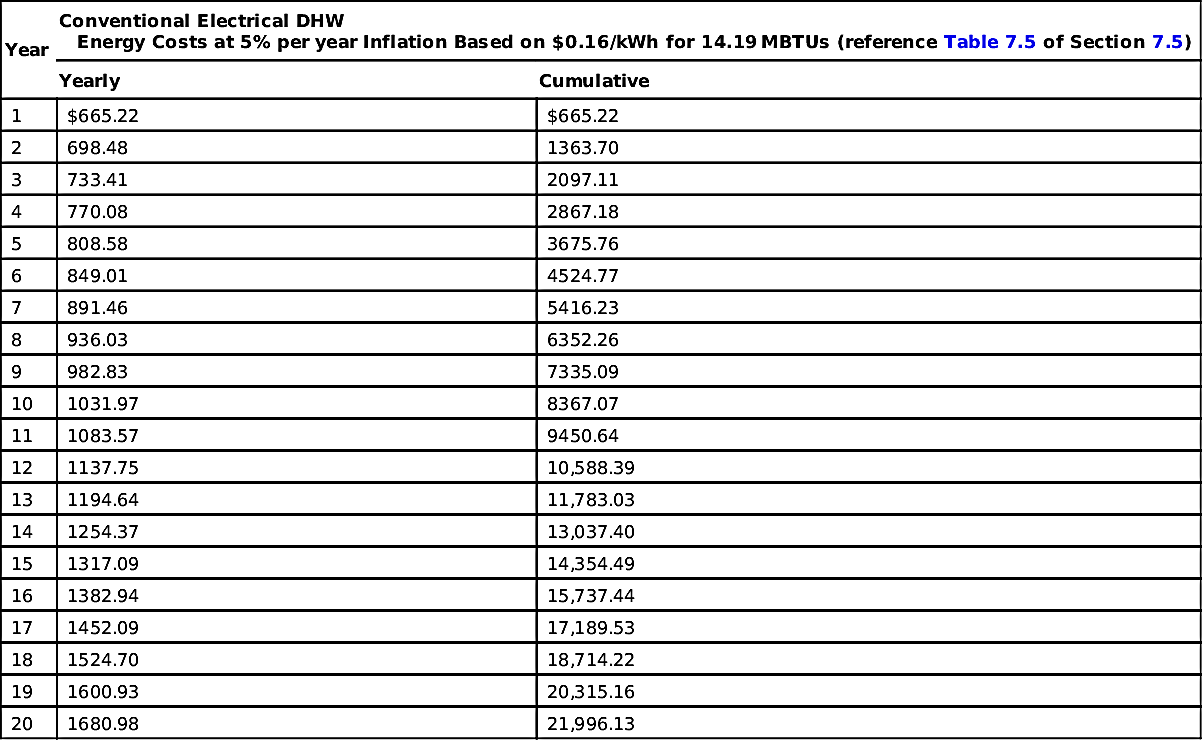
Assume you have enough cash to pay the difference of $4267.30, which is the combined dollar amount of the federal ($3267.30) and state ($1000) tax credits allowed, so that at the end of the tax year, you are borrowing only the cost of the system, after tax credits, in the amount of $6623.70. From that previously proposed example, the output from the solar energy system provides 14.19 million British thermal units (MBTUs) per year. Per the example of Chapter 7, Section 7.5, we are heating water with electricity at $0.16/kWh at a cost of $665.22 for the first year. Table 9.1 illustrates the electrical energy cost with a 5% energy inflation factor. The cash needed to purchase 14.19 MBTUs of electricity at $0.16/kWh over a 10-year period, based on 5% energy inflation was calculated to be $8367.07. Average monthly payments for that amount of energy would be approximately $69.73 [$8367.07 (over 10 years)/120 = $69.73].
Assume you borrow $6623.70 (P) to pay for the remaining portion of the system after receiving your tax rebates, and assume a bank loan for the system is obtained at 3.5% interest (i) compounded annually for a 10-year (n) term. The series of loan repayments for each year can be found using Chapter 6, Eqn (6.5) and the applicable capital recovery factor (CRF), obtained from Table 6.1 under the applicable interest rate, as follows:

R=P(inCRF)

image
Where
R = repayment made at the end of each year,
P = $6623.70 (present sum),
(i  n CRF) = (0.035  10 CRF) = 0.12024 (from Chapter 6, Table 6.1), and
R = ($6623.70) × (0.12024) = $796.43 (annual payments for 10 years).

Table 9.1

Example of Energy Costs and Savings Realized (System Output of 14.19 MBTUs at $0.16/kWh)

YearConventional Electrical DHW
Energy Costs at 5% per year Inflation Based on $0.16/kWh for 14.19 MBTUs (reference Table 7.5 of Section 7.5)
YearlyCumulative
1$665.22$665.22
2698.481363.70
3733.412097.11
4770.082867.18
5808.583675.76
6849.014524.77
7891.465416.23
8936.036352.26
9982.837335.09
101031.978367.07
111083.579450.64
121137.7510,588.39
131194.6411,783.03
141254.3713,037.40
151317.0914,354.49
161382.9415,737.44
171452.0917,189.53
181524.7018,714.22
191600.9320,315.16
201680.9821,996.13

image

The series of payments (R) means that you would pay monthly installments of $66.37 during the 10-year period to repay the loan. Table 9.2 shows that the amount of money borrowed at the start of the year (column 1) has interest due at the end of the year (column 2), and the payment at the end of the period (column 4) repays this interest plus some of the principal (column 6). For example, the unpaid principal at the beginning of year 3 is $5474.74, the interest owed that year at 3.5% is $191.62, and the payment at the end of the year of $796.43, consists of $191.62 in interest and $604.81 in principal.

Table 9.2

Visualizing the Capital Recovery Factor

(1)(2)(3)
(1) + (2)
(4)(5)
(3)  (4)
(6)
(4)  (2)
YearMoney Owed at Start of YearInterest Owed at End of Year at 3.5%Principal and Interest Owed at End of YearSeries (R) of RepaymentsMoney Owed at End of Year After RepaymentRecovery Capital
1$6623.70$231.83$6855.53$796.43$6059.10$564.60
2$6059.10$212.07$6271.17$796.43$5474.74$584.36
3$5474.74$191.62$5666.36$796.43$4869.93$604.81
4$4869.93$170.45$5040.38$796.43$4243.95$625.98
5$4243.95$148.54$4392.49$796.43$3596.06$647.89
6$3596.06$125.86$3721.92$796.43$2925.49$670.57
7$2925.49$102.39$3027.88$796.43$2231.45$694.04
8$2231.45$78.10$2309.55$796.43$1513.12$718.33
9$1513.12$52.96$1566.08$796.43$769.65$743.47
10$769.65$26.94$796.59$796.4301$769.49
Total$6623.541

image

1 Actual value calculates to $0.16 due to rounding to the nearest cent.

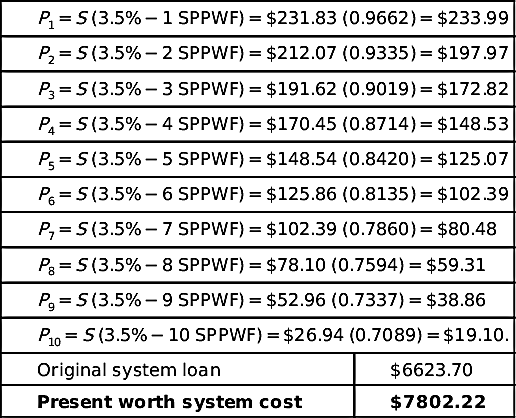
P=S(inSPPWF)

image
Where
P = present worth of interest due,
S = amount of the interest due = $231.83 (year 1) (column 2, Table 9.2),
SPPWF = single payment present worth factor,
(i  n SPPWF) = (0.035  n SPPWF), resulting in the following tabulation:
In a loan repayment scenario of $6623.70 at 3.5% compounded interest with end-of-period repayments, the present worth of money actually invested, taking into account the present worth of the interest paid each year, would be $7802.22. The additional $1178.52 for the cost of the system (i.e., $7802.22  $6623.70) essentially would be paid for by the cost savings of the energy produced. In approximately 9.5 years, the solar DHW system would begin to accumulate savings and decrease your monthly energy costs to heat water. In addition, during the 10-year loan period, the amount of money you pay for the energy produced would remain the same because the sun’s energy is not affected by energy inflation costs, fuel availability, or politics.
Because the payments for the solar DHW system are $66.37 each month, based on the series of repayments (R) calculated, you conservatively would be saving a few dollars over that period of time as well as pay for the cost of the system. The energy savings attributed to the operation of the solar installation would offset the interest paid on the loan. After that period of time, you would have a net positive savings of cash flow each month. Essentially, you have lost no more money than you otherwise would have spent, simply by paying the same monthly amount for your current hot water energy needs.

9.1.2. Solar Photovoltaic System

(Cost of system installed)=$19,012.00Federaltaxcredit(30%)=$5703.60¯Actualsystemcostafterfed.taxcredit=$13,308.40Statetaxcredit¯=$2000.00¯System cost after tax credits=$11,308.40

image
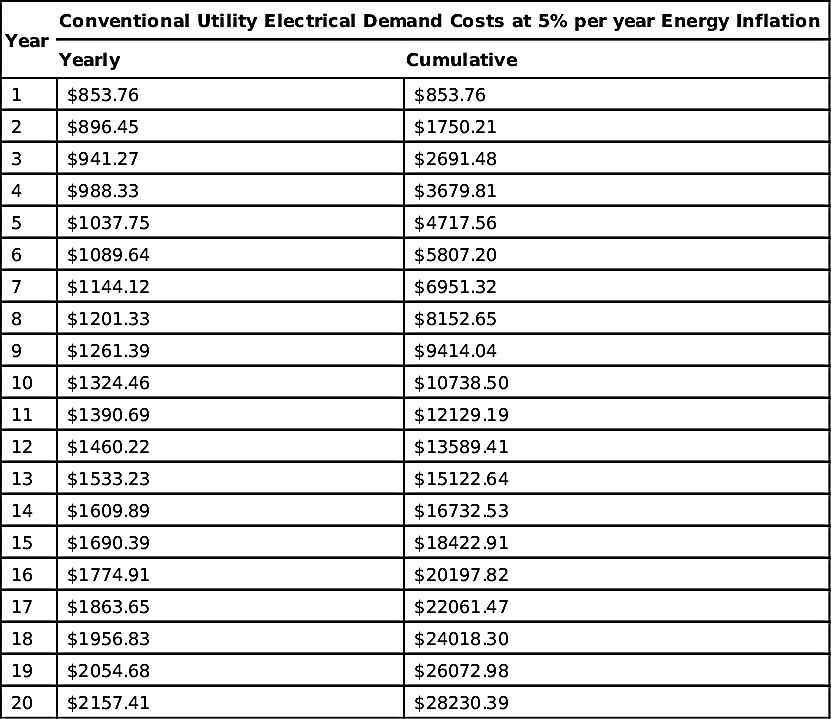
Assume you have enough cash to the pay the difference of $7703.60, which is the combined dollar amount of the federal ($5703.60) and state ($2000.00) tax credits allowed. At the end of the tax year, you are borrowing the actual cost of Example 1, after you receive your tax credits, in the amount of $11,308.40. From that previously proposed example, you are producing 5336 kW at a value of $0.16/kWh for the first year. Table 9.3 illustrates the electrical energy cost with a 5% energy inflation factor as represented previously in Chapter 8, Section 8.3, Table 8.3. The cash flow to purchase 5336 kW of electricity at $0.16/kWh over a 10-year period, based on 5% energy inflation was calculated to be $10,738.50. Average monthly payments for that amount of electricity would be approximately $89.49.

Table 9.3

Example of Annual Electrical Energy Costs (Electricity Demand of 5336 Kwh at $0.16/kWh)

YearConventional Utility Electrical Demand Costs at 5% per year Energy Inflation
YearlyCumulative
1$853.76$853.76
2$896.45$1750.21
3$941.27$2691.48
4$988.33$3679.81
5$1037.75$4717.56
6$1089.64$5807.20
7$1144.12$6951.32
8$1201.33$8152.65
9$1261.39$9414.04
10$1324.46$10738.50
11$1390.69$12129.19
12$1460.22$13589.41
13$1533.23$15122.64
14$1609.89$16732.53
15$1690.39$18422.91
16$1774.91$20197.82
17$1863.65$22061.47
18$1956.83$24018.30
19$2054.68$26072.98
20$2157.41$28230.39

image

Let’s perform the same type of analysis for this PV system as we did previously in Section 9.1.1 for a DHW system. Assume you borrow $11,308.40 (P) to pay for the remaining portion of the system after receiving your tax rebates, and assume a bank loan for the system is obtained at 3.5% interest (i) compounded annually for a 10-year (n) term. The series of loan repayments for each year can be found using Chapter 6, Eqn (6.5) and the applicable capital recovery factor (CRF), obtained from Table 6.1 under the applicable interest rate, as follows:

R=P(inCRF)

image
Where
R = repayment made at the end of each year,
P = $11,308.40 (present sum),
(i  n CRF) = (0.035  10 CRF) = 0.12024 (from Chapter 6, Table 6.1), and
R = ($11,308.40) × (0.12024) = $1359.72 (annual payments for 10 years).
The series of payments (R) means that you would pay monthly installments of $113.31 during the 10-year period to repay the loan. Table 9.4 shows that the amount of money borrowed at the start of the year (column 1) has interest due at the end of the year (column 2), and the payment at the end of the period (column 4) repays this interest plus some of the principal (column 6).
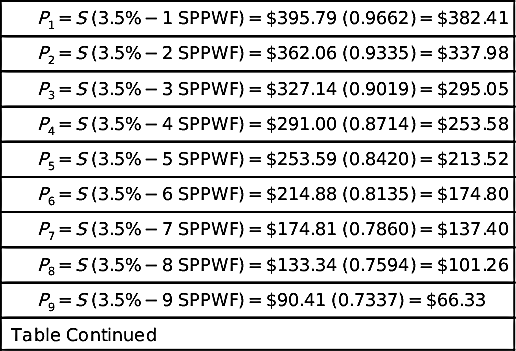
The actual cost of the PV system in terms of present worth money at 3.5% compounded annually is the sum of the initial amount of money borrowed plus the present worth of interest due at the end of each repayment period. Using Chapter 6, Eqn (6.4) and Table 6.1, you can determine the actual cost of the system at 3.5% over a period of 10 years, as follows:

P=S(inSPPWF)

image
Where
P = present worth of interest due,
S = amount of the interest due = $395.79 (Year 1) (column 2, Table 9.4),
(i  n SPPWF) = (0.035  n SPPWF), resulting in the following tabulation:

Table 9.4

Visualizing the Capital Recovery Factor

(1)(2)(3)
(1) + (2)
(4)(5)
(3)  (4)
(6)
(4)  (2)
YearMoney Owed at Start of YearInterest Owed at End of Year at 3.5%Principal and Interest Owed at End of YearSeries (R) of RepaymentsMoney Owed at End of Year after RepaymentRecovery Capital
1$11,308.40$395.79$11,704.19$1359.72$10,344.47$963.93
2$10,344.47$362.06$10,706.53$1359.72$9346.81$997.66
3$9346.81$327.14$9673.95$1359.72$8314.23$1032.58
4$8314.23$291.00$8605.23$1359.72$7245.51$1068.72
5$7245.51$253.59$7499.10$1359.72$6139.38$1106.13
6$6139.38$214.88$6354.26$1359.72$4994.54$1144.84
7$4994.54$174.81$5169.35$1359.72$3809.63$1184.91
8$3809.63$133.34$3942.97$1359.72$2583.25$1226.38
9$2583.25$90.41$2673.66$1359.72$1313.94$1269.31
10$1313.94445.99$1359.93$1359.7201$1313.73
Total$11,308.191

image

1 Actual value calculates to $0.21 due to rounding to the nearest cent.

Since the payments for the solar PV system are $113.31 each month, based on the series of annual repayments (R) calculated for this scenario, you would be paying slightly more per month ($113.31  $89.49 = $23.82) over this 10-year period to pay off the loan based on the conservative energy inflation percentages utilized. These monthly payments can be fine-tuned by your banking lender to actually result in the same amount of money spent for energy each month as the repayment of the loan. As discussed in Chapter 8, the breakeven and payback over the life of this system will produce a positive cash flow. By considering the energy output over the lifetime of a solar energy system, you can determine whether the overall benefits exceed the costs of a conventional system. This type of analysis has been presented in Chapter 7 by determining the payback or breakeven period discussed in regard to solar DHW systems and in Chapter 8 in regard to PV systems.

9.2. Energy Choices

Water heating accounts for approximately 20% of all household energy use in the United States,1 and the use of solar DHW has the potential to reduce that household energy consumption by 50% or more as illustrated by the example presented in Chapter 7. Approximately 40% of the residential water heaters are electric2 and 54% are natural gas.3 The remainder of water is heated with either propane or oil-fired boilers, mostly in the northeast regions, where a quarter to a third of the residences use fuel oil.
Heating water is a function of the climate, inlet water temperature, and demand patterns of the consumer. The Northeast and Rocky Mountain regions generally have a higher water heating energy demand due to cooler inlet water temperatures, whereas the energy needed to heat water in warmer climates is significantly less. Seasonal variations in solar insolation availability including precipitation, cloud cover, and ambient temperatures all play a part in the amount of radiant energy available. Such factors used to determine heating demands have been discussed in Chapter 3. System prices, quality, durability, fuel costs, utility rates, and tax incentives are just a few of the additional factors to consider. Although a conventional DWH system is less costly initially, it will cost more to heat the water over the life of the system than the cost of a solar energy system because of inflation and increasing fossil fuel costs. Comparing payback periods for solar DHW is more complicated than determining payback periods for PV systems, particularly because of inefficiencies with fuel to heat conversion. Calculating savings for oil, natural gas, and propane across different system technologies and types of configurations is a bit more difficult.

9.2.1. Fuel Oil

Let’s take a look at the cost of fuel for an oil burner to provide the same amount of energy to heat water as electricity. Table 9.5 is similar to Chapter 7, Section 7.1, Table 7.3 except we are now using the cost of oil versus electricity. Assuming an 85% efficiency, a gallon of fuel oil provides 117,895 BTUs of energy (see Chapter 3, Section 3.1, Table 3.1). The number of gallons of oil necessary to produce 17.3 MBTUs ((17,300,000 BTUs) × (1 gallon/117,895 BTUs)) is 146.7 gallons. The number of gallons used, shown in Table 9.5, is based on the efficiency of the oil burner and can be calculated accordingly for each individual situation.
At first glance, it would appear that it would be less expensive to heat water with oil than with electricity. In 2012, the Northeast region of the country was paying approximately $0.16/kWhKwh for electricity and $3.70/gallon for oil. At those prices, Table 7.3 shows the cost to heat 60 gallons of water by electricity to be $810.78, compared with $542.75 for oil (Table 9.5). The results of this comparison can be somewhat deceiving, however, because they do not take into consideration the inconsistencies in oil burner system efficiencies and heat losses for the warmer months just to generate hot water. “During the summer months, boilers without cold start functionality can have efficiencies approaching 25% with indirect tanks and tankless coils alike. It is not uncommon to consume between 100 and 200 gallons of oil for two occupants over the summer months for water heating.”4 So how does this affect using oil versus electricity in comparison to using solar?
If the price of oil is $3.70/gallon, and an additional amount of oil consumed during the seasonal warmer months is conservatively 100 gallons due to heat losses, then you have added an additional $370 to your fuel costs in Table 9.5. This results in an annual cost of $912.75 ($542.75 + $370), which is approximately $102 more than the cost of heating water with electricity. If you apply these costs to a solar DHW system output of 14.19 MBTUs as discussed previously in Chapter 7, Table 7.5, for the family of four in Billings, Montana, you would use 120.4 gallons of oil ((14,190,000 BTUs) × (1 gallon/117,895 BTUs) = 120.4 gallons) plus 100 gallons for heating water in the summer months for a total of 220.4 gallons annually. At $3.70/gallon, the cost of fuel oil is $815.48, which is $150.26 ($815.48  $665.22) more than the cost of heating with electricity, shown in Chapter 7, Table 7.5.

Table 9.5

Typical Domestic Hot Water Provided by Fuel Oil

Water Heated per day (gallon)Yearly RequirementYearly Cost to Heat Water from 40 to 135 °F
MBTUGallons of Oil$3.50/gallon$3.70/gallon$3.90/gallon$4.10/gallon$4.30/gallon$4.50/gallon$4.70/gallon$4.90/gallon
6017.3146.7$513.45$542.75$572.13$601.47$630.81$660.15$689.49$718.83
7020.2171.3$599.55$633.81$668.07$702.33$736.55$770.85$805.11$839.37
8023.1195.9$685.65$724.83$764.01$803.19$842.37$881.55$920.73$959.91
9026.0220.5$771.75$815.85$859.95$904.05$948.15$992.25$1036.35$1080.45
10028.9245.1$857.85$906.87$955.85$1004.91$1053.93$1102.50$1151.97$1200.99
11031.8269.7$943.95$997.85$1051.83$1105.77$1159.71$1213.65$1267.59$1321.53
12034.7294.3$1030.05$1088.91$1147.77$1206.63$1265.49$1324.35$1383.21$1442.07

image

9.2.2. Natural Gas

Natural gas is lower in cost per BTU than either electricity or oil, and therefore, the breakeven cost of natural gas versus solar DHW for the same time period is higher. In a study performed by the U.S. Department of Energy in February 2011,3 it was noted that the cost of a solar DHW system would have to be reduced by 36% to break even with cost of using natural gas. Does this mean that if you heat water using natural gas that you should not look into using solar to supplement the water heating process? If your current source for heating water is calculated to be less expensive than the cost of a solar DHW system and the overall savings and benefits do not exceed the actual costs of a system, then solar DHW may not be economically practical. This can be the situation when you compare natural gas prices against other fuel sources. When considering this type of investment, however, you must consider the volatility of future energy pricing.
The national annual average residential price of natural gas in 2009 and 2010 was $12.90/1000ft3 ($12.90/mcf). From 2008 through 2012, the price of natural gas declined from a high peak of $20.77/mcf to an average peak of $15.85/mcf.5 Using the energy conversion equivalencies as discussed in Chapter 3, Section 3.1, we can translate the dollar amount from cubic feet to therms, as follows:

(100,000BTUs/therm)×(1ft.3/1,028BTUs)×($15.85/1000ft.3)=$1.54/therm

image
Therefore, if you used natural gas to produce 14.19 MBTUs per our previous example, it would take approximately 142 therms annually or only $219 to heat water. Natural gas prices, however, can be volatile as noted by a Wall Street Journal market watch report in June 2012, which announced that natural gas supplies had been reduced because of a 38% drop in the number of operational gas rigs, and predictions for the following year could be more than $3.00/therm.5 In addition, natural gas prices can more than double from one state to another because of such factors as the number of pipelines in the state, the market’s proximity to producing areas, transportation charges associated with delivery, average consumption per residential customer, state regulations, and degree of competition in the area.

9.2.3. Electricity

The cost of electricity in comparison with both solar DHW and PV systems was addressed in Chapters 7 and 8, respectively. In many scenarios, electricity demands from your local power utility company are used entirely for household needs, inclusive of DHW. You can evaluate a life-cycle cost analysis and determine the life-cycle benefits by following the examples provided. The comparison of electricity costs for your residential power demands, however, may provide a better breakeven cost analysis using a PV system rather than a solar DHW system. Both types of systems should be evaluated.
Life-cycle benefits often do not greatly exceed the capital cost of a system and benefits, such as reduced reliance on fossil fuels, are external to the consumer and difficult to quantify. Energy prices are changing constantly and an analysis to determine payback and long-term investment therefore are difficult to evaluate, but you can modify the tables within these chapters to include your own information to evaluate any type of cost scenario.
Because each homeowner has different patterns of energy usage and requirements as well as financial abilities, blank work tables are provided in Appendix B for use in developing your own financial analysis. Using the financial examples presented in this chapter and in Chapters 7 and 8, you can provide data particular to your situation and future changes in inflation factors to determine cost breakeven points, cash flow, and loan considerations.

9.3. Energy Decisions

This book started by discussing the reasons for considering all types of energy to achieve energy independence and use more alternative forms, in particular our sun. Increasing the availability and use of all domestic energy sources will lead to an overall improvement in our economy and economic stability. This is not a political statement. It is simply a fact. Using our own developed energy resources should allow us an increased opportunity to invest in alternative energy solutions. We should not be complacent and continue to rely on foreign fuel imports.
With the information in this book, you can determine whether or not you have the proper site to take advantage of the radiant energy available. You can determine energy equivalents and understand the methods behind heat transfer for DHW use as well as the knowledge needed to determine your electrical demands. You can determine the sizing of both solar DHW collectors and PV arrays, and you have a basic understanding of the components involved with both types of systems. In addition, you have the ability to compare the many manufacturer’s models of solar DHW collectors and PV modules to determine the best fit for your particular application. Most important, you have an understanding of the economic payback and cash-flow analysis required to make an informed decision about whether to install a solar PV or DHW system.
Several websites have been mentioned throughout this book providing shortcuts and quick calculations for determining amounts of radiant energy, energy output, and collector performance. Website addresses can change over time and such online calculators can disappear. Manual tables have been included so that you do not have to depend on a computer to determine and evaluate these two alternative energy systems. A database of State Incentives for Renewables and Efficiency tax credits and rebates is also available at the U.S. Department of Energy Database of State Incentives for Renewables and Efficiency (www.dsireusa.org). Such up-to-date information is available via the Internet at that address or via your browser for other links to similar websites. Because time allowances and requirements for each state vary dramatically from one another, such information should be checked with each state before purchase. A qualified solar dealer or installer should have information regarding refunds, rebates, sales tax, and property tax exemptions, and building permit requirements applicable to your particular town and state.
Whether a PV system or solar DHW system is more cost-effective as an investment depends on several factors that vary from region to region and state to state, causing a variation in breakeven costs. In comparison with conventional systems, high initial costs are the primary reason for low consumer adoption. Solar energy installation prices can vary considerably from region to region, and the cost of comparative systems can vary significantly. Issues with aesthetics, system reliability, and lack of familiarity and knowledge about the technologies have combined to limit consumer adoption as well. Benefits such as reduced reliance on fossil fuels and reduced carbon-dioxide emissions can be difficult for consumers to quantify.
A solar energy system will increase the value of your property and can decrease your monthly energy expenditures, increasing your cash flow by saving money. This can be more advantageous than investing money in an alternative savings bank. Without the federal and state tax credits, however, the life-cycle benefits often do not greatly exceed the capital costs. With or without the tax credits, it is important to remember that there is a tax advantage with a solar alternative energy system investment. If you make money with a traditional investment, such as stocks or bonds, or even the low interest rates from a savings bank, your net income is increased and so is your tax liability. The money you invest in a solar DHW or PV system increases your spending power by saving you money. This is because you maintain the same income level when you save money, so your tax liability remains the same. You have not added to taxable income. You have simply spent less money; something the federal government should consider. Although alternative energy technologies continue to evolve, the financial relationships will remain the same. Only the cost of fuels, inflation rates, and loan interest rates are likely to rise. Everything else is subject to our perception of practicality and economic viability.