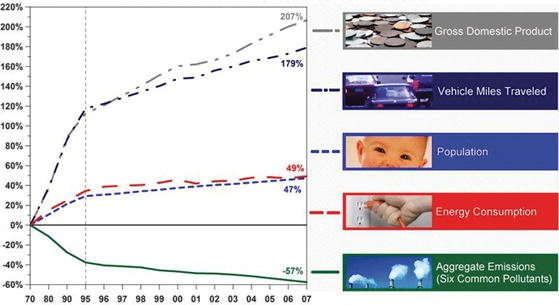
Figure 3.1. Comparison of growth areas and emissions from 1970 to 2007 [1].
The previous chapters provided the foundations of green chemistry, green engineering, and sustainability. We discussed these concepts in high-level terms, describing the principles of practice and goals to which one should strive in order to achieve a healthier environment. Here, we start to put the concepts of chemistry to work in understanding the interactions between various ecosystems and how specific actions propagate through the environment.
Within this chapter, we emphasize the importance of chemistry within the following topics: nature and the environment, energy and its production from chemical sources, waste and pollution prevention, ecotoxicology, and green living. An understanding of the chemistry surrounding each of these areas will provide the background one needs to understand the challenges associated with protecting the resources, and the alternatives that can be applied and are aligned with green chemistry and engineering. Some of these concerns have already been raised in previous chapters but are expanded to greater details here.
The quality of the air that we breathe directly impacts our health. Pure dry air at ground level contains nitrogen (78.08% by volume), oxygen (20.94% by volume), argon (0.93% by volume), carbon dioxide (0.04% by volume), and other gases such as neon, helium, krypton, and methane (0.01% by volume). Additional components such as particulates and ozone also play a vital role in the makeup of the atmosphere. Issues of air pollution have been a challenge for more than 30 years and remain an area of great concern today.
In the Clean Air Act of 1970, described previously in Chapter 1, the EPA established two types of national ambient air quality standards (NAAQS): one aimed at the protection of public health (including “sensitive” populations such as asthmatic people, children, and the elderly) and the second one targeting protection against decreased visibility and damage to vegetation, crops, and buildings. The EPA articulated NAAQS for six common pollutants: carbon monoxide (CO), ground-level ozone (O3), lead (Pb), nitrogen dioxide (NO2), particulate matter (PM) known as particle pollution, and sulfur dioxide (SO2). Since the establishment of the Clean Air Act in 1970, the gross domestic product increased by 207%, the number of vehicle miles traveled in the United States increased by 179%, and the U.S. population grew by 47% while the energy consumption was intensified by 49%. During the same period, the total emissions of the six principal pollutants decreased by 57%. Figure 3.1 compares growth areas and emissions in the period 1970–2007.
Figure 3.1. Comparison of growth areas and emissions from 1970 to 2007 [1].

As Figure 3.1 shows, for the past 37 years, the levels of the six principal pollutants have been declining, even as Americans drive more miles, consume more energy, and increase in population. The EPA has emphasized regulations and controls, and monitors air quality through programs and rules at the federal, state, local, and regional levels, as well as through voluntary partnerships. However, despite this overall progress in combined levels of the six principal pollutants, ground-level ozone and fine particle pollution continue to be higher than national air quality standards in some parts of the United States. Contrary to the overall trend, the annual emissions for ozone and particle pollution are subject to the impact of weather changes, which contribute to their formation in the atmosphere.
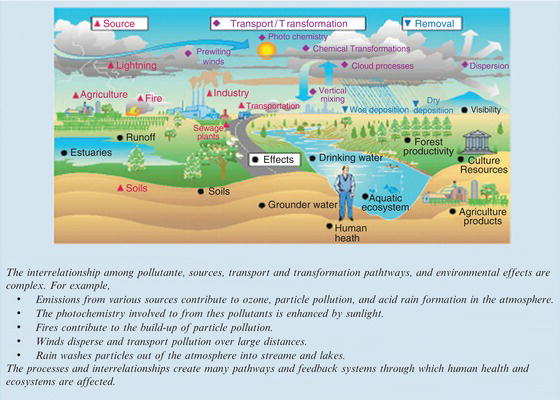
Some pollutants, such as carbon monoxide, sulfur dioxide, and lead, are produced in specific locations and then move through the environment. However, the pollution pathways for other components, such as ozone and nitrogen dioxide, are dependent on chemical transformations that occur in the atmosphere. They are impacted by temperature and the presence of sunlight and are therefore more difficult to assess. Figure 3.2 presents the most common air pollution pathways.
Ozone exists both near the ground (in the troposphere) and in the stratosphere. We need the ozone layer in the stratosphere (10 to 30 miles above the earth) to provide protection from the harmful UV rays from the sun. It is believed that 95–99% of the sun’s ultraviolet radiation is captured by the ozone layer before reaching earth’s surface, through a complex series of chemical reactions.
Figure 3.2. Common air pollution pathways [2].
The formation of ozone in the upper levels of the atmosphere is catalyzed by ultraviolet radiation that breaks apart oxygen to form two oxygen radicals as products. This process is called photodissociation. Then, the oxygen radical reacts with a second oxygen molecule to produce ozone, O3, which is relatively stable at atmospheric conditions.
Formation of ozone:


Under normal conditions the rate at which ozone is formed is balanced by the rate at which it is destroyed.
Destruction of ozone:

Therefore, the concentration of ozone in the stratosphere should stay relatively constant. However, the presence of ozone-depleting substances, such as chlorofluorocarbons (CFCs), interferes with the ozone cycle and impacts the concentration of ozone in the upper atmosphere. These materials can break down in the stratosphere to form Cl or Br radicals, which can interact with the ozone molecules to produce other radicals and oxygen (Highlight 3.1).
While ozone in the stratosphere performs an important function for life on earth, ozone near the ground is considered a toxin for both humans and the environment. Ozone is known as a pollutant especially during the summer when emissions of nitrogen oxides react with volatile organic compounds in the presence of sunlight. Ground-level ozone is considered a greenhouse gas and is known to play a role in climate change (Figure 3.3).
Ozone can be transported throughout the atmosphere by a variety of chemical and physical properties, as described in Figure 3.4.
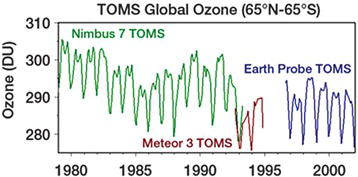
Changes in weather patterns contribute to differences in ozone concentrations from year to year and from region to region. The concentration also varies by time of year, with greater ozone concentrations reported in the summer when atmospheric temperatures are higher. The presence of the ozone hole over the Antarctic results from the combination of normal ozone cycling and depleted ozone layers. Since the inception of the Montreal Protocol in 1989 and the elimination of the use of CFCs in the late 1970s, the ozone concentration in the stratosphere has rebounded somewhat (Figure 3.5).
Carbon monoxide (CO) is a colorless and odorless gas found mainly as a product of incomplete combustion of carbon in fuel. Carbon monoxide emissions are higher in heavy traffic areas, but also near metal processing industries, residential wood burning, and when forest fires are occurring. Burning carbon-containing substances in oxygen is called combustion and is presented in Highlight 3.2.


Figure 3.3. Comparison between tropospheric and stratospheric ozone [3].
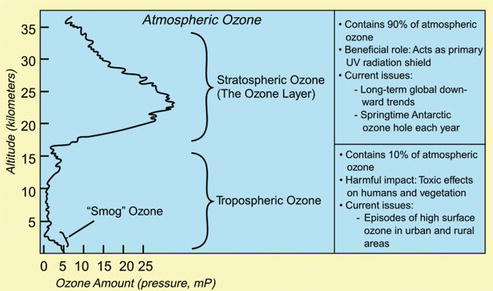
Figure 3.4. Long-range transport of aerosols and gases and effects on ozone production and destruction [4].
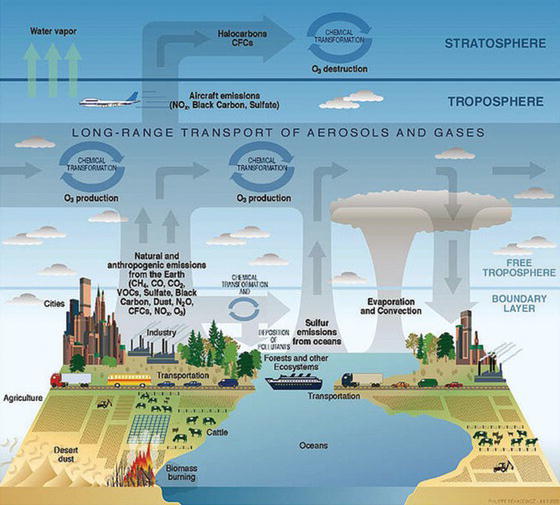
Figure 3.5. Changing ozone concentrations through annual and periodic cycling [5].

Sulfur dioxide (SO2) is a gas also formed from the combustion of sulfur-containing fuels such as coal or oil. Almost 90% of sulfur dioxide present in the air is due exclusively to fuel combustion. Sulfur dioxide is also a major contributor to the formation of sulfuric acid, which then causes acid rain when mixed with moisture in the atmosphere. In the presence of oxygen and water, sulfuric acid is produced through a two-step reaction process:
Step 1: Sulfur dioxide reacts with oxygen to produce sulfur trioxide (SO3)

Step 2: Sulfur trioxide can further react with water to produce sulfuric acid (H2SO4)

Large amounts of acidic precipitation can cause serious environmental damage by changing the pH of the soil (effect on pH of the soil is discussed in Section 3.1.3, Chemistry of the Land). Sulfuric acid also reacts with limestone, which is one of the principal components of many of the ancient statues and historical buildings, damaging the preserved artifacts of the past.
Nitrogen oxides, NOx, originate from combustion reactions, especially reactions that use air as the source of oxygen. The nitrogen and oxygen present in the fuel react to form nitrogen monoxide (NO), which can subsequently be converted to nitrogen dioxide (NO2) by reaction with oxygen at high temperatures:

Major sources of nitrogen oxide emissions are automobiles, power plants and any industry where high temperature combustion is involved.
As mentioned in Highlight 3.2, combustion of carbon-based substances such as coal, petroleum, and natural gas form CO2 as the oxidation end product. These products are released into the atmosphere, leading to billions of metric tons of anthropogenic (human-made) carbon dioxide in the atmosphere.
Volatile organic compounds or VOCs are both human-made and naturally occurring. The biologically derived VOCs are from plants, especially the leaves and stomata. Conifers are known to emit terpenes, major components of resin and a major class of VOCs. Principal human-made sources include solvents used in paints and coatings, cleaning products and refrigerants based on CFCs, now banned or highly regulated, the toxic and volatile organic compound formaldehyde or methanal, used as a precursor for polymers, and methyl tert-butyl ether or MTBE, a persistant flammable and colorless liquid used in engine gasoline as antiknocking agent in the 1970s and 1980s.
Particle pollution is a general term for a mixture of solid particles, which can be seen as dust or dirt or which are too small to be detected with our naked eyes (fine particles).
Larger solid particles are called particulates. When pollutant particles are inserted into water droplets or when finely divided solids are dispersed in a gas, they form a type of colloid called an aerosol. Fogs and smoke are common aerosols.
Indoor air pollution is becoming more and more of an issue. Asthma mainly affects young children under five years old. According to the EPA, about 25.7 million people in the United States were reported to have asthma in 2012, including 7.1 million children. There were nearly 2 million emergency room visits due to asthma. Asthma is ranked third in the cause of hospitalizations for children under 15, with a total estimated cost of almost $56 billion, and approximately 10.5 million school days missed each year [7]. Poor ventilation in schools, molds, and radon are the most common sources of indoor air pollution and are the source of thousands of deaths every year. Radon, a natural radioactive gas that can’t be seen, smelled, or tasted, is the second leading cause of lung cancer in the United States today [8]. See Highlight 3.3.
There are many other indoor air pollutants that contribute further to the degradation of human health. Formaldehyde resins are often used in carpet and other plastic products. These materials continuously degas solvent trapped in the product during the manufacturing process. In the confined space of a home, these toxic gases can accumulate, creating a hazardous condition in the home.
As a counterpart to the Clean Air Act, the Clean Water Act of 1972 promoted regulations for discharge of pollutants into U.S. waters and for quality standards for surface waters.
Water covers 71% of the earth’s surface. Ocean water contains about 3.5% salt. The salt is primarily sodium chloride (NaCl) but other ionic species in sea salt include magnesium (Mg2+), sulfate (SO42−), calcium (Ca2+), and potassium (K+) ions. The minerals present in seawater are produced when rain deposits on the land and degrades the soils and rocks to produce dissolved minerals, which ultimately accumulate in the oceans. The concentration of salt in the water is termed salinity and describes the amount of dissolved salt.
The oceans contain 97.2% of the earth’s water, making sources of fresh water scarce but hugely important. Fresh water also contains salt, although at concentrations typically less than about 1000 ppm (or 0.1% by weight).
Water contains dissolved gases as well. Oxygen dissolved in water is a vital element that allows sea life to thrive, since oxygen is essential for all living things. Fish can extract the oxygen from the seawater through their gills. Nitrogen can also be found in the water, although in this case it is likely from runoff of nitrogen applied to the land as a crop fertilizer. Nitrogen works equally well as a fertilizer on the land or in the ocean. The presence of high levels of nitrogen in the water can lead to eutrophication, a situation that occurs when too much plant matter consumes all of the available oxygen. Under these situations, there is insufficient oxygen in the water for fish and other marine animals.
Carbon dioxide is another important dissolved gas, as the dissolution of CO2 into the ocean impacts the amount of carbon dioxide present in the atmosphere. Carbon dioxide can also react with water to produce carbonates and carbonic acid, which changes the pH of the oceans.
The reversible reaction of carbon dioxide with water produces carbonic acid or hydrogen carbonate:

As more CO2 accumulates, the equilibrium shifts to increase the amount of acid formed, lowering the pH. The pH, which is a measure of the acidity or basicity of a solution, varies from 0 to 14 on a logarithmic scale. Acidic solutions have a pH between 0 and 7 whereas basic or alkaline solutions have a higher pH between 7 and 14. Discussion on acids and bases and pH of solutions is the topic of Chapter 5. The change in ocean acidity significantly affects coral in the ocean, since coral growth requires carbonate, the concentration of which is reduced by increasing acidity.
There are many types of water pollutants coming either from point sources such as sewage and industrial waste or from nonpoint sources such as agricultural runoff and storm water drainage. Water impairment includes excess levels of nutrients, metals (primarily mercury), sediment and organic enrichment due to agricultural activities, industrial and municipal discharges, atmospheric deposition, and unknown specific sources. More recently, pharmaceuticals and personal care products have been detected in U.S. waters at low concentrations.
Availability of potable water for food irrigation, industry, and domestic uses is likely to decline due to climate change, population increase, urban encroachment, and increasing levels of pollutants in water supplies. Preservation of water to sustain ecosystems is a topic of interest to environmentalists, ecologists, and biologists. During the 20th century, more than half of the world’s wetlands have been lost through increased irrigated land and intensive dam construction. Increased demand, through growth in industrial and energy sectors, increases the challenge. Numbers are alarming: “40–50% of the globally available freshwater is used by humans, from which 70% is used for agriculture, 22% for industry, and 8% for domestic purposes” [9]. It is predicted that the total amount of water needs for human consumption will increase five times relative to that at the beginning of the 20th century.
The lack of potable water is even more severe in developing countries, as increased urbanization threatens existing water supplies. Water security (and thus food security) remains among the most important issues in these places. Acute contamination of drinking water by arsenic and 29 other metals such as lead, cadmium, and mercury in the rural population of Bangladesh and India became a major public health problem in the mid-1990s. Tens of millions of people were drinking untreated well water from naturally occurring aquifers in the flood plains. Thousands of people are already affected by arsenic poisoning, which can lead to several types of cancers. The arsenic poisoning in Bangladesh is the largest mass poisoning of a population in history according to the World Health Organization (WHO) [10].
The earth’s surface contains rocks and minerals, as well as clays and soils. The minerals may take many forms, including primary aluminosilicate minerals and other complex species that makeup the hard surface, or crust, of the planet. Aluminosilicates are made from aluminum, silicon, and oxygen and account for approximately 82% of the earth’s crust by weight. Because of their structure, the soil surface chemistry is dominated by the reactions that occur on oxide and hydroxide-rich surfaces. These surfaces are extremely hydrophilic, layers of adsorbed water molecules surrounded by varying volumes of “bulk” water.
Different soils contain different mineral structures and thus exhibit varying properties. Olivines contain elements including iron and magnesium. Other species, such as quartz, contain only silicon and oxygen, whereas feldspar is a mineral containing a fixed 1:4 ratio of aluminum to silicon. Clays, such as kaolinite, are more complex structures that contain layers of minerals arranged in sheets, often with embedded water between the sheets. Soil minerals are important because of their ionic properties; they may be dissolved in water and they may react with other dissolved minerals through exchange reactions.
Exchange reactions are also called metathesis or double-displacement reactions in which ions are interchanged between two partners. The general reaction can be summarized as

where A and C are cations (positively charged species) and B and D are anions (negatively charged species).
An example of an exchange reaction involving two salts soluble in water is the following:

The roman numeral II indicates the 2+ charge present on the lead cation, Pb2+. Lead can also exist as lead(I) or Pb+. Lead(II) nitrate is an inorganic compound, soluble in water, which was historically used in the production of pigments for lead-based paints; such pigments have now been replaced by the less toxic titanium oxide, also found in sunscreen and food coloring. Potassium chromate is a yellow chemical indicator and a carcinogen; when lead nitrate and potassium chromate react, an orange-yellow precipitate of lead(II) chromate is formed. The molecular equation is the following:

Because the chromate ions are insoluble in water, lead chromate precipitates and solid particles are produced. A precipitate is an insoluble solid that does not break down into its respective ions in water.
The complete ionic reaction shows the dissociation of all aqueous compounds into their respective ions (since lead chromate is insoluble, it stays as a solid and does not dissociate):

The net ionic reaction is the final reaction showing the removal of all spectator ions (spectator ions are ions present on both sides of the equation):

Common ions, exchange reactions, and other types of chemical reactions are discussed in detail in Chapter 6.
Organic matter in soil comes from the decomposition of plants and animals. Knowledge of environmental soil chemistry is paramount to predicting the fate, mobility, and potential toxicity of contaminants in the environment. The wide array of organic materials that lead to soil formation produces a largely heterogeneous material containing different particle sizes and organic species with varying solubilities and functional grouping. Because soils come from decayed organic matter, they contain amino (RNH2 or R2NH or R3N), carbonyl (−COH, where C is double bonded to the O), carboxyl (−COOH, where C is double bonded to the first O), and other functional groups that impart added charge and critical properties to the soil structure. The main functional groups and their properties are covered in Chapter 5.
Soil pH is a measure of the soil acidity or soil alkalinity. Because pH can affect the availability of nutrients, it is an important consideration for soil quality. Most crops prefer a neutral or slightly acidic soil. The pH is controlled by the addition of amendments to the soil; the addition of minerals such as lime (calcium hydroxide Ca(OH)2) can increase the soil pH, whereas nitrogen-containing amendments lead to increased acidification. Fertilizer can also be added to the soil to ensure the availability of nutrients, specifically the macronutrients nitrogen, phosphorus, and potassium.
The change in land use has had profound effects on the environment. Intensive urbanization, deforestation, and exhaustive agriculture have impacted biodiversity, air and water quality, and carbon cycles. Soil depletion occurs when the components that contribute to fertility are removed and not replaced, and the conditions that support soil fertility are not maintained. The loss of organic matter means less decomposition of the organic component of the soil, and thus loss of useful land. The combined effects of growing population densities, large-scale industrial logging, and increased agricultural activity have led to almost total nutrient removal in some soils.
The impact of deforestation for use as pasture, urban use, arable land, or wasteland is startling. About 47% of the world’s forests, including much of the world’s tropical rain forests, have been lost to human use [9]. This affects the world’s biodiversity, the water and soil quality, and the ability of plants to promote air purification. Forests provide free ecosystem services in terms of sequestration of carbon, water retention in the soil and groundwater, and atmospheric moisture. In developing countries, the rate of deforestation is driven by population growth and food production (economic incentive as well). In African countries, the rapid human population growth and the need for wood to build houses and for use as a fuel contributes to deforestation, with resulting desertification, water resource degradation, atmospheric pollution, and soil loss. The deforestation rate in the Amazon is setting a new record of 69% in 2008 compared to 2007. Almost 90% of West Africa’s rain forest has already been destroyed [11].
Deforestation not only affects the local climate, the water cycle, and the soil but also plays a role in species extinction. Some scientists forecast that up to half of presently existing species may become extinct by 2100 [9], a substantial loss in biodiversity.
Expansion of agricultural land, urbanization, and industrialization are the major causes of land pollution. The intensification of agriculture and mechanization results in loss of habitat and shelter for wildlife. More intensive agriculture also requires more pesticides, herbicides, and insecticides to be used. A pesticide is exactly what it sounds like, a substance designed to prevent, destroy, or repel a pest (generally an insect or other type of organism). Typically, a pesticide is a chemical or biological species designed to act against a specific infestation. After they perform their function against the desired species, they can accumulate in the soil, resulting in long-term decrease of the fertility of the land. Remember, what is toxic to an insect will be toxic to other species in a sufficiently high dose. Pesticides are also problematic, in that only 2% of the applied pesticides actually reach their intended target; the remainder ends up in the air and water. Some chlorinated organic pesticides, containing carbon, hydrogen, and chlorine atoms, are classified as persistent organic pollutants (POPs), materials that resist degradation and remain in the environment for years.
Figure 3.6. Chemical structure of DDT.
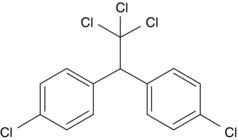
Insecticides have a nonnegligible impact on health and the environment as well. Synthetic insecticides such as organochlorines (particularly the famous DDT (Figure 3.6), dichlorodiphenyltrichloroethane, put into the spotlight by Rachel Carson in her renowned book Silent Spring) and organophosphates (such as Parathion) were well known to cause damage to fish, birds, animals, and the nervous systems of humans. DDT, which is very cheap to produce, was banned in the United States and in most developed countries in the 1970s to 1980s, but many developing countries still lack strict pesticide regulations.
Herbicides are designed to kill undesired plants. Herbicides are widely used in agriculture and in landscape turf management. In the United States, they account for about 70% of all agricultural pesticide use. Most herbicides are organic in nature and thus are mostly biodegradable by soil bacteria. Unfortunately, many herbicides also contain chlorinated dioxins such as 2,3,7,8-tetrachlorodibenzo-p-dioxin (TCDD) as an impurity. Dioxin is among the most carcinogenic and toxic human-made organic compounds produced. Pollution by dioxin made headlines years ago when the small town of Times Beach in Missouri (mentioned in Chapter 1) had to be completely evacuated in the mid-1980s due to the presence of dioxin in the soil. The town was completely demolished in 1992. Dioxin is also a major impurity in the defoliant Agent Orange that was used extensively to clear the jungles of Vietnam during the U.S. military activity in the early 1970s.
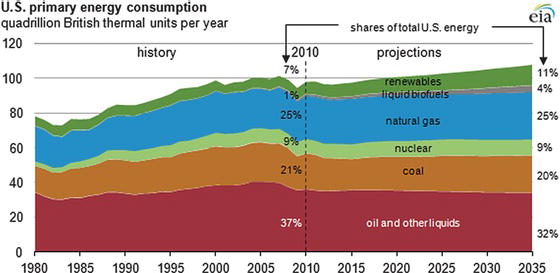
Our economy runs on energy, very large quantities of energy. The chart in Figure 3.7, prepared from data provided by the Department of Energy’s Energy Information Agency in 2010, indicates the total amount of fuel consumption in the United States, using current information and projects the expected consumption for the next 25 years. Today, the United States consumes roughly 100 quadrillion BTUs (also termed a quad) of energy (100 × 1012 BTU, or 105 × 1012 MJ). A quad is a unit of energy equal to 1015 (a short-scale quadrillion) BTU (British thermal unit) or 1.055 × 10¹⁸ joules in SI units. In the United States, energy is produced mainly from coal, natural gas, and liquids (petroleum derived from oil), with nuclear and renewable sources making up the next largest elements. Projections call for an increasing proportion of energy to be supplied from renewable sources, however, even over the next 25 years, 75% of the U.S. energy supply is expected to be derived from fossil resources.
Figure 3.7. Fuel consumption in the United States: actual situation and projection [11].
Energy is consumed for nearly every sector of the economy. The greatest consumption is for industrial processes; that is, the manufacture of products, including chemical products. Transportation makes up the next largest sector of the energy consumption, and while industrial consumption is projected to be somewhat level over the next 25 years, the transportation consumption is projected to increase by roughly 15%. Residential use corresponds to the energy used in the home, including lighting, air conditioning, and other appliances, whereas commercial energy consumption corresponds to consumption in stores and offices (Figure 3.8).
Another way of looking at the energy consumption is through the energy flow diagram, which relates the sources of energy production and the areas in which they are consumed. Domestic energy production amounts to approximately 73 quads, compared to domestic consumption of over 99 quads. The roughly 26 quads of energy imports correspond to concerns regarding energy security faced in the United States (Figure 3.9).
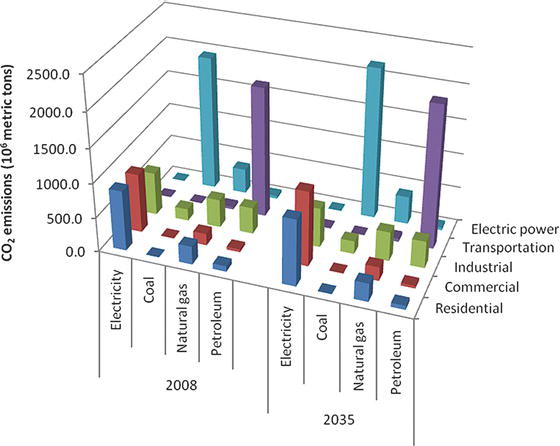
The production of energy from fossil resources leads to significant environmental impacts. Figure 3.10 summarizes CO2 emissions based on source of energy production and sector of usage, both for 2008 and projected for 2035. The current total emissions associated with energy generation are 5.8 × 10¹² kg of CO2, expected to increase to 6.3 × 10¹² kg of CO2 emissions by 2035. The CO2 production depends greatly on the type of fuel being consumed, and the type of fuel depends heavily on the sector of use. For example, the transportation sector consumes mostly petroleum-based products, whereas coal and some natural gas are used in the generation of electricity. Energy production also produces other emissions, including SO2 and NOx. Interestingly, the generation of SO2 emissions is projected to decrease from roughly 10,000 kg today to approximately 3000 kg in 2035, as greater amounts of natural gas are used to produce the increasing electricity demand.
Figure 3.8. Energy consumption per sector of economy [12].
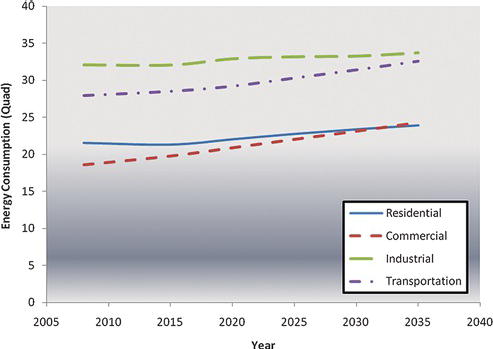
Figure 3.9. Sources of energy production and consumption [13].
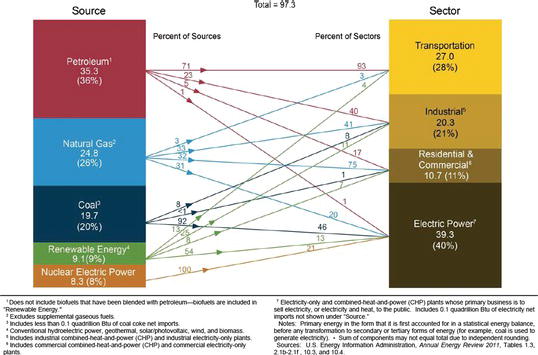
Figure 3.10. Emissions of CO2 based on source of energy production and sector of usage for 2008 and prediction for 2035 [12].
In addition to the CO2 impacts, energy generation has significant other environmental concerns. Coal contains substantial quantities of arsenic, mercury, chromium, and cadmium, which are emitted into the atmosphere when coal is burned to produce energy and can be discharged into drinking water through ash and sludge. Waste created by a typical 500-megawatt coal plant includes more than 125,000 tons of ash and 193,000 tons of sludge from the smokestack scrubber each year. In addition, much of the heat produced from burning coal is wasted, since only about 33–35% of the heat of combustion is used to produce electricity. The majority of the heat is released into the atmosphere or absorbed by the cooling water. As much as 2.2 billion gallons of water is used for cooling a typical coal-fired power plant. After use, the heated water is returned to the original water source, and since the return water is hotter (by up to 20–25 °F), the source water becomes hotter, leading to ecosystem malfunction. The production of coal impacts the land as well, as much of the coal is obtained through strip mining.
Combustion of oil produces CO2, a contributor to global warming, and while oil combustion is more efficient than combustion of coal, it is less efficient than natural gas. Oil is unique as a liquid fuel and thus is used predominantly in the transportation sector, making reduction of emissions more challenging. Oil extraction can be damaging to the environment, and more frequently, offshore sources are being used with increased environmental consequences. Extraction involves drilling and dredging, which disturbs the seabed and damages sensitive coral and other marine life. Spills and leaks from drilling operations and transportation in tankers have produced serious environmental consequences, including oil washing up on beaches and fouling of birds and other wildlife. The disastrous Deepwater Horizon spill in the Gulf of Mexico in April 2010, dumping more than 11 million gallons of oil into the Gulf, has cost over $3 billion in economic claims for cleanup and loss of income, closed 6800 square miles of federal fishing areas, and resulted in countless deaths of sea turtles and other marine wildlife.
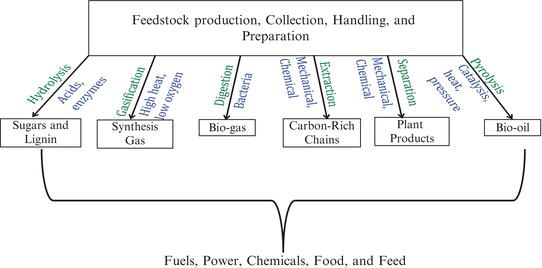
Within the context of green chemistry and engineering, the most significant opportunity is in the use of biomass as an energy resource. Biomass is energy converted from sunlight by trees and plants. In general, there are two approaches to generating biomass energy, either growing plants specifically for energy use (energy crops) or using the residues from plants that are used for other needs. Trees and grasses that are native to a region are the most sustainable energy crops since they grow naturally in the environment without the need for fertilizers, pesticides, or other potential contaminants. For example, switchgrass grows quickly in many parts of the country and can be harvested for up to 10 years before replanting. Conversion of biomass energy can be achieved through combustion, usually by co-firing with coal in a modified coal-fired power plant. Other routes for conversion, including thermal or biological conversion, can also be achieved; conversion of biomass to liquid fuels represents one of the few alternatives to the production of petroleum products for use in the transportation sector. The “biorefinery,” as depicted in Figure 3.11, describes opportunities for conversion of biomass to useful chemical products.
Because biomass is an inherent part of the carbon cycle, combustion of biomass reduces air pollution. The carbon dioxide that is produced during combustion was recently fixed into the biomass material, and thus from a life cycle perspective, CO2 emissions are reduced by 90% compared with fossil fuels. Sulfur dioxide and other pollutants are also reduced substantially. Biomass energy also brings other environmental advantages. Water pollution is decreased because less fertilizer is needed. Soil quality is improved and erosion is reduced, and wildlife habitat is restored. Note that these benefits are obtained from the use of native biomass, and the use of energy crops has many of the same challenges as those currently associated with food crops.
Figure 3.11. Uses for conversion of biomass.
As defined earlier and according to Paul Anastas, green chemistry is the “pathway to ensuring economic and environmental prosperity.” It is not cleaning the mess with bandages. Pollution prevention provides opportunities to focus on the key concepts of reduce, reuse, and recycle. Reuse has become a key business concept, representing a multimillion-dollar business in the past 15 years. Waste disposal costs money, not the least of which is the cost of cleaning the waste to make sure that it can be disposed of while proper regulations are followed. It also takes time to clean up and it affects productivity. Waste is not an unavoidable cost of doing business. Protecting the environment and making money go hand-in-hand; it is not a trade-off anymore.
According to the EPA, pollution prevention (P2) is about “reducing or eliminating waste at the source by modifying production processes, promoting the use of non-toxic or less-toxic substances, implementing conservation techniques, and re-using materials rather than putting them into the waste stream.” The EPA’s Office of Pollution Prevention and Toxics (OPPT) investigated approaches on how pollution prevention is applied to the different areas mentioned above such as air and water pollution. Three case studies are presented here [14].
In 2006, Archer Daniels Midland Company in Clinton, Iowa, a major corn products manufacturer, took multiple initiatives to reduce its air emissions. First, a software system was developed to monitor all pollution-related parameters, which was used to optimize operating conditions that would reduce air emissions. Second, after studying the results of the monitoring it was found that about 25–30% of the ash produced by processing boilers could be reused as raw material in cement, concrete blocks, and other products. Archer Daniels Midland Company predicted that approximately 57,500 tons of ash could be reused and potentially $250,000 could be saved annually through this “reuse” strategy. Third, a survey about trash located at the facilities led to a concern about significant quantities of cardboard and steel not being recycled. Recycling cardboard could save an additional $40,000 per year and $104,000 could be gained from metal scrap recovery.
Water conservation represents another area for reuse. Dean Chem in Houston, Texas, an electroplating company, has been collecting rainwater through gutters and uses the collected water in their rinsing processes. Although the total volume of collected water is less than 5000 gallons annually, this company is leading the way toward water conservation. On a smaller scale, rainwater collection can be done through rain barrels connected to the gutters of a house. This allows for watering of shrubs, flowers, and vegetables without the use of well or city water.
Reducing hazardous waste is a priority for MerCruiser in Stillwater, Oklahoma. All new products introduced are evaluated according to a “Green Tag” review. The intended usage, temperature, location, and amount of material to be used as well as Material Safety Data Sheets (MSDS) are assessed. In their painting operations they use powder coatings, which prevent paint from being wasted. They also separate and recycle metals by type, which yields approximately $130,000 estimated savings per year, and have installed equipment to compress metal chips, which are then remelted in furnaces.
These three case studies are only a few among hundreds. Pollution prevention, as one of the pillars of green chemistry, is an essential component of the sustainability pathway.
One way to measure the environmental impacts of a process is by analyzing the ecotoxicity of the effluents from the process. The study of ecotoxicity is termed ecotoxicology, which is defined according to Ecotoxicology Encyclopedia as “a field of science that studies the effects of toxic substances on ecosystems” [15]. The goals of ecotoxicology are to assess environmental damage from pollution on people, plants, and animals, and to predict the consequences of human actions on different ecosystems. For a population to do well in the environment, they need to survive to be old enough to reproduce, grow to be big enough to reproduce, and eventually reproduce. The goal of ecotoxicity is to understand the concentration of chemicals at which organisms in the environment will be affected.
Assessment tools used in ecotoxicology range from toxicity tests (link the response of damaged biological systems to a particular substance), chemical analyses of substances (proof of the presence of a toxicant), and field surveys (characteristics of the damaged ecosystem). These three tools help in the assessment of risk. Indirect effects of toxicants are more difficult to predict. For example, an organism’s response to a toxicant depends on the presence of other organisms in the community and also on the environmental conditions. Most of the relationships between environmental conditions and toxicity have yet to be established.
It is impossible to test all of the millions of species on this planet before a chemical is used. Ecotoxicologists test a few “representative” species in the food chain, starting with the insect eating algae, to the fish eating the insect, through a bigger fish eating the smaller one, and often ending with human consumption. While statistical methods exist to predict the response of organisms, the complexity of ecosystems, the large number of interacting species, and the complex mixture of chemicals released into the environment minimize the effectiveness of simulation models. The U.S. EPA Office of Research and Development (ORD) and the National Health and Environmental Effects Research Laboratory’s (NHEERL’s) Mid-Continent Ecology Division (MED) created the ECOTOXicology database named ECOTOX. According to the EPA, “ECOTOX integrates three previously independent databases—AQUIRE, PHYTOTOX, and TERRETOX––into a unique system which includes toxicity data derived predominantly from the peer-reviewed literature, for aquatic life, terrestrial plants, and terrestrial wildlife, respectively” [16]. The database is available on EPA’s public webpage and includes more than 620,031 records addressing the adverse effects of 10,101 chemicals to 10,285 species as of June 2012. This database is updated quarterly and contains information about the chemical species impact on plant, terrestrial animal, and aquatic species, as well as test methods.
Two measures are typically used for measurement of ecotoxicity. The first of these measures is the lethal dose, usually written as LD50, which is a measure of the short-term poisoning potential or acute toxicity of a substance. The LD50 is the amount of a material, given all at once, which causes the death of 50% of a group of test animals. Measurement of LD50 provides a description of the terrestrial toxicity; that is, the potential for poisoning associated with chemicals in a land environment. While virtually any type of animal can be used for an LD50 test, rats and mice are most common. One can also look at numerous types of exposure, including most commonly tests of dermal (skin) and oral (by mouth) exposure. For smaller animals, the LD50 is usually tabulated as the amount of chemical administered (e.g., milligrams) per 100 grams of test animal body weight.
While LD50 is a common measure of toxicity, its value is limited in that it only measures acute toxicity and does not provide any information on chronic toxicity (which could lead to health challenges based on exposure to lower doses over a longer period of time). Likewise, it does not take into account toxic effects that are serious but do not result in death. Finally, there can be wide variability between species, with a chemical that is relatively safe for rats perhaps being extremely toxic for humans. Thus, extrapolation of toxicity data may be difficult. It is also important to note that all substances, when administered in high doses, can be toxic. For example, sucrose, otherwise known as table sugar or cane sugar, has an LD50 value in rats at 29,700 mg/kg when administered orally [17].
A second measure of toxicity is the LC50, or lethal concentration at which 50% of the organisms tested will be killed by exposure to the test chemical. LC50 is usually used to measure the toxicity in the environment, such as the concentration in water or air. LC50 toxicity of an effluent can be tested in either flow-through or static mode. In flow-through testing, various concentrations of fresh effluent are pumped through test chambers for a predetermined length of time. In a static test, the assay organisms are exposed to the same test samples for the duration of the test. Frequently, a small, developing organism such as Daphnia, an organism that is low on the aquatic food chain, is used as a model for testing effluent toxicity. Daphnia makes an excellent indicator species because of its short life span and rapid reproductive capabilities. In addition, they are nearly transparent, making their internal organs easy to study in live specimens. The developing organism has high sensitivity to the toxic material because of its rapid growth in the environment, and thus abnormal development, growth or death, is easily observed. The EPA program, ECOSAR, predicts toxicity of chemicals released into water to aquatic life (fish, algae, and invertebrates).
It is noticeable that toxicology is rarely included in the core courses of traditional chemistry curriculum. Even in the eight years (minimum) it requires to get a PhD, students with a PhD are not usually exposed to toxicology. Thus, students wishing to become educated on the environmental aspects of chemistry need to take elective coursework in toxicology, so that they can relate the impacts of a chemical release to its effects in the environment.
When completing an environmental analysis, it is important to evaluate the full life cycle of a product or process. The life cycle includes all of the elements of a particular product, from the extraction of raw materials, to the manufacture of the product, transportation at all stages, use of the product, and eventually disposal. In the context of a chemical product, one often focuses on the environmental issues associated with manufacture, use, and disposal, and there is an emphasis on the direct environmental impacts of the material. Thus, we generally consider the chemicals that are engaged in the production of the desired chemical product, the harm associated with the use of a specific chemical product, and the disposal of the chemical wastes (including those generated through the manufacture of the product).
The assessment analysis is a long and complex process that follows the procedures established through the International Standards Organization (ISO) through its 14000 series set of standards. The ISO 14000 delineates a series of steps that includes:
The overall analysis combines all of these elements into a single measure that would allow one to compare multiple opportunities to determine which of these would have the least environmental harm, as described in Figure 3.12.
Figure 3.12. Life cycle inventory.

When applied over the entire life cycle of a material, a full analysis of the chemical product can be completed. It is important to note, however, that no analysis can be completely objective, since the valuation phase often comes down to an individual assessment of critical environmental elements. Thus, the valuation phase attempts to compare the impact of loss of biodiversity against emissions of greenhouse gases, a subjective decision.
As seen in the previous sections, chemicals and manufactured products can impact the environment in numerous ways, from greenhouse gas impacts, to toxicity in the water, to land use changes. The minimization of these impacts requires a consistent method of evaluating the impacts of these materials, so that one can conduct an overall assessment of environmental impact analysis. One such example is through the U.S. EPA’s Tool for the Reduction and Assessment of Chemical and Other Environmental Impacts (TRACI). The tool “facilitates the characterization of environmental stressors that have potential effects, including ozone depletion, global warming, acidification, eutrophication, tropospheric ozone (smog) formation, ecotoxicity, human health criteria–related effects, human health cancer effects, human health noncancer effects, fossil fuel depletion, and land-use effects” [18], using an overall methodology as seen in Figure 3.13.
Figure 3.13 illustrates how TRACI incorporates the steps of an environmental impact analysis. First, the various stressors are identified. For example, SO2 may be emitted in a particular process, which would be in the category of chemical emissions. This emission must then be assigned to an impact category or, in general, can be assigned to several impact categories through various effects in the environment. Continuing with the SO2 example, we know that SO2 can be oxidized by sunlight to produce H2SO4, which is then transported through the atmosphere and ultimately returns to earth through rainwater, leading to acid rain and lakes’ acidification. The amount of emissions can be quantified based on an analysis of the process, and thus the impacts of the emission leading to the acidification outcome can be quantified.
Figure 3.13. TRACI: Tool for the Reduction and Assessment of Chemical and Other Environmental Impacts [19].
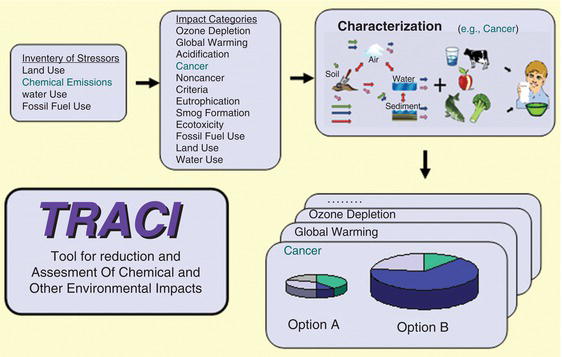
Any particular process has a range of impacts, and the relative impact of the emission can be related to a variety of characteristics of the emission. Clearly, the amount of the emission is important, although this is not the only criterion of importance. For example, the impact of SO2 emissions leading to acidification must be related to the impact of SO2 on climate change issues. Thus, one must not only consider the amount of the emission, but also the severity of the material being emitted. This leads to an analysis of equivalency, which returns us to the concept of LD50, which provides a method of comparing the emissions of one chemical against another. Computerized techniques such as TRACI take all of the inputs from the process and combine these emissions using a consistent set of equivalencies to produce an overall impact analysis for the process, and thus the ability to compare the environmental impacts of one substance against another, in a rigorous and consistent manner. Eventually, one must combine all of the analysis in the evaluation step, during which the various impacts are compared and combined. In this step, one must consider which environmental harm is considered more egregious. Thus, we weight the importance of impacts to human health, ecosystem damage, loss of mineral and fossil resources, and more. The weightings change over time because they are guided by society and vary across regions of the world. The following example provides evidence of the challenge associated with this analysis.
The 2007 Presidential Green Chemistry Challenge Award in Greener Synthetic Pathways for the development of a soy-based wood adhesive to replace formaldehyde-based adhesive used in hardwood panels provides an example that demonstrates significant environmental gain with limited downside [20]. The process, developed by Hercules, Inc. with Professor Kaicheng Li (Oregon State University) and Columbia Forest Products was inspired by natural adhesive found in mussels and tofu loaded with proteins. This is a winning recipe: the environmentally friendly adhesive made from soy flour is stronger and more water resistant than formaldehyde-based glues; it is also cost competitive and the process reduces air emissions by 50–90%. The soy-based adhesives do not contain formaldehyde or use formaldehyde as a raw material. The elimination of formaldehyde improves indoor air quality. The technology also creates a new market for soy flour, which helps to support the soybean industry.
Are there also negative impacts for the technology? Most likely, although these are not quantified in the analysis. If one increases the growth of soybeans for the production of the resin, then one may need to convert forested land into farmland, resulting in a loss of biodiversity. In addition, increased use of fertilizers and pesticides leads to increased eutrophication of lakes and streams. One should also evaluate the ecotoxicity of the pesticides and their impact on wildlife. While a full environmental assessment is needed to properly evaluate this new process, even a preliminary analysis suggests the value of this particular innovation.
However, the analysis is not always as compelling, and quite a large number of “environmental” concepts have later been shown to cause significant environmental concerns. The use of methyl-tertiary-butyl ether (MTBE) as a fuel additive helps to illustrate this point. MTBE was introduced into automotive fuels beginning in 1979 as an antiknocking agent and a replacement for tetraethyl lead. Its use increased dramatically until about 1999, as fuel manufacturers tried to comply with the requirements of the Clean Air Act amendments that increased the requirements for higher levels of oxygenates in fuel to reduce the emissions of greenhouse gases. However, in 1995, high levels of MTBE were unexpectedly found in drinking water wells throughout California, a result of the combination of MTBE in leaking underground storage tanks and its miscibility with water. Although not labeled as a carcinogen, the presence of MTBE in drinking water lends an unpleasant taste and odor, and thus causes the MTBE-containing water to become nonpotable. As a result, the use of MTBE has been curtailed significantly, and the Energy Policy Act of 2005 reduced the federal requirement for oxygen content in reformulated gasoline.
A similar controversy is associated with the use of ethanol. In Brazil, sugarcane is used as the raw material for production of ethanol. Because of the desire to become self-sufficient, Brazil developed policy expanding the amount of land dedicated to biofuel production. Is this really green? The impacts on the environment, land use practice, ecosystems, and working conditions and the role of international stakeholders have to be taken into account in decision making. Recent data suggests that Brazil risks incurring a 250-year carbon debt based on the deforestation expected by 2020 as it expands production of sugarcane ethanol and soybean biodiesel.
In the United States, corn is the primary source of ethanol. A 2010 Scientific American article delineates some of the challenges in evaluating the environmental impacts of this choice [21]. While the federal government has endorsed the use of corn ethanol as a means of reducing greenhouse gas emissions, the State of California has reached a different conclusion. California looked at current data, whereas the federal government used projections for 2022 and assumed higher crop yields, production efficiencies, and other breakthroughs that would mitigate emissions. Since fuel crops displace food crops, there is a short-term pulse of emissions as displaced farmers clear forests and cultivate previously undisturbed land. These emissions are dissipated over time, and when one looks at the overall emissions over the lifespan of the impact, the calculations can vary. Thus, it is clear that the way one calculates the impacts have a significant effect on the decision-making process.
While making an unequivocal environmental choice may not be possible, activities that will contribute to the well-being of both people and the natural environment over the long term should be considered. The following solutions proposed by the EPA suggest opportunities for good environmental stewardship [22, p. 142]:
In February 2007 an article published in C&EN magazine titled “Avoiding Global Collapse” summarized the status of our society:
What other societies had faced before us such as the abandoned pyramids of Mayan cities, Easter Island’s lonely Moai statues and abandoned Viking settlements in Greenland, we face the same collapse today. These ancient societies failed because of the same problems we are facing today: environmental damage, climate variation, support from trade partners, and a failure of society to respond to problems such as overconsumption of natural resources and overpopulation. We could add human induced climate change and environmental damage from chemical pollution accompanied by a lack in biodiversity. This is a scary perspective. Instead of giving up we should look at solutions to avoid the same mistakes.
Working together toward a more sustainable society includes responsibility, respect of natural resources (no farm and fisheries mining), conservation, preservation, and clever technological development. The three main pillars of sustainability are based on society, economics, and environment. Ray Anderson in his book Mid-course Correction: Toward a Sustainable Enterprise: The Interface Model defined three levels in the journey toward sustainability [23].
The resultant curve is an unlimited global benefit curve. Green chemistry and engineering is part of this resultant curve. It should become a standard operating practice, as it has been shown that sustainable business practices boost profits, increase productivity, and reduce waste. Sustainability is a global solution for everybody. It can proliferate from home to school, to our community and work, while shopping and also on the road.
While many of the problems associated with a clean environment are global in nature, the solutions to environmental concerns are the responsibility of every citizen of the earth. “Think globally, act locally” is a phrase that refers to the argument that global environmental problems can only be solved when one considers the ecological, economic, and cultural differences of our local surroundings. While federal and state agencies can enact environmental laws that encourage large organizations to take a more environmental stand, individuals need to come together to protect habitats and the organisms that live within them. As an environmentally conscious citizen, here are some guidelines about what you can do to make a difference.
At home and in the garden protecting the environment starts with:
The EPA’s “Schools Chemical Cleanout” campaign looks to reduce the number of hazardous chemicals in local schools and provides tips on responsible chemical management in area schools. And it’s not just about chemicals used in chemical laboratories. One also needs to consider the chemicals used in cleaning products in schools (or your home). The chemicals found in some cleaning products can cause health problems, including eye, nose, and throat irritation, as well as headaches. Cleaning products may also contain VOCs that can cause adverse health effects including asthma, upper respiratory irritation, fatigue, nasal congestion, nausea, and dizziness. Green cleaning products contain less of these hazardous materials and reduce the amount of chemicals in the environment.
Green purchasing provides another excellent opportunity to act locally, with global influence. As a consumer, you have the opportunity to purchase green products and Energy Star appliances. Buying energy-efficient products or fuel-efficient vehicles can make a big difference. Understanding the environmental impacts of household products can help inform sustainable choices. The business world has adopted environmentally preferable purchasing practices, which are now required by the federal government. As one of the world’s largest consumers, the impact of federal purchasing will propagate throughout the product life cycle. Environmentally preferable means “products or services that have a lesser or reduced effect on human health and the environment when compared with competing products or services that serve the same purpose,” according to the Instructions for Implementing Executive Order 13423. As an individual, you can look to make purchases that reduce your environmental footprint. As an example, when considering the purchase of paper, look for paper that has high postconsumer recycled content, is made from certified forest-safe trees, and is processed without chlorine. Use automatic duplexing for your printer, to take advantage of both sides of a sheet of paper, and reduce total paper consumption. Encourage the purchasing agent in your workplace or school to use environmentally preferred products, such as the paper described here, to multiply the impact of your local efforts.
Walmart has become a leading force in the development of environmentally preferable products. According to their website: “Our customers desire products that are more efficient, last longer and perform better. They want to know the product’s entire lifecycle. They want to know the materials in the product are safe, that it is made well and is produced in a responsible way” [23]. In order to help quantify the environmental impact of products sold in Walmart stores, they have developed the Sustainability Index, to help promote transparency and support product innovation. In the early stages of development, the index will bring together information from a range of sources to create a single metric that will allow the consumer to identify which product might cause more harm to the environment, and they are using a consortium of universities, suppliers, retailers, nongovernmental organizations, and government officials to develop a global database of information on products’ life cycles.
When you travel, you should also consider the opportunities to reduce your environmental impact. The EPA and BlueGreen Meetings provide information on how to make your meeting attendance more environmentally friendly. Many of these tips can be adopted for leisure travel as well. For example, hotels are now using energy-efficient lighting and incorporating linen reuse programs to reduce the amount of water consumption. Hotels use an average of 209 gallons of water each day for each occupied room. A linen reuse program can save up to 30% on water usage (that’s roughly 60 gallons of water). Decreasing water consumption reduces operating costs, making the choice of environmental stewardship not only rewarding but also profitable.
In short, there are many opportunities to decrease your personal environmental footprint and adopt more sustainable personal practices. Using the multiplying power associated with large-scale adoption, it is clear that the greatest force leading to a more sustainable society is the power of the consumer. Choose wisely.
1. http://www.epa.gov/airtrends/images/comparison70.jpg.
2. http://www.epa.gov/airtrends/2007/report/trends_report_full.pdf.
3. http://en.wikipedia.org/wiki/File:Atmospheric_ozone.svg.
4. http://en.wikipedia.org/wiki/File:Atmosphere_composition_diagram.jpg.
5. http://en.wikipedia.org/wiki/File:TOMS_Global_Ozone_65N-65S.png. http://www.cdc.gov/mmwr/preview/mmwrhtml/mm5650a1.htm.
6. http://www.epa.gov/asthma/pdfs/asthma_fact_sheet_en.pdf.
7. http://en.wikipedia.org/wiki/Radon.
8. http://en.wikipedia.org/wiki/Sustainability.
9. http://www.who.int/water_sanitation_health/dwq/wsh0306/en/.
10. http://en.wikipedia.org/wiki/Deforestation.
11. U.S. Energy Information Administration, Annual Energy Outlook 2012 Early Release. Available at http://www.eia.gov/forecasts/aeo/er/.
12. http://www.eia.gov/totalenergy/data/annual/pdf/sec2_3.pdf.
13. http://www.epa.gov/p2/pubs/casestudies/index.htm.
14. http://en.wikipedia.org/wiki/Ecotoxicology.
15. http://www.epa.gov/ecotox.
16. http://chemlabs.uoregon.edu/Safety/toxicity.html.
17. Bare, J.; Norris, G.; Pennington, D.; McKone, T. J. Indust. Ecol., 2003, 6(3–4), 49–78.
18. http://www.epa.gov/nrmrl/std/sab/traci/.
19. http://www.epa.gov/greenchemistry/pubs/pgcc/winners/gspa07.html.
20. http://www.scientificamerican.com/article.cfm?id= ethanol-corn-climate.
21. “Everyday choices: Opportunities for environmental stewardship” technical report. Available at http://www.epa.gov/environmentalinnovation/pdf/techrpt.pdf.
22. Anderson, R. C. Mid-course Correction: Toward a Sustainable Enterprise: The Interface Model, Chelsea Green Publishing Company, White River Junction, VT, 1998.