Regarding the stepping functionalities we discussed earlier, they are significantly useful for controlling the execution of the program we'd like to debug, but we were unable to truly examine the value of the variables we care about (a and b), even if we could control our program execution, in our current example. To do this, we can use watches.
Watches in debugging are a mechanism that programmers can use to follow the changes that are taking place in specific variables. Once a watch has been created for a variable, the value of that variable will be updated at each stage as you step through the program you are debugging. In comparison to inline debugging, watches are a more active and in-depth way to monitor your variables.
Much like the Variables section, watches will display the specified variables and their respective values. But these variables are kept throughout the program, as opposed to in the Variables section, where the list of displayed variables is changed with respect to the frame the program execution is currently at.
In the Debug panel, you may only have the Frames section and the Variables section. There is also an additional section called Watches, which is activated when the watches button  (located in the top right corner of the panel) is clicked. Let's get started:
- Once the Watches section is open, click on the + button, and you will see a prompt appear where you can enter the names of the variables you'd like to track.
- If you click on the dropdown button in this prompt, all the available variables in our program will be listed, as shown here:
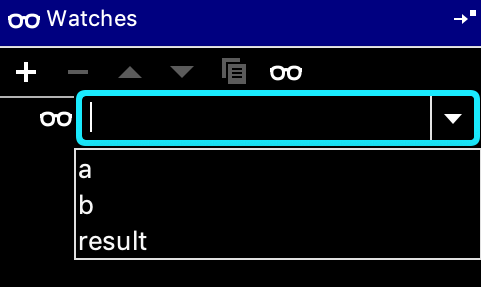
- Here, enter a and b individually to specify that you'd like to track these variables through the debugging process.
- Now, start a debugging session as normal. First, you will see messages stating that the variables associated with the watches we have specified are not (yet) defined. Simply step through these first few frames.
- Having reached the first breakpoint (at line 12), you will see that our watches will be updated accordingly. Specifically, both watches will display the correct values of the variables and the Python list, [0, 1, 2].
- Focusing on the Watches section, slowly step through the second and third breakpoints. Note that you will have to enter some input into the console between these two breakpoints. Now, when the execution of my program is at the third breakpoint (line 5), my Watches are as follows:

- This indicates that, as soon as the a variable is changed inside change_middle(), the b variable is also changed in the same way.
This is because of how referencing in Python is implemented—when a is assigned to b (line 10), these variable names, in essence, reference, or point to, the same Python object. So, when a is mutated inside change_middle(), it is the object referenced by a ([0, 1, 2]) that is changed. Since b references the same object, the value of b is also changed in the same way.
This is a common source of confusion for beginner Python programmers, so we have seen how PyCharm's debugging features help us examine this behavior more closely. Before ending your debugging session, we will consider another powerful debugging feature in PyCharm.