Code cells in PyCharm are defined by lines of code that start with the following characters: #%%. These lines are treated as standard comments in the low-level execution of Python, but PyCharm will recognize them as code cell separators in its editor. Let's see this feature in action:
- In our current program, add those lines so that your program is similar to the following:
import numpy as np
import matplotlib.pyplot as plt


#%% generate random data
N = 100
x = np.random.normal(0, 1, N)
y = np.random.normal(2, 3, N)


#%% plot data in histograms
plt.hist(x, alpha=0.5, label='x')
plt.hist(y, alpha=0.5, label='y')
plt.legend(loc='upper right')
plt.show()
As you can see, we can actually put comments in these code cell separators, which will help with readability in the future.
- More importantly, looking at the left-hand gutter of our editor, we will see several Run buttons at the beginning of each code cell that we defined via the separators:

Now, we can execute individual code cells by clicking on the Run buttons in sequence.
- On the topic of code cells, there is also a PyCharm plugin available for download that is dedicated to working with Python code cells. From the Plugins settings, you can search for and download the plugin named PyCharm cell mode in the same way as the Markdown plugin:
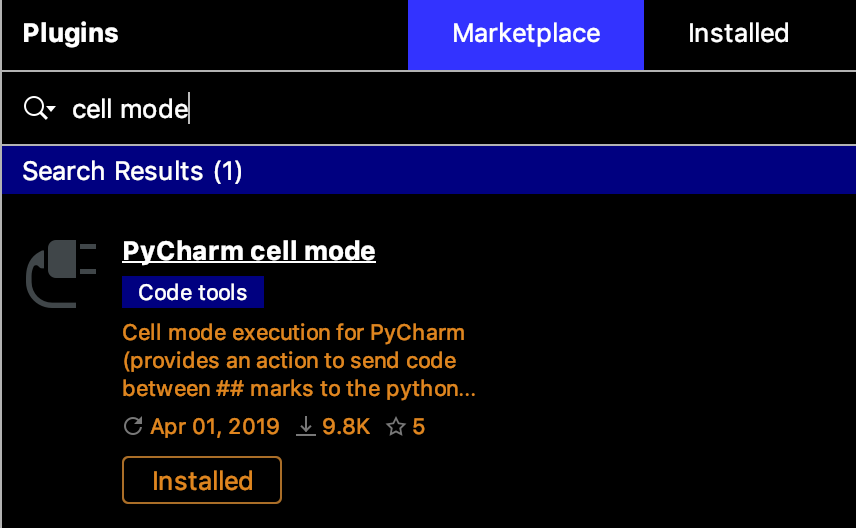
This plugin provides an easier interface and more options when it comes to executing individual code cells. For example, you can simply use a double pound sign ## (no spaces) to indicate the beginning of a code cell.
- What's more, when you click on a Run button corresponding to a specific cell, you can choose to either simply run that cell or to move to the next one afterward. The preceding screenshot was taken from the cell_mode_test.py file in our current code folder, which contains the same code that we have been looking at but with double pound signs to separate code cells:

- The Cell Mode plugin also offers even more options when it comes to executing your code cells. It's located in Code | Cell Mode from PyCharm's menu bar:

- Another great feature that is accessible when we use these code cells is that we also have the option to debug the cells in the same way that we would debug a whole program. Specifically, we can still place the breakpoints in the gutter to the left of a code cell, as follows:

When this specific code cell is run, the program's execution will still pause at those particular breakpoints, at which time we can inspect the current values of our variables. Considering that, while debugging, we might need to narrow down a specific portion of our code and inspect the changes it makes to our variables, we can see that the use of a code cell in a debugging process perfectly helps us in that regard.
Overall, we can see that this plugin offers all the advantages of using Jupyter notebooks without having to actually switch to Jupyter applications (again, if you are not familiar with Jupyter notebooks, we will be discussing them in detail in the next chapter).