Let's see how to do boosting with the following steps:
- Get your data on a canvas and partition it.
- Create a Neural Net model for the data.
- Run the Neural Net model with a Random seed set to 5000.
- Connect an Analysis node and run it with Coincidence matrices checked – you will see that the testing accuracy is 81% and the overall accuracy is 80%.
- Now, boost the Neural Net model. For this, go to the Neural Net model and edit it. Go to Objectives under Build options and click on Enhance model accuracy (boosting). Boosting can be used with any size of dataset. The idea here is that we're building successive models that are built to predict the misclassifications of earlier models. So, basically, we end up building a model. There'll be some errors, so a second model should be built where the errors of the first model are given more weight so that we're able to understand them better. Then, when we build a second model, there are going to be errors, so we end up building a third model where the errors of the second model are given more weight again so that we try to understand them better, and so forth. Whenever you're doing boosting and bagging, you always have to make sure you have a training and a testing dataset because there's a very good chance that you're going to capitalize on chance, and that you might find sample-specific information because we're focusing on the errors that we're finding within that specific sample. We'll now click on Run.
- Let's take a look at our generated model:

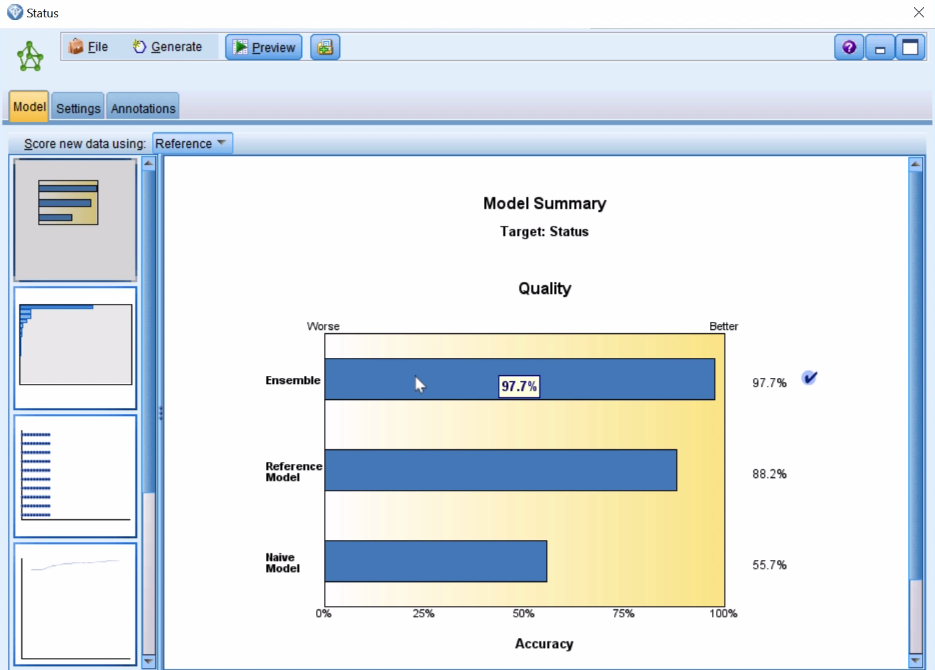
The first tab that we have here in our generated model is showing us what the Ensemble model looks like: that's combining the 10 models that we've created. You can see its overall accuracy is about 98%: that's the model that's been chosen as the best model. You can also see what the reference model is—that would be the first model that was built—and then you can see the naive model and, really, that's no model, that's just where we're predicting the mode or the most common response.
- Let's go down to the second icon:

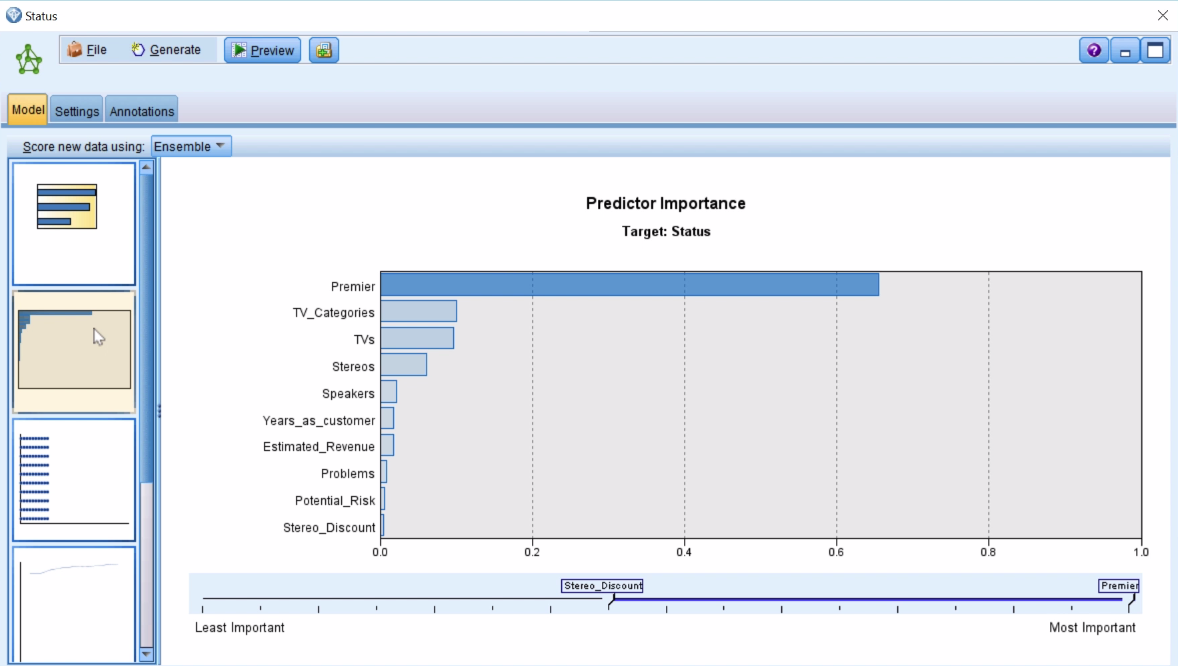
Here, you can see the Predictor Importance. Across the 10 models that we ended up building, we can see that the Premier variable was the most important predictor and then you can see what the other predictors were in terms of their order of importance. This is the same kind of information that we would see typically with a general Neural Net model, but this information comes from across all the different models that we built.
- If we go down to the next icon we can see Predictor Frequency:

This shows us how frequently each one of the different predictors was used in the model. For a Neural Net model this is not so interesting because Neural Net models generally do not drop predictors, but if we had a decision tree model, for example, this could be a little more interesting because there you do drop predictors.
- Let's go down to the next tab:

The preceding screenshot is showing us the level of accuracy of the model. You can see that it flattens out and, at some point, there's no longer much of an improvement. In this case, it's a gradual increase in terms of accuracy. Sometimes, in some models, you see perhaps five models that there's a huge jump in accuracy and then it just stabilizes. Maybe you wouldn't necessarily need to build any more models. In our case, we ended up building 10 models. Our overall accuracy was extremely high. If we had seen much lower accuracy, perhaps because we saw a gradual increase, maybe we would want to use 15 models instead of 10, for example. That's where you would see this kind of information.
- Let's scroll down a little further and let's see the final table:

Here, we can see the number of predictors and we can also see the number of cases that we had in the model as well. Finally, we see the number of synapses, which are basically the number of weights or the number of connections that we have within this model. So, you can see how well each one of these individual models is doing. Each new version of a model is giving more weight to where we had more errors in the data and that's basically the idea here.
- Run the Analysis node, finally, and you can see that for the training dataset the overall accuracy was about 98%. But in the testing dataset the overall accuracy was about 80% that's what we really care about, the testing dataset. In this case, we see that there's a big difference between training and testing and that's generally going to be the situation when talking about boosting models.
Make sure that whatever result you get is really worth it, and that it's really an improvement over just running the model on its own. In this case, when we just ran one model, remember that the overall accuracy on the testing data set was at about 80%; that's what we have here. So really, boosting didn't do much for us in this particular situation. In other situations, it certainly can, but again you want really to be able to weigh that, and in this case boost seemed to be probably not really worth it for us in this situation.