Appendix A
Debugging Angular
"A problem well-stated is half-solved." Charles Kettering, the head of research for GM in the early 20th century, said that to effectively find a solution to your problem, you must first be able to explain it well. In other terms, you must first invest the time to understand what the problem is and when you do you will be halfway to solving it.
Effective debugging is crucial in understanding why or how your software is failing. There are far better ways to debug you JavaScript code than using console.log. This appendix will cover various tools and techniques to introduce you to breakpoint debugging and browser extensions that can help you better understand the state of your application.
In this appendix, we cover:
- The most useful shortcut
- Troubleshooting errors in the browser
- Karma, Jasmine, and unit testing errors
- Debugging with dev tools
- Debugging with VS Code
- Debugging with Angular Augury
- Debugging with Redux DevTools
- Debugging RxJS
Let's start off by learning a keyboard shortcut that will make you way more productive.
The most useful shortcut
Finding your way around an unfamiliar or a large code base can be difficult, disorienting, and annoying. There is a keyboard shortcut that solves this problem, which is shared across multiple tools like VS Code and Chrome/Edge Developer Tools (dev tools).
To search for and open a file in VS Code or the Sources panel in dev tools, use the following shortcut:
On macOS:  + P
+ P
On Windows: Ctrl + P.
You'll quickly discover that this is the shortcut that you will be using the most.
Troubleshooting errors in the browser
In this section, you will intentionally introduce an easy-to-make mistake so that you can become familiar with real-life errors that can happen while developing your applications and gain a solid understanding of the tooling that makes you an effective developer.
Please refer to Chapter 4, Automated Testing, CI, and Releasing to Production, and the LocalCast Weather app to get a better context of the following code sample.
The latest version of the LocalCast Weather app can be found on GitHub at https://github.com/duluca/local-weather-app.
Let's pretend that we made an innocent mistake when copying and pasting the URL from the API documentation page on OpenWeatherMap.org and forgot to add http:// in front of it. This is an easy mistake to make:
src/app/weather/weather.service.ts
...
return this.httpClient
  .get<ICurrentWeatherData>(
`api.openweathermap.org/data/2.5/weather?q=${city},${country}&appid=${environment.appId}`
  ).pipe(map(data => this.transformToICurrentWeather(data)))
...
Your app will compile successfully, but when you inspect the results in the browser, you won't see any weather data. In fact, it seems like the CurrentWeather component is not rendering at all, as you can see in the following image:

Figure 1: CurrentWeather does not render
To find out why, you will need to debug your Angular app.
Leveraging Browser DevTools
As a developer, I use the Edge or Google Chrome browsers because of their cross-platform and consistent developer tools with helpful extensions.
As a best practice, I code with VS Code and the browser open side by side, while the dev tools are also open in the browser. There are several good reasons for practicing side-by-side development:
- Fast feedback loops: With live-reloading, you see the end result of your changes very quickly
- Laptops: A lot of developers now do most of their development on a laptop and a second monitor is a luxury
- Attention to responsive design: As I have limited space to work with, I constantly pay attention to mobile-first development, fixing desktop layout issues after the fact
- Awareness of network activity: To enable me to quickly see any API call errors and ensure that the amount of data that is being requested remains in line within my expectations
- Awareness of console errors: To enable me to quickly react and troubleshoot when new errors are introduced
- Disabled cache: So you know you are always getting all of your changes and not fighting with the browser's cache
Observe what side-by-side development looks like:

Figure 2: Side-by-side development with live-reloading running
Ultimately, you should do what works best for you. With the side-by-side setup, I frequently find myself toggling VS Code's Explorer on and off and resizing the dev tools pane to a larger or smaller size depending on the specific task at hand. To toggle VS Code's Explorer, click on the Explorer icon circled in the preceding screenshot.
Just as you can do side-by-side development with live-reloading using npm start, you can get the same kind of fast feedback loops for unit testing using npm test:
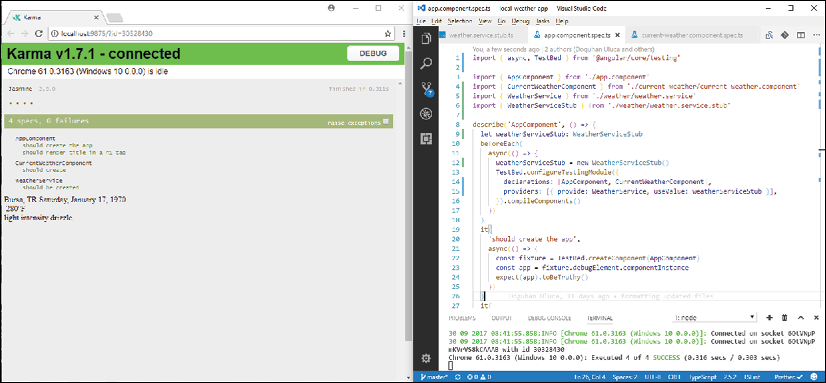
Figure 3: Side-by-side development with unit testing
With the side-by-side unit testing setup, you can become highly effective in developing unit tests.
Optimizing dev tools
For side-by-side development with live-reloading to work well, you need to optimize the default dev tools experience:

Figure 4: Optimized Chrome Developer Tools
Looking at the preceding screenshot, you will note that numerous settings and information radiators are highlighted:
- Have the Network tab open by default so that you can see network traffic flowing.
- Open the dev tools settings by clicking on the
 button.
 - Click on the right-hand side icon so that dev tools dock on the right-hand side of Chrome. This layout gives more vertical space, so you can see more network traffic and console events at once. As a side benefit, the left-hand side takes the rough size and shape of a mobile device.
- Toggle on large request rows and toggle off overview to see more of the URL and parameters for each request and gain more vertical space.
- Check the option to Disable cache, which will force reload every resource when you refresh a page while the dev tools are open. This prevents bizarre caching errors from ruining your day.
- You will mostly be interested in seeing XHR calls to various APIs, so click on XHR to filter results.
- Note that you can glance the number of console errors in the upper-right corner as 12. The ideal number of console errors should be 0 at all times.
- Note that the top item in the request row is indicating that there's an error with status code 404 Not Found.
- Since we are debugging an Angular application, the Augury extension has been loaded. This tool is covered in more detail later in this chapter, using the more complicated LemonMart app.
With your optimized dev tools environment, you can now effectively troubleshoot and resolve the application error from earlier.
Troubleshooting network issues
There are three visible issues with the app at this stage:
- The component details aren't displaying
- There are numerous console errors
- The API call is returning a 404 Not Found error
Begin by inspecting any network errors, since network errors usually cause knock-on effects:
- Click on the failing URL in the Network tab
- In the Details pane that opens to the right of the URL, click on the Preview tab
- You should see this:
Cannot GET /api.openweathermap.org/data/2.5/weatherBy just observing this error message, you will likely miss the fact that you forgot to add the
http://prefix to the URL. The bug is subtle and certainly not glaringly obvious. - Hover over the URL and observe the full URL, as shown:

Figure 5: Inspecting network errors
As you can see, now the bug is glaringly obvious. In this view, we get to see the full URL, and it becomes clear that the URL defined in weather.service.ts is not fully qualified, so Angular is attempting to load the resource from its parent server, hosted on localhost:5000, instead of going over the web to the right server.
Investigating console errors
Before you fix this issue, it is worthwhile understanding the knock-on effects of the failing API call:
- Observe the console errors:
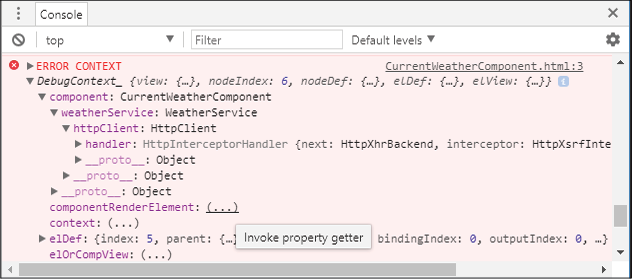
Figure 6: Dev tools Console Error Context
The first element of note here is the
ERROR CONTEXTobject, which has a property namedDebugContext_.DebugContext_contains a detailed snapshot of the current state of your Angular application when the error happened. The information contained withinDebugContext_is light years ahead of the amount of mostly unhelpful error messages AngularJS generates.Properties that have the value
(...)are property getters, and you must click on them to load their details. For example, if you click on the ellipsis forcomponentRenderElement, it will be populated with theapp-current-weatherelement. You can expand the element to inspect the runtime condition of the component. - Now scroll to the top of the console
- Observe the first error:
ERROR TypeError: Cannot read property 'city' of undefined
You have probably encountered the TypeError before. This error is caused by trying to access the property of an object that is not defined. In this case, CurrentWeatherComponent.current is not assigned to an object because the HTTP call is failing. Since current is not initialized and the template blindly tries to bind to its properties like {{current.city}}, we get a message saying property 'city' of undefined cannot be read. This is the kind of knock-on effect that can create many unpredictable side-effects in your application. You must proactively code to prevent this condition.
Karma, Jasmine, and unit testing errors
When running tests with the ng test command, you will encounter some high-level errors that can mask the root cause of the actual underlying errors.
The general approach to resolving errors should be inside out, resolving child component issues first and leaving parent and root components for last.
NetworkError
Network errors can be caused by a multitude of underlying issues:
NetworkError: Failed to execute 'send' on 'XMLHttpRequest': Failed to load 'ng:///DynamicTestModule/AppComponent.ngfactory.js'.
Working inside out, you should implement test doubles of services and provide the fakes to the appropriate components, as covered in the previous section. However, in parent components, you may still encounter errors even if you correctly provided fakes. Refer to the section on dealing with generic error events to uncover the underlying issues.
Generic ErrorEvents
Error events are generic errors that hide the underlying cause:
[object ErrorEvent] thrown
To expose the root cause of a generic error, implement a new test:debug script:
- Implement
test:debug, as shown, inpackage.json:package.json ... "scripts": { ... "test:debug": "ng test --source-map", ... } - Execute
npm runtest:debug - Now the Karma runner will likely reveal the underlying issue
- If necessary, follow the stack trace to find the child component that may be causing the issue
If this strategy is not helpful, you may be able to glean more information on what's going wrong by breakpoint debugging your unit tests.
Debugging with Dev Tools
To console.log or not to console.log; that is the question. For the record, let me state that console.log statements will never be checked in to your repository. In general, they are a waste of your time, because it requires editing, building, and running code to bring value, not to mention the cost of cleaning up your code later.
The preferred method of debugging is breakpoint debugging, which is a way to pause the execution of your code, and inspect and manipulate the state of it while your code is running. You can conditionally set breakpoints, walk through your code line by line, and even execute statements in the console to try out new ideas.
Angular 9 and Ivy bring in many debugging improvements that makes it possible to debug asynchronous code and templates. In addition, the stack trace generated by Angular 9 is far more useful in pinpointing the root cause of an error.
There are some niche use cases where console.log statements can be useful. These are mostly asynchronous workflows that operate in parallel and are dependent on timely user interaction. In these cases, console logs can help you better understand the flow of events and interaction between various components. You can see this in action in the Debugging RxJS section later in this chapter.
For common cases, we should stick with breakpoint debugging. Using dev tools, we can observe the state of properties as they are being set, and be able to change their values on the fly to force the code to execute branching logic in if-else or switch statements.
Let's presume that some basic logic exists on HomeComponent, which sets a displayLogin boolean, based on an isAuthenticated value retrieved from an AuthService, as demonstrated:
src/app/home/home.component.ts
...
import { AuthService } from '../auth.service'
...
export class HomeComponent implements OnInit {
  displayLogin = true
  constructor(private authService: AuthService) {}
  ngOnInit() {
    this.displayLogin = !this.authService.isAuthenticated()
  }
}
Now observe the state of the value of displayLogin and the isAuthenticated function as they are being set, and then observe the change in the value of displayLogin:
- Switch to the Sources tab in dev tools
- Using the most useful shortcut, Ctrl + P or
 + P, search for
 HomeComponent - Drop a breakpoint on the first line inside the
ngOnInitfunction - Refresh the page
- You'll see your breakpoint hit, as highlighted in blue here:

Figure 7: Chrome DevTools breakpoint debugging
- Hover over
this.displayLoginand observe that its value is set totrue - If hovering over
this.authService.isAuthenticated(), you will not be able to observe its valueWhile your breakpoint is hit, you can access the current scope of the state in the console, which means you can execute the function and observe its value.
- Execute
isAuthenticated()in the console:> this.authService.isAuthenticated() trueYou'll observe that it returns
true, which is whatthis.displayLoginis set to. You can still coerce the value ofdisplayLoginin the console. - Set
displayLogintofalse:> this.displayLogin = false false
If you observe the value of displayLogin, either by hovering over it or retrieving it from the control, you'll see that the value is set to false.
Leveraging breakpoint debugging basics, you can debug complicated scenarios without changing your source code at all. You can debug templates as well as complicated callbacks with RxJS statements.
Debugging with Visual Studio Code
You can also debug your Angular application, Karma, and Protractor tests from directly within Visual Studio Code. First, you need to configure the debugger to work with a Chrome debugging environment, as illustrated:

Figure 8: VS Code debugging setup
- Click on the Debug pane
- Expand the No Configurations dropdown and click on Add Configuration...
- In the Select Environment checkbox, select Chrome
This will create a default configuration in the
.vscode/launch.jsonfile. We will modify this file to add three separate configurations. - Replace the contents of
launch.jsonwith the following configuration:.vscode/launch.json { "version": "0.2.0", "configurations": [ { "name": "Debug npm start with Chrome", "type": "chrome", "request": "launch", "url": "http://localhost:5000/#", "webRoot": "${workspaceRoot}", "runtimeArgs": [ "--remote-debugging-port=9222" ], "sourceMaps": true, "preLaunchTask": "npm: start" }, { "name": "Debug npm start with Edge", "type": "edge", "request": "launch", "version": "dev", "url": "http://localhost:5000/#", "webRoot": "${workspaceRoot}", "sourceMaps": true, "preLaunchTask": "npm: start" }, { "name": "Debug npm test with Chrome", "type": "chrome", "request": "launch", "url": "http://localhost:9876/debug.html", "webRoot": "${workspaceRoot}", "runtimeArgs": [ "--remote-debugging-port=9222" ], "sourceMaps": true, "preLaunchTask": "npm: test" }, { "name": "Debug npm test with Edge", "type": "edge", "request": "launch", "version": "dev", "url": "http://localhost:9876/debug.html", "webRoot": "${workspaceRoot}", "sourceMaps": true, "preLaunchTask": "npm: test" }, { "name": "npm run e2e", "type": "node", "request": "launch", "program": "${workspaceRoot}/node_modules/protractor/bin/protractor", "protocol": "inspector", "args": [ "${workspaceRoot}/protractor.conf.js" ] } ] }Note that we also added debuggers for Microsoft's new Chromium-based Edge browser.
- Execute the relevant CLI command, like
npm start,npm test, ornpm run e2e, before you start the debugger - On the Debug page, in the Debug dropdown, select
npm startand click on the green play icon - Observe that a Chrome instance has launched
- Set a breakpoint on a
.tsfile - Perform the action in the app to trigger the breakpoint
- If all goes well, Chrome will report that the code has been Paused in Visual Studio Code
For more information, refer to the Angular CLI section on VS Code Recipes on GitHub at https://github.com/Microsoft/vscode-recipes.
Debugging with Angular Augury
Augury is a Chrome DevTools extension for debugging and profiling Angular applications. It is a purpose-built tool designed to help developers visually navigate the component tree, inspect the state of the router, and enable breakpoint debugging by source mapping between the generated JavaScript code and the TypeScript code that the developer coded in.
Note that Augury is not fully compatible with Angular 9's Ivy rendering engine. For certain features like Router Tree and NgModules to work, you need to temporarily disable Ivy in your project.
You can turn off Ivy by updating tsconfig.app.json in the root of your project to add the following property to it:
"angularCompileOptions": {
  "enableIvy": false
}
You can download Augury from https://augury.angular.io. Once installed, when you open Chrome DevTools for your Angular app, you'll note a new tab for Augury, as illustrated:
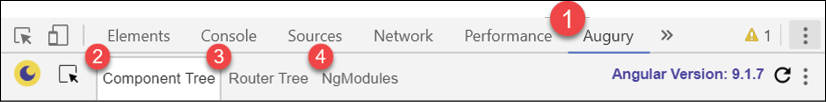
Figure 9: Chrome DevTools Augury
Augury provides useful and critical information in understanding how your Angular app is behaving at runtime:
- The current Angular version is listed, in this case, as version 9.1.7
- Component Tree show all Angular components that rendered in the app
- Router Tree shows all the routes that have been configured in the app
NgModulesshows theAppModuleand feature modules of the app
Component Tree
The Component Tree tab shows how all app components are related and how they interact with each other:
- Select a particular component, such as
HomeComponent, as follows:
Figure 10: Augury Component Tree
The Properties tab on the right-hand side will display a link called View Source, which you can use to debug your component. Further below, you will be able to observe the state of properties of the component, such as the
displayLogin boolean, including services that you have injected into the component and their state.You can change the value of any property by double-clicking on the value.
For example, if you would like to change the value of
displayLogintofalse, simply double-click on the blue box that contains thetruevalue and type infalse. You will be able to observe the effects of your changes in your Angular app.In order to observe the runtime component hierarchy of
HomeComponent, you can observe the Injector Graph. - Click on the Injector Graph tab, as shown:
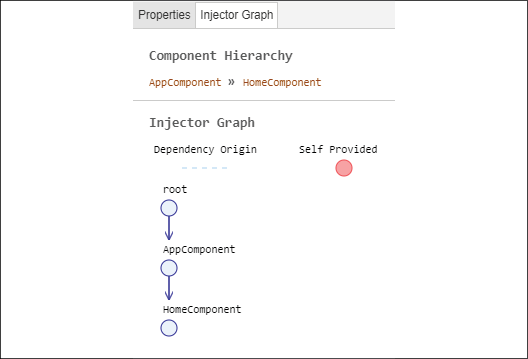
Figure 11: Augury Injector Graph
This view shows how your selected component came to be rendered. In this case, we can observe that HomeComponent was rendered within AppComponent. This visualization can be very helpful in tracking down the implementation of a particular component in an unfamiliar code base or where a deep component tree exists.
Router Tree
The Router Tree tab will display the current state of the router. This can be a very helpful tool in visualizing the relationship between routes and components, as shown:
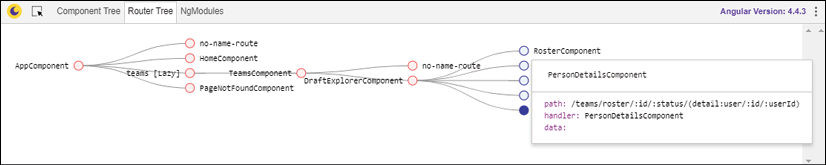
Figure 12: Augury Router Tree
The preceding router tree demonstrates a deeply nested routing structure with master-detail views. You can see the absolute path and parameters required to render a given component by clicking on the circular node.
As you can see, for PersonDetailsComponent, it can get complicated to determine, exactly, the set of parameters needed to render this detail portion of a master-detail view.
NgModules
The NgModules tab displays the AppModule and any other feature module that is currently loaded into memory:
- Launch the
/homeroute of the app and hit enter on the address bar, so Augury registers the navigation event - Observe the NgModules tab, as follows:
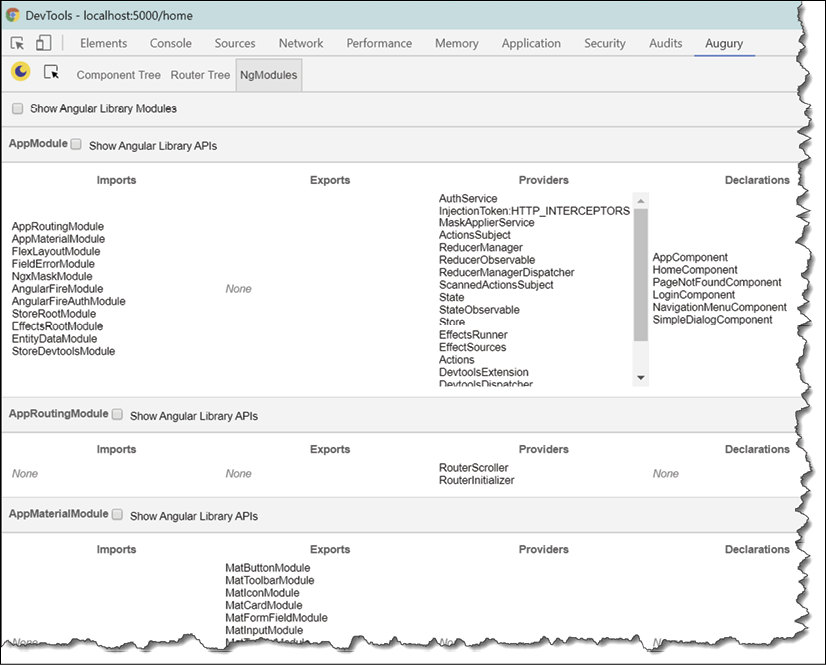
Figure 13: Augury NgModules
You'll note that all root-level modules, including the
AppModule, are loaded. However, since our application has a lazy-loaded architecture, none of our feature modules are loaded yet. - Navigate to a page in
ManagerModuleand hit enter on the address bar - Then, navigate to a page in
UserModuleand hit enter on the address bar - Finally, navigate back to the
/homeroute and hit enter on the address bar - Observe the NgModules tab, as shown:
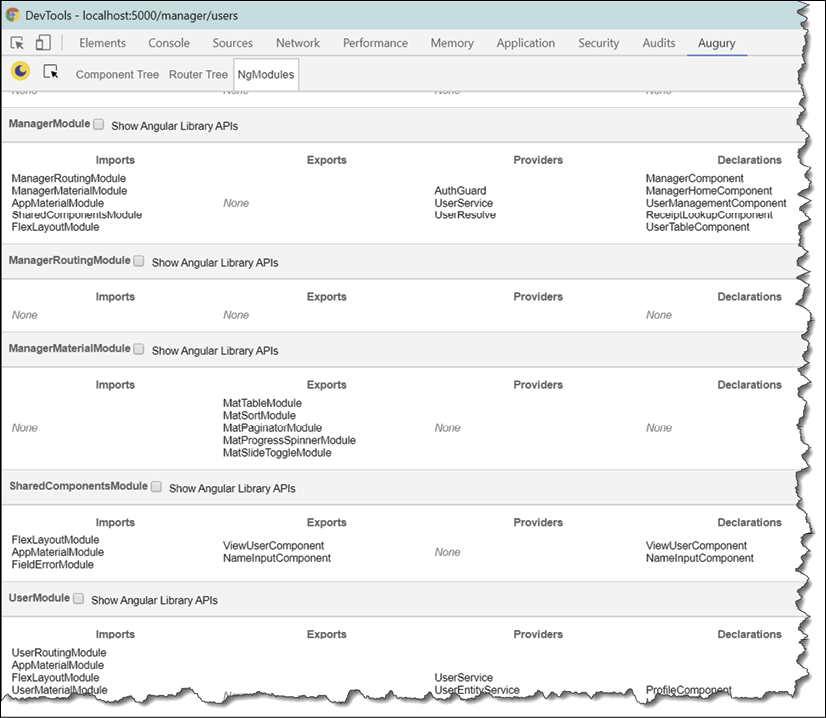
Figure 14: Augury NgModules with three modules
- Now, you'll observe that
ManagerModuleandUserModule, along with all of their related modules, have been loaded into memory.
NgModules is an important tool to visualize the impact of your design and architecture.
Debugging with Redux DevTools
There are two major strategies to debug and get instrumentation from NgRx.
- Implement a console logger for debugging
- Configure Store DevTools for rich instrumentation
Let's start with the simple debugging solution.
Implement NgRx Console Logger
In app.module, StoreModule is configured to inject a MetaReducer into your configuration. Meta-reducers are able to listen to all events happening in the action-reducer pipeline, thereby giving you the ability to preprocess actions. We can use this hook to implement a simple logger.
- Implement a function called
loggerinreducers/index.ts:src/app/reducers/index.ts export function logger(reducer: ActionReducer<AppState>): ActionReducer<AppState> { return (state, action) => { const result = reducer(state, action) console.groupCollapsed(action.type) console.log('prev state', state) console.log('action', action) console.log('next state', result) console.groupEnd() return result } } - Configure the
loggerwithmetaReducersand only in non-production mode:src/app/reducers/index.ts export const metaReducers: MetaReducer<AppState>[] = !environment.production ? [logger] : []
Now give it a whirl and you should be able to observe NgRx right in your console, shown as follows:

Figure 15: Console view with NgRx logs
Configuring NgRx Store DevTools
The NgRx Store Devtools package can also assist with our debugging efforts during development or provide instrumentation of our production builds. Add the package by running the following command:
$ npx ng add @ngrx/store-devtools
You will notice that the package will automatically add production instrumentation rules in app.module, so that only the last 25 events are captured. This is necessary to avoid performance issues.
Once installed, in order to leverage the instrumentation generated and to be able to debug NgRx, you will want to install the Redux DevTools extension for Chrome or Firefox, found at https://github.com/zalmoxisus/redux-devtools-extension or http://extension.remotedev.io.
Once you launch your application, activate the extension and observe that detailed instrumentation over time is being captured by Redux DevTools, shown as follows:

Figure 16: Redux DevTools
Redux DevTools gives you the capability to play back events and view state changes. This is demonstrated in the bottom-right quadrant of the preceding screenshot. You can observe the current city as Bursa and its previous value, Bethesda.
Debugging RxJS
There are two major strategies to debug and get information about what's happening inside an RxJS pipe:
- Tap into the event stream and console log the event data at a particular point in the stream
- Execute breakpoint debugging in dev tools
Let's start with using the tap operator.
Tapping an RxJS Event Stream
In Chapter 6, Forms, Observables, and Subjects, we introduced the RxJS tap operator as a way to direct the flow of user input from our search input's stream of change events, and eventually call our doSearch function. When an RxJS stream doesn't seem to be behaving as you'd expect, you can combine the tap operator and console.log to log each event's data, so you can see it over time. Since tap captures the data in the stream based on where it falls in the order of operations, once added to the stream, you can simply use VS Code's line movement keyboard shortcuts to move it around and test the flow.
To move a line of code up or down, use Alt + ↑ and Alt + ↓ on Windows or  + ↑ and + ↓ on macOS.
The following tap in CitySearchComponent will log to the console every change event coming from the input:
this.search.valueChanges
  .pipe(
 tap(console.log),
    debounceTime(1000),
    filter(() => !this.search.invalid),
    tap((searchValue: string) => this.doSearch(searchValue))
  ).subscribe()
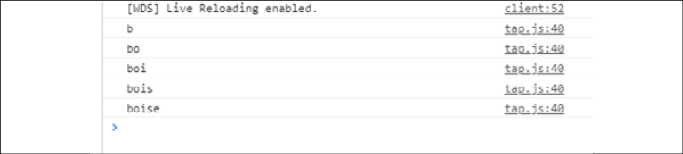
Figure 17: RxJS logging every event
If we move the tap down one line, instead of getting every user input, we will get only the debounced events:
this.search.valueChanges
  .pipe(
    debounceTime(1000),
    tap(console.log),
    filter(() => !this.search.invalid),
    tap((searchValue: string) => this.doSearch(searchValue))
  ).subscribe()

Figure 18: RxJS logging only debounced events
One more line down, and we see the events after being debounced and filtered:
this.search.valueChanges
  .pipe(
    debounceTime(1000),
    filter(() => !this.search.invalid),
    tap(console.log),
    tap((searchValue: string) => this.doSearch(searchValue))
  ).subscribe()
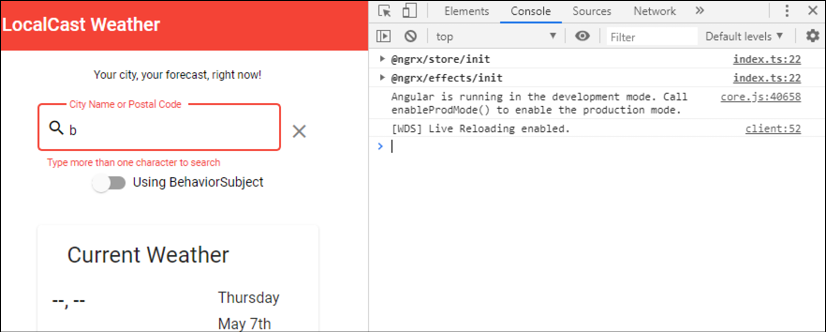
Figure 19: RxJS ignoring invalid inputs
Note that since one character is invalid, the filter has caught this event and not allowed it through, thus we see no data in the console.
While it can be very confusing in the console, you can also log many things at once, utilizing a callback instead of just passing the console.log callable:
this.search.valueChanges
  .pipe(
    debounceTime(1000),
    tap(debouncedData =>
      console.log('debounced: ', debouncedData)
    ),
    filter(() => !this.search.invalid),
    tap(debouncedAndFilteredData =>
      console.log(
        'debounced + filtered: ',
        debouncedAndFilteredData
      )
    ),
    tap((searchValue: string) => this.doSearch(searchValue))
  ).subscribe()
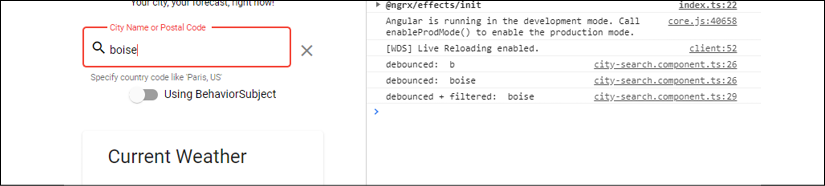
Figure 20: RxJS logging multiple events
Next, let's see how we can leverage breaking debugging.
Breakpoint debugging an RxJS Event Stream
Refer to the Debugging with DevTools section earlier in the chapter to learn more about breakpoint debugging. The important bit in debugging RxJS is to understand what the blue carets are for in the debugger.
When a line of code has multiple points that can be used to pause execution, these are indicated with the square-sided carets. These can be toggled on (dark, solid) or off (light, transparent) to indicate where in the line of code you want the browser to stop, as shown in the following screenshot:

Figure 21: RxJS breakpoint debugging
The carets can be used to stop the browser mid-stream, inside a callback where work is done, to examine the data or even manipulate it. In the preceding example, I've set the breakpoint debugger to break inside the filter function, so I can examine the state of the search input field.
Experiment with debugging to learn more about it.
Further advice
If you're still stuck, don't get frustrated. Even the best of us spend countless hours on minor issues at times. However, if you need it, you can ask for help. Angular has a rich and supportive community online.
It does matter a lot how you go about asking for help. First replicate your issue using https://stackblitz.com/. Half the time, you will figure out your issue in the process of replicating it. Next, ask a question on https://stackoverflow.com. If you can provide the StackBlitz link to your issue, your problem will likely get answered quickly. If it turns out there might be an issue with the framework itself, then create a GitHub issue on the correct repository (in other words, Angular, CLI, Material, NgRx, RxJS, and so on) detailing your problem. If you found a bug in the framework, then you've officially contributed to the development of the open source project: 
Otherwise, you can also use Twitter and search for help on the @angular or #angular handles. Personally, I'm a big fan of Googling. My philosophy is that someone else probably ran into the same issue as I did, and believe me when I say this -- a well-formed Google query is a problem half-solved.