6
Sizing Criteria of an Aeronautical Structure
6.1. Introduction
Now that we have seen how to determine stress and strain in a structure (at least in the simplest cases – for real cases, an approximate solution method, such as that of finite element, should be used), we shall now look at sizing criteria. As a reminder (see Introduction), the aim of the mechanics of deformable solids is to study the internal state of the material (notion of stress) and the way in which it becomes strained (notion of strain) in order to determine if the piece or the mechanical system studied attains rupture, or if it does not become too strained. In short, once the stress and strain in a piece are known, then the criteria (typically, these are the norms of the stress and/or the strain tensor) need to be applied in order to determine whether or not the piece breaks! It is these criteria (or to be more exact, some criteria, as there are hundreds of them) which shall be the subject of this chapter.
However, we must bear in mind that these criteria are not absolute truths, but are simply models which attempt to translate reality. This reality is always much more complex when looked at closer up. In short, a model is considered to be correct as long as you have not been able to show that it is false, or more specifically, as long as all of the experimental tests have not proven it to be defective!
We must also bear in mind that throughout the life of a structure, it shall be subjected to different loads (and not just to one, such as in academic exercises), called “load case”. The engineer’s job is therefore to guarantee that the structure will withstand all of the load cases without breaking, and/or without becoming too strained.
The aeronautics case is even more complex, as we distinguish limit loads (LL) from ultimate loads (UL). The sizing of aeronautical structures is indeed very complex (far too complex to cover in this book), but at first estimate, we can succinctly summarize it by saying that the structure must statically withstand the LL without incurring any damage (and/or plasticity for metallic materials) and withstand the UL without breaking in a catastrophic manner [BOU 16]. To put it more precisely, the limit loads (LL) are defined as loads that the structure will, on average, see once in their lifetime, or for aeronautics, with a probability of occurrence of about 10−5 per flight hour (a plane flies at about 105 h). As for ultimate loads (UL), they are defined as very improbable loads, or for aeronautics, with a probability of occurrence of about 10−9 per flight hour (ACJ 25-1309). In practice, there is a ratio k, which is generally comprised between 1.1 and 1.5 among both:
The philosophy of sizing an aeronautical structure could therefore be summarized as:
- – no damage or permanent deformation is permitted in service, namely for realistic loads or even those less than or equal to the LL;
- – the structure must remain whole for a test load, namely for very improbable loads or even those less than or equal to the UL.
All of the damage problems should also be added to this. As well as withstanding the LL and UL, you must in fact guarantee that the structure can undergo damage (object drop, impact of runway debris, of birds, lightning, etc.) without causing a catastrophic rupture; this is the notion of damage tolerance (which, once again, exceeds the framework of this book).
Nevertheless, regardless of how complex the sizing of a structure may be, this always goes to show that the structure (possibly with damage, cracks or missing parts) undergoes such a load without breaking or straining in an exaggerated manner. The sizing criteria should therefore be applied to the stresses and/or the strains (or on the energy restitution rates) to demonstrate that the structure can withstand the load. These criteria must obviously be verified everywhere in the structure and for all the load cases. The engineer’s job then consists of modifying the design of the structure if this is not the case, or if the criteria are too far from the allowable limits (in short if the structure is too oversized and therefore too heavy).
We will now move on to review the different sizing criteria by specifying which type of material is applied each time. However, before doing that, we are going to see that determining a criterion that is adapted to each material is a long and complex process.
6.2. Experimental determination of a sizing criterion
The problem is as follows: does the state of a given stress lead to a material becoming ruptured and/or becoming irreversibly damaged and/or to plasticity appearing? It is therefore a problem with six dimensions, just like the stress tensor:
It can be translated by an equation of the following type:
where σ0 is a stress limit and  is a norm of the stress tensor which may possibly involve parameters, depending on the material.
In the instance that the material is isotropic, we can therefore reduce it to a 3D problem by placing it within the principal stress coordinate system. This also means that if the material is orthotropic, this will not be the case!
First, we will study an isotropic material and put the problem in 2D to simplify it. The stress tensor can therefore be written thus in the principal coordinate system:
To apply this stress state to our material, we obviously need to load it progressively, using a testing machine, for example. We will therefore start by choosing a load type, then progressively load the material with the same type of load. This is proportional loading:
The problem can then be reduced to determining the value of σ(t) leading to the rupture (or at the start of the damage/plasticity), and for all the values of  . Graphically, this goes back to finding the admissible stress on the affine straight lines:
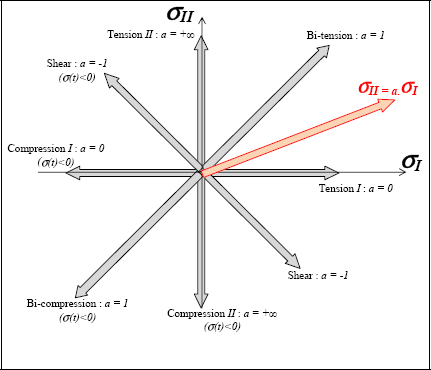
Figure 6.1. Proportional loading. For a color version of this figure, see www.iste.co.uk/bouvet/aeronautical.zip
In order to perform these loads, we can use a bi-tension test, for example:
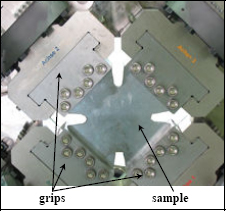
Figure 6.2. Bi-axial testing machine (source: http://www.directindustry.fr/prod/zwick). For a color version of this figure, see www.iste.co.uk/bouvet/aeronautical.zip
Of course, these tests are not simple to perform. In particular, we need to ensure that the test enables us to obtain a homogeneous stress area and to measure the stress in this area (either based on the external forces, as is the tension case, or based on extensometric gages, but the behavior law of the material must be known).
We must also verify the repeatability of the tests by performing the same test several times. In fact, two experimental tests never give exactly the same result! For example, for composite material, each test is performed at least five times in order to determine the rupture criteria with the associated rupture probability.
Once the tests have been performed with a sufficient amount of different values, we can then trace the criterion and compare it with the theoretical criteria in order to determine which criterion is best suited to the material studied.
Finally, the problem is even more complex in 3D (the tests can be very complex) as well as for orthotropic materials, as we need to imagine tests with a shear applied force on the material.
6.3. Normal stress or principal stress criterion: brittle material
The simplest criterion is that of the maximum normal stress. It maintains that the rupture of the material has been reached if the maximum normal stress (for all facets or all possible normal vectors n) reaches a limit stress, determined using a tension test.
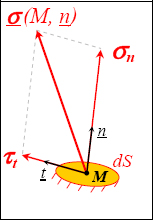
Figure 6.3. Normal and shear stress. For a color version of this figure, see www.iste.co.uk/bouvet/aeronautical.zip
We can also show (I will leave you to do the demonstration yourselves) that this maximum normal stress is the maximum of the three principal stresses. The rupture will therefore be developed in a plane that is perpendicular to the maximum normal stress, meaning perpendicular to the maximum principal stress.
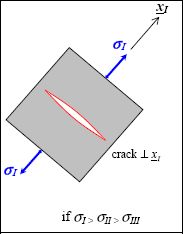
Figure 6.4. Rupture of a brittle material. For a color version of this figure, see www.iste.co.uk/bouvet/aeronautical.zip
Thus, we consider that we do not have a rupture if:
with σ0 being the rupture limit stress or the start of the damage (we can show that this criterion makes no sense for materials with plasticity, meaning for all ductile materials).
This criterion is relevant for the tension loading, meaning for the positive principal stresses; but it is often less relevant for compression loading. We do, however, use it for compression loads, but we then distinguish the tension rupture from the compression rupture. We then consider that we do not have a rupture if:
with σtrac and σcomp expressing the limit tension stress and limit compression stress (considered to be negative) respectively. For example, for an epoxy resin (which may be considered a brittle material at first approximation), we have 50 MPa of tension limit and –200 MPa of compression limit. The criterion obtained in the plane (σI, σII) is therefore a rectangle:
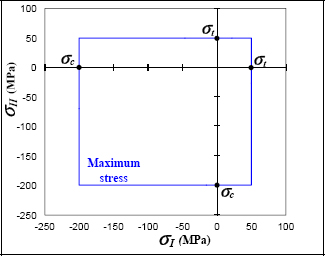
Figure 6.5. Rupture criterion of a brittle material. For a color version of this figure, see www.iste.co.uk/bouvet/aeronautical.zip
At first approximation, this criterion is adapted to the brittle materials, but it presents various limitations.
The main limitation is its lack of coupling between directions. In short, the limit on rupture in one direction does not depend on stresses in other directions. In order to make this type of criteria a default, we can, for example, perform a shear test by applying a force to the material with two equal stresses that have opposite signs:
Obviously, this load is equivalent to a pure shear in a coordinate system turned at 45° around the z-axis.
In general, we also show that the rupture stress is lower than the rupture tension stress. This comes from the fact that, in order to provoke the rupture, the compression stress in the y-direction “adds itself” to the tension stress in the x-direction. This instance will be detailed throughout the part on criteria of shear stress with friction.
Note that this criterion makes no sense for materials with plasticity, meaning for ductile materials.
As a matter of fact, we can show that plasticity is a phenomenon driven by shear stresses and therefore corresponds to Tresca or Von Mises criteria.
At first approximation, we can explain this behavior difference between the brittle materials and the ductile materials by the atomic bond type which makes them up:
- – a brittle material is generally made up of covalent bonds, meaning strong bonds which are very stable and directional, coming from bringing together the electrons from amongst neighbor atoms. In order to attain the rupture, these bonds therefore need to be broken. It is therefore necessary to provide a significant normal stress. This reasoning applies well in the instance of pure crystals, but not so well in that of poly-crystals (meaning when the material is made up of different crystals with different orientation which are separated by boundary grains);
- – a ductile material is generally comprised of metallic bonds, meaning delocalized strong bonds coming from the bringing together of electrons from amongst a large number of atoms (which then become ions). These electrons make up a rather mobile mist in the material (hence their particularly strong electrical conductivity). The material may therefore be strained by displacing its atoms step by step (the atoms settle for changing neighbors which is not possible, or is at least very difficult, for a covalent bond). This is the dislocation phenomenon. It is therefore necessary to provide a significant shear to enable the displacements of atoms and therefore, the plastic (and irreversible) strain of the material.
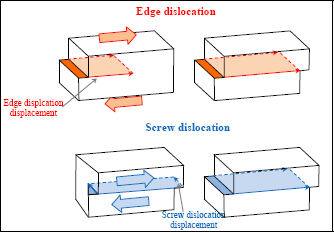
Figure 6.6. Edge dislocation displacement and screw dislocation under the action of a shear stress. For a color version of this figure, see www.iste.co.uk/bouvet/aeronautical.zip
6.4. Stress or maximum shear energy criterion: ductile material
6.4.1. Tresca criterion
In order to account for the significance of the shear stress on the plasticity of ductile materials, the simplest criterion is the maximum shear criterion or the Tresca criterion. It states that the plasticity of the material can be attained if the maximum shear stress (for all facets or all possible normal vector n) attains a limit stress.
As it is simpler to perform a tension test, in practice, we prefer to define an equivalent stress, called the Tresca stress, which is equal to the tension stress under a tension applied force. In tension, we have:
And we therefore obtain a maximum shear stress (either using Mohr’s circle or by finding the maximum of τ for all the possible normal vector n):
We therefore define the Tresca equivalent stress by:
Thus, in pure tension, the Tresca equivalent stress will be directly equal to the tension stress. The Tresca criterion is therefore written as:
where σe is the elastic limit of the material. The Tresca criterion is in fact an end of the elasticity criterion (or the beginning of plasticity) and is not a rupture criterion. This criterion therefore makes sense for determining a material’s end of elasticity, but makes no sense for a brittle material. Note that the elastic behavior is just the beginning of a ductile material’s behavior:
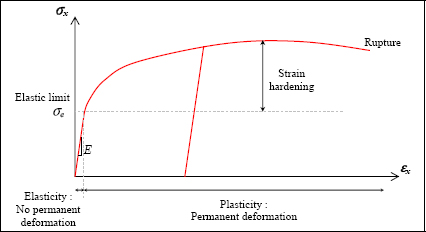
Figure 6.7. Tension test of a ductile material. For a color version of this figure, see www.iste.co.uk/bouvet/aeronautical.zip
In 3D, it can also be shown (I will leave you to do the demonstration using Mohr’s tri-circle, for example) that the Tresca stress is equal to the maximum difference of principal stresses (in absolute value):
In practice, this criterion is not used very often and the Von Mises criterion is preferred, as it is rather similar and it is derivable (see the next paragraph). In fact, if we trace these two criteria in 2D in the principal stress plane (σI, σII), by assuming that they are equal in tension (which is just a hypothesis!), we then obtain:
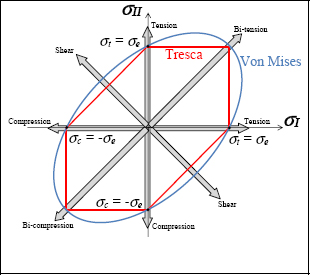
Figure 6.8. End of elasticity criteria of a ductile material. For a color version of this figure, see www.iste.co.uk/bouvet/aeronautical.zip
In the Tresca criterion, we observe some angular points which later pose numerical problems for modeling the plasticity.
6.4.2. Von Mises criterion
The Von Mises criterion is based on the shear energy. In the same way as the Tresca criterion, this is based on the fact that the plasticity is sensitive to shearing.
The energy corresponds to the energy that the material may store in an elastic form when it is subjected to a given stress and strain. This phenomenon is the same as for a spring which stores energy:
where F is the force in the spring, k is its rigidity and x is the displacement (with F = –k.x).
By analogy, the energy (called the strain energy Ed) of a volume V of matter subjected to a stress  and to a strain
  is half of the stress product by the strain (which is a contracted product here):
Or, in its more developed form:
We remember that as a matter of fact, a contracted product is the trace of the product or even the equivalent of the scalar product for the vectors:
Now we need to separate the shear energy from the rest; here the rest corresponds to the dilatation energy or the hydrostatic pressure energy. Hydrostatic pressure corresponds to the stress obtained when a cube is pressed with a (hydro-type) pressure on all the faces of the REV (incidentally, you will be able to show that this tensor is invariant by rotation):
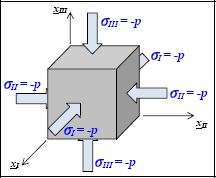
Figure 6.9. Hydrostatic pressure. For a color version of this figure, see www.iste.co.uk/bouvet/aeronautical.zip
In fact, we note that plasticity is never reached when a ductile material is subjected to a hydrostatic pressure, even a very significant one. Thus, we can separate the stress tensor into two parts; the hydrostatic part which has no effect on the plasticity and the deviatoric part:
Or if we write the hydrostatic part explicitly:
If we do the same with the strain, the contracted product of the stress tensor and strain tensor is then decomposed into two parts:
- – the product of the deviatoric parts of stress and strain;
- – the product of the hydrostatic parts of stress and strain.
As the cross products (deviatoric×hydrostatic) are null.
It is this deviatoric part that corresponds to the previously evoked shear energy.
In practice, as the stress and strain are linear amongst themselves, we prefer to use a deviatoric product of the stress tensor and we thus define the Von Mises stress σVM as the root of this deviatoric product of the stress tensor:
As for the 3/2 coefficient, it is just there so that the Von Mises equivalent stress is equal to the tension stress in tension (I will leave you to verify that in pure tension, σVM = σ).
It can also be written in its developed form:
We therefore consider that the material remains linear elastic if the Von Mises equivalent stress remains lower than the elastic limit σe:
In reality, this criterion functions rather well, but you obviously must not forget that in reality, it is the material that decides and the engineer’s role is to use the criterion best suited to the studied material!
If we trace the Von Mises criterion in the principal stress plane (σI, σII), we obtain an ellipse passing through ±σe in tension/compression (see Figure 6.8).
If we now trace the Von Mises criterion in 3D in the principal stress space (σI, σII, σIII), we obtain a circular-based cylinder with a tri-sector axis (the line of equation x = y = z) and a radius  (the tension axis is not perpendicular to the tri-sector axis, hence the coefficient
  ). This cylinder translates the fact that the criterion is independent of the hydrostatic pressure, namely of any stress tensor translation according to the tri-sector.
In the same way, we can trace the Tresca criterion which also gives a cylinder, but with a hexagonal base:
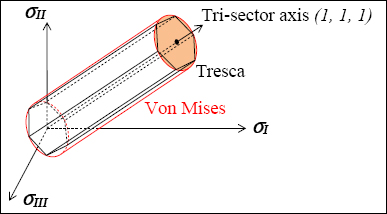
Figure 6.10. End of elasticity criteria of a ductile material. For a color version of this figure, see www.iste.co.uk/bouvet/aeronautical.zip
If we now compare the Tresca and Von Mises criteria, in both 2D and 3D, we realize that the difference between these two criteria is rather weak. To choose, we need to experimentally measure the end of elasticity criterion of the studied material and compare these experimental points to the theoretical criteria. In reality, we note that the experimental dispersions are often greater than the difference between these two criteria, and it is difficult to say if one is better than the other. In practice, we use the Von Mises criterion instead, so as to avoid the angular points of the Tresca criterion.
6.4.3. Rupture of a ductile material
If we now carry out a tension test on a ductile material, such as steel, for example, until a rupture appears, we note that the rupture facies is (in general) oriented at 45°. This result is rendered properly by the Tresca and Von Mises criteria which assume the predominance of the shear stress over the normal stress. In fact, we can show that in pure tension, the maximum shear is obtained at 45° of the tension direction (and is worth half of the tension stress).
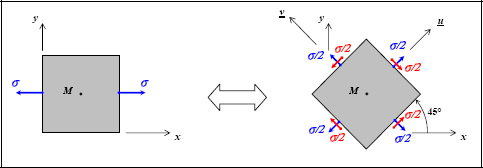
Figure 6.11. Maximum shear in a tension test. For a color version of this figure, see www.iste.co.uk/bouvet/aeronautical.zip
Nevertheless, this result needs to be taken with caution, as these criteria allow us to determine the beginning of plasticity, yet the rupture takes place at the end of plasticity. Moreover, it enables us to become aware of the beginning of plasticity, rather than the rupture phenomenon. We can still, however, use a very hard steel, meaning one which has been subjected to heat (and/or mechanical treatment), which enables its elastic resistance to be increased and therefore, in return, its plastic area to be diminished. It is therefore shown that the rupture is definitely at 45°, as predicted by the Tresca and Von Mises criteria. We will also incidentally note that as the shear sign is of no significance (unlike that of the normal stress), the rupture will, indifferently, take place at +45° or at −45° in 2D (and in any plane at 45° of the load axis in 3D).
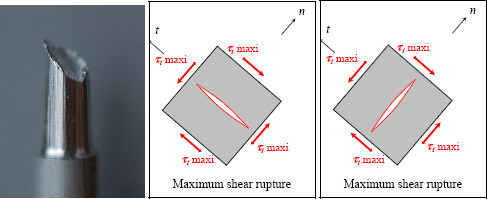
Figure 6.12. Rupture of a ductile material with little plasticity (Source: https://fr.wikiversity.org/wiki/Introduction_à_la_science_des_matériaux). For a color version of this figure, see www.iste.co.uk/bouvet/aeronautical.zip
This result is less true on a ductile material with significant plasticity, particularly as a significant necking develops throughout the test. The behavior is therefore not at all elastic and the modeling of this behavior is much more complex.
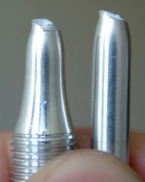
Figure 6.13. Rupture of a ductile material with much plasticity (Source: https://fr.wikiversity.org/wiki/Introduction_à_la_science_des_matériaux). For a color version of this figure, see www.iste.co.uk/bouvet/aeronautical.zip
EXAMPLE: SHEARING.–
If we use the Von Mises criterion, we can show that for a pure shear state (I will leave you to do the calculations):
From this, we can also deduce that using the Von Mises criterion automatically leads to:
which is generally quite well verified.
If we use the Tresca criterion, we can show that for a pure shear state (I will leave you to do the calculation):
From this, we can also deduce that using the Tresca criterion automatically leads to using:
It therefore remains to choose between the Von Mises coefficient  and the Tresca coefficient 2! Even if we prefer to use the Von Mises criterion more often for the reasons conveyed previously, in practice, it is obviously the material that decides, because the difference between these two coefficients is often drowned out by other experimental errors. Indeed, it must not be forgotton that experimentally determining the elastic limits of a ductile material is more complex than simply determining its elasticity modulus.
EXAMPLE: HYDROSTATIC PRESSURE.–
If we consider a material with an applied force by a hydrostatic pressure:
Then we can show that:
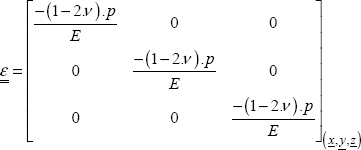
In short, regardless of the value of p, and even if it tends to infinity, plasticity can never be provoked! Be careful: that does not mean that there is no strain; elasticity is not based on equivalent stresses, and we can still calculate them:
As paradoxical as it may seem, it is properly verified! To do the test, it “suffices” to put a small cube in a liquid tank under pressure and to increase the pressure, note that the strain observed is effectively elastic (or almost).
6.5. Maximum shear criterion with friction: compression of brittle materials
We have seen previously that the maximum principal stress criterion enables us to simulate the rupture of brittle materials at first approximation. This is quite true in tension, but much less so in compression.
In particular, if we subject a brittle material to pure compression, we observe a crack with an angle between 45° and 60° of the loading direction. For example, let us take the case of a carbon fiber-based composite material. This material is evidently anisotropic, as the rigidity (and the rupture stress) in the fiber direction (longitudinal direction l) is much greater than that of the resin direction (transversal direction t and out-of-plane direction z). In contrast, in the plane (t, z), this material is isotropic. We are therefore talking about transverse isotropy as it presents a symmetry axis (l). We can therefore study the rupture of this material in 2D in the plane (t, z) as that of an isotropic material.
Before going back to the compression, note that in pure tension, this material presents a brittle rupture which starts at the fiber/resin interfaces. The crack is perpendicular to the loading direction, underlining the fact that this material is particularly sensitive to the normal tension stress, which is consistent with the criterion in maximum principal stress.
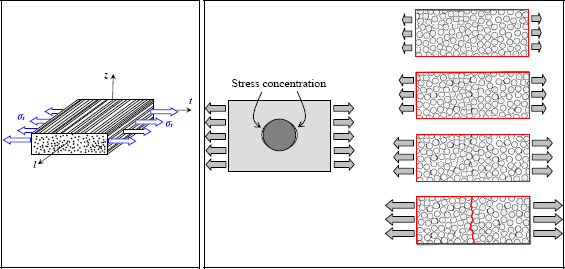
Figure 6.14. Rupture of a composite under transverse tension. For a color version of this figure, see www.iste.co.uk/bouvet/aeronautical.zip
Compression is more complex. As a matter of fact, as conveyed previously, we observe a crack making an angle between about 45° and 60° of the loading direction.
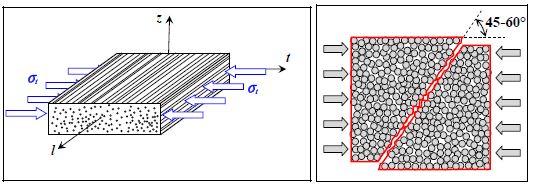
Figure 6.15. Rupture of a composite in transverse compression. For a color version of this figure, see www.iste.co.uk/bouvet/aeronautical.zip
At first approximation, we could think that, in the absence of a positive principal stress, the rupture would be due to a shear rupture. If this had been the case, then we would have observed a crack at 45° (the maximum shearing direction is at 45° of the compression direction).
Mohr–Coulomb presented the hypothesis that this rupture is definitely a shear rupture, but that it was upset by the friction due to the negative normal stress.
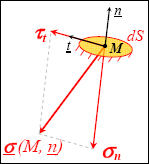
Figure 6.16. Compression stress vector. For a color version of this figure, see www.iste.co.uk/bouvet/aeronautical.zip
In other words, the stress leading to the rupture is definitely a shear stress, but is diminished by the friction due to the negative normal stress. In other words, the more negative normal stress there is, the more the material can withstand shear stress before breaking. Thus, we obtain:
where f = tan (ϕ) is the friction coefficient, σn is the normal stress (here σn ≤ 0) and τt is the shear stress.
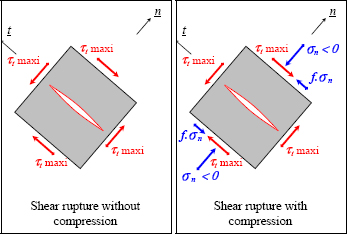
Figure 6.17. Shear rupture without and with compression. For a color version of this figure, see www.iste.co.uk/bouvet/aeronautical.zip
In the absence of a normal stress (or if the friction coefficient is null), the criterion is equivalent to the Tresca criterion and we therefore find that the shear limit τ0 is half of the tension limit:
where we note σ0, and not σe, as this criterion is a rupture criterion for a brittle material and does not make any sense for ductile materials and therefore, for determining the end of elasticity (except by taking a null friction coefficient, which goes back to using the Tresca criterion!).
We can therefore show that under pure compression, the stress leading to rupture will be greater (in absolute value) than that of tension:
with σt being the tension limit and σc being the compression limit (considered to be negative).
In the case where σI ≥ σII ≥ σIII, we can then show that the Mohr–Coulomb criterion can be written in the following form:
This criterion is especially used in civil engineering for studying concretes, rocks or soils.
A specific case is that of pulverulent materials, meaning powder materials or materials which crumble and transform into powder very quickly, as is the case for certain sands and soils. A pulverulent material therefore presents a null (or very weak) tension limit (and thus, a null shear limit). The only way to make it withstand the shear (which is the case for ground surrounding a building’s foundations) is therefore to subject it to compression stress, which the previous equation renders well.
If we trace the Mohr–Coulomb criterion in the principal stress plane (σI, σII), just like for the Tresca criterion, we almost obtain a hexagon with a dissymmetry in tension/compression.
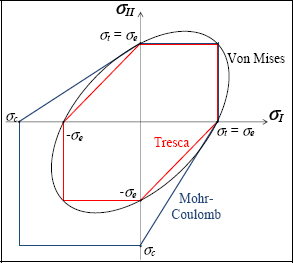
Figure 6.18. Mohr–Coulomb, Von Mises and Tresca criteria. For a color version of this figure, see www.iste.co.uk/bouvet/aeronautical.zip
If we now trace the Mohr–Coulomb criterion in 3D in the principal stress space (σI, σII, σIII), we obtain a strained cone with a hexagonal base (caused by the tension/compression dissymmetry). This cone form translates the influence of hydrostatic pressure on the Mohr–Coulomb criterion (unlike the Tresca criterion). Physically, this means that a positive hydrostatic pressure leads to rupture, contrary to a negative hydrostatic stress which settles for compressing the material without ever breaking it. This behavior is sufficiently verified for brittle materials. It also corresponds rather well to common sense.
If we now go back to the previously evoked carbon/epoxy compression test, we can then show that this criterion foresees a rupture angle θr:
If the friction coefficient is null, we definitely find a crack at 45°, and this angle increases with friction. In the case of carbon/epoxy, the rupture angle is about 54°, which would imply a friction angle of 18° and a friction coefficient of 0.32, which is in the order of magnitude of the measured values (or even a little greater).
In contrast, if we look at the ratio between the compression stress and the tension stress, we note that the theory foresees a maximum (in absolute value) of 2.4 for a friction coefficient of 1 (which is already very significant). In reality, this ratio attains about 4 for the carbon/epoxy (50 MPa in tension for –200 MPa in compression)!
Nevertheless, you must bear in mind that this friction concept is very limited before the rupture. As a matter of fact, if there is no rupture, there is no crack and there are no two surfaces in contact like there would be for classic friction. But in our carbon/epoxy case, we can think instead that this coefficient 4 is due to very different rupture phenomena for tension and compression. In tension, the rupture is in fact due to the coalescence of cracks created on the fiber/resin interfaces; cracks created as a cause of significant stress concentration (the fiber and resin materials have different rigidity). However, in compression, as the rupture is due to the shear, there is no reason for the stress concentration coefficient to be the same in tension, and must likely be lower.
As always, you must bear in mind that a model remains just that: a model. The reality is always more complex than the small model into which we wish it to fit! In other words, always remember to look properly at the reality before blindly using a model.
EXAMPLE: CALCULATION OF THE MOHR-COULOMB CRITERION IN COMPRESSION.–
If we consider a pure compression state in 2D (we can show that the result is the same in 3D):
with, of course, σ < 0. For a facet with normal vector n oriented at an angle θ of the x direction, we obtain:
Hence:
All that remains it to determine for which value θr of θ this stress is maximum, meaning after calculation:
Hence:
And the compression stress is subsequently:
6.6. Anisotropic criterion: example of the composite
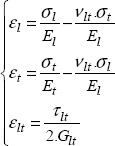
We now go back to the composite example presented previously. We have seen that this material has an anisotropic elastic behavior:
At first approximation, we can show that this material can be considered brittle. We can easily grasp that its rupture criterion is not isotropic, but anisotropic. Moreover, after having seen the complex rupture phenomena at play, we can show that a tension/compression dissymmetry is present.
In order to simplify the problem, we are going to place it in 2D in the plane (l, t).
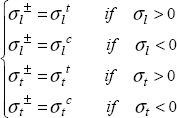
To account for the different behaviors observed, we can use a principal stress criterion, taking care to separate the different directions:
with  and
and  the tension and compression stresses at rupture in the longitudinal direction,
  and
and  the tension and compression stresses at rupture in the transverse direction and
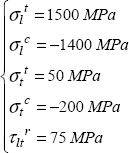
  the stress at shear rupture. For example, for the previously evoked T300/914, we have:
As mentioned previously, the drawback of this model is that it does not account for coupling between the directions. Therefore, we most commonly use the Tsai–Hill criterion.
This criterion is based on a generalization of the Von Mises criterion. The Von Mises criterion is written in 2D:
Tsai–Hill have then generalized it in the following form:
And we can easily show that in the case of tension in the longitudinal direction, we have:
In the case of tension in the transversal direction, we have:
And in pure shear:
The last parameter C is determined by considering that in bi-axial tension (σl = σt and τlt = 0), the rupture will be attained when σl is attained  , hence we can show that:
In practice, this hypothesis is difficult to verify as bi-axial tests on this type of orthotropic material with a large difference in behavior between the directions l and t is rather delicate to interpret. Nevertheless, as the influence of this parameter C remains rather weak in practice, in comparison to other parameters, its value barely modifies the criterion. The Tsai–Hill criterion is therefore written as:
With:
This can therefore be seen as a sum of elastic energies (divided by the rupture stress) in each of the directions, which enables us to partially account for the interaction between the different damages.
If we trace this criterion in 2D in the plane (σl, σt), we obtain a curve made up of four ellipse pieces. In this figure, the maximum stress criterion has been shown in order to draw a comparison.
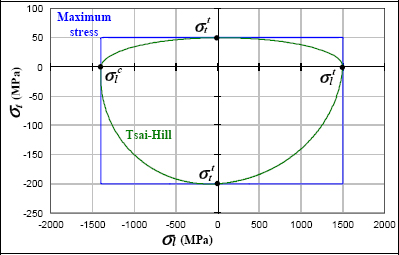
Figure 6.19. Tsai–Hill and maximum stress criteria. For a color version of this figure, see www.iste.co.uk/bouvet/aeronautical.zip


