8
Physics of Aeronautical Structure Materials
8.1. Introduction
In order to dimension a structure correctly, we must first have a full understanding of the materials in question. This gives us greater perspective as to the behavioral models used (elastic, plastic, viscoelastic, damaged, etc.) together with a better understanding of them. Indeed, we must always be aware that a material’s real behavior is invariably more complex than the model. Accordingly, here we will address the two main materials used in aeronautical structures, i.e. aluminum and carbon/epoxy composite. Together, these materials comprise approximately 70% of the structural mass of a commercial aircraft such as the Boeing 787:
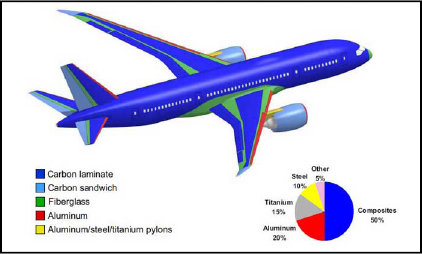
Figure 8.1. Materials in a Boeing 787 (according to http://www.boeing.fr). For a color version of this figure, see www.iste.co.uk/bouvet/aeronautical.zip
The other structural materials used are different composite materials based on fiberglass, sandwich structures (a honeycomb core covered by two composite skins), titanium, steel, etc.
However, while we must remember that in aircraft such as the Boeing 787 or the Airbus A350, the proportion of composite structural mass can reach 50%, in more standard aircraft, such as the Airbus A320 or A380, more than 60% of mass is comprised of aluminum alloy.
Steel and titanium are used for highly stressed areas. Titanium offers the advantage of being lighter than steel, but has lower characteristics. We also observe that the most widely used titanium – or to be more precise, the titanium alloy – is an alloy with 6% aluminum and 4% vanadium, called TA6V. Indeed, we will often employ (as a misappropriation) the term aluminum rather than aluminum alloy and titanium rather than titanium alloy.
Table 8.1. Mechanical characteristics of the main materials in aeronautics
| Material | Composition | ρ (kg/m3) | E (GPa) | σe (MPa) | KIc (MPa.m½) | Use |
| Ti : TA6V | 6%Al, 4%V, etc. | 4,450 | 110 | 800–1,000 | 10–13 | The most widespread titanium alloy used in aeronautics when aluminum is insufficient |
| Al : 2024 | 4.4% Cu, 1.5% Mg, 0.6% Mn, etc. | 2,770 | 70 | 250–300 | 30–32 | The most widespread aluminum alloy in aeronautics |
| Al : 2050 | 3.5% Cu, 1% Li, 0.4% Mg, etc. | 2,700 | 75 | 350–500 | 30–35 | Aluminum alloy recently used in aeronautics for new programs |
| Al : 7075 | 5.5% Zn, 2.5% Mg, 1.5% Cu, etc. | 2,800 | 72 | 350–500 | 25–30 | Aluminum alloy widely used in aeronautics (more up-to-date than the traditional 2024) |
| Steel | Fe, 0.02% to 2% C, etc. | 7,800 | 210 | 200–1,500 | 30–80 | A very broad range between all-purpose steel and maraging steel |
| Carbon / epoxy | carbon fibers, epoxy resin | 1,600 | 50–150 | 200–3,000 | 6–15 | The most widespread composite for aeronautical uses |
While many aluminum alloys are used in aeronautical structures, here we will limit our scope to three typical aluminum alloys: 2050, 7075 and 2024.
The first number of an aluminum alloy’s designation indicates its class. In effect, there are eight classes of aluminum according to their composition:
Table 8.2. Mechanical characteristics of principal aluminum alloys in aeronautics
| Series | Composition | Properties | Use |
| 1000 | Al not alloyed (content > 99.9%) | Low mechanical properties, good thermal and electrical conductivity, weldable | Common products do not require high mechanical properties |
| 2000 | Al-Cu (2024, etc.), Al-Cu-Li (2050, etc.), Al-Cu-Mg, etc. | Good mechanical properties, difficult weldability, poor corrosion resistance | Structures requiring mechanical resistance (particularly in aeronautics) |
| 3000 | Al-Mn | Quite good mechanical properties, weldable | As with 1000 series with better mechanical property |
| 4000 | Al-Si | Poor mechanical properties, very good castability | Foundry |
| 5000 | Al-Mg | Piping, boilers | |
| 6000 | Al-Mg-Si | Very good weldability, very good formability when hot | Vehicle bodywork, pylons, tubes, welded structures, ship building |
| 7000 | Al-Zn-Mg et Al-Zn-Mg-Cu (7075, etc.) | Very good mechanical property | Transport equipment (including aeronautics) |
| 8000 | Other alloys of Al | Al-Fe : household packaging |
2000 and 7000 series aluminum (and particularly 2024, 2050 and 7075) offer excellent static characteristics (E: Young’s modulus, σe: elastic limit and KIc: tenacity). Remember that KIc tenacity represents the critical stress intensity factor, i.e. the stress intensity factor leading to crack propagation. In physical terms this represents the capacity of a material to resist crack propagation; the lower this value, the slower a crack will grow (and vice versa).
At present, the most widely used alloys are 2024 and 7075. Their mechanical characteristics are actually quite similar with a superior elastic limit for 7075 and a better fatigue limit for 2024. Nonetheless, the widespread use of 2024 is due in large part to its earlier development. We should remember that the development of new aeronautical materials is a lengthy (and thereby expensive) process, requiring certification by the authorities prior to in-flight use.
2050 is a more recent alloy that is beginning to supersede traditional alloys. In effect, the addition of lithium allows for a reduction in density and an increase in the Young’s modulus compared to traditional alloys of the 2000 or 7000 series that are currently used in aeronautics. This promising alloy allows for weight reduction in aeronautical structures and is now widely used in new Airbus and Boeing programs. It also provides better corrosion resistance than alloy 2024.
We will now study 2024 in detail with particular consideration for the heat treatment required in order to obtain good mechanical characteristics. Indeed, we must remember that mechanical characteristics (particularly σe and KIc) can vary significantly according to the heat treatment. Unfortunately, an increase in σe typically induces a decrease of KIc, and vice versa. In other words, we have to decide between fracture toughness and strength!
8.2. Aluminum 2024
The most precise 2024 composition (% of mass) is as follows:
| Al | Cu | Mg | Mn | Fe | Si |
| Base | 3.8–4.9 | 1.2–1.8 | 0.3–0.9 | ≤ 0.5 | ≤ 0.5 |
And the heat treatment of a 2024 alloy for aeronautical structures is as follows:
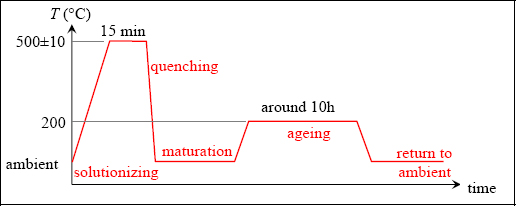
Figure 8.2. Heat treatment of 2024. For a color version of this figure, see www.iste.co.uk/bouvet/aeronautical.zip
The first step consists in a “solutionizing treatment”. If we are to understand this solutionizing treatment stage, we must first explain the equilibrium diagram for the alloy in question. The equilibrium diagram of a mixture corresponds to the equilibrium states in the mixture according to temperature. Let us consider the Al/Cu diagram for example:
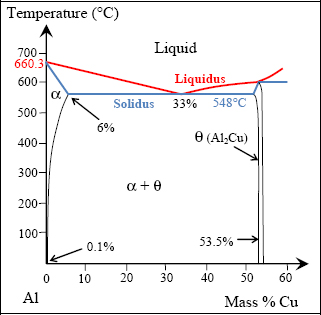
Figure 8.3. Al/Cu equilibrium diagram. For a color version of this figure, see www.iste.co.uk/bouvet/aeronautical.zip
In this diagram, the alloy composition figures on the x-axis, which is here the proportion of Cu (with the rest of the 100% being the proportion of Al), and temperature on the y-axis. Accordingly, one point on the diagram allows us to determine the phase of the alloy at a given temperature. In reality, we would also have to consider the effects of other alloying additions, particularly magnesium and manganese, but we can show that the equilibrium diagram does not vary significantly.
If we take this alloy at high temperature (T > 650°C, for example at point A), the mixture is liquid and composed of a single phase. From 650°C (point B), a solid α-phase develops, coexisting with the liquid phase to 580°C (point D). This behavior differs considerably for a pure substance in which the phase-change occurs at constant temperature (with heat exchange occurring relative to the latent heat of the phase-change). For example, this is the case for pure aluminum (0% of Cu in the equilibrium diagram, above) that goes from the liquid to solid phase at 660.3°C, or for water at 0°C (if we account for only regular pressure at atmospheric pressure of course!). The line corresponding to the fusion temperature of an alloy (which varies according to composition) is called liquidus, while the line corresponding to the complete solidification temperature is called solidus.
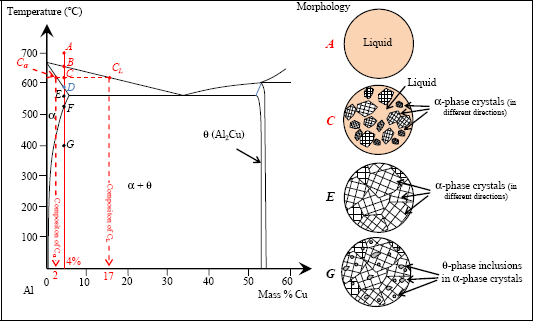
Figure 8.4. Heat treatment of 2024. For a color version of this figure, see www.iste.co.uk/bouvet/aeronautical.zip
Between the two phase-change temperatures (points B and D), we are able to determine the percentage of each phase (α and liquid), along with the composition of each of these phases.
Let us take the example of the 2024 alloy at 620°C (point C). We can see in the equilibrium diagram that the liquid phase is composed of 83% Al and 17% Cu (point CL corresponding to the projection of C on the liquidus), and that the solid α-phase is composed of 98% Al and 2% Cu (point Cα corresponding to the projection of C on the solidus). The proportion of each of these phases can also be determined by the ratio between segment lengths. The proportion of liquid is equal to CCα/CαCL, here 16%, and the proportion of the α-phase is equal to CCL/CαCL, here 84%, (this is known as the “inverse segments rule” or the “tie-line rule”). Of course, we can verify that as we are closer to a domain, the more the proportion of the domain’s constituent becomes significant; in addition, the total of the two constituents must correspond to 100%. Furthermore, we also see that during alloy cooling, not only do the proportions of the phases present change, but also the composition of each phase changes.
In practice, during cooling the creation of the solid, α-phases occurs throughout the liquid. This process is called nucleation. Typically, nucleation occurs due to defects, for example around the atoms of non-desired elements (an alloy’s composition can never be fully perfect, inevitably comprising traces of other elements).
Once point D has been passed, the alloy is completely solid, now made up of a single α-phase. In other words, the Al and Cu compounds are entirely miscible, now forming a coherent atomic arrangement. These coherent atomic arrangements occur over small distances, forming the grains of the material. The typical size of a grain is in the order of a tenth of a millimeter. These grains vary from one another in terms of their crystallographic alignment (which, as a general rule, is random). The grains occur from growth at the nucleation sites mentioned above.
Between D and F, not much happens. If we continue the cooling below point F, the α-phase becomes unable to dissolve all the Cu, leading to the formation of a θ-phase (composed of Al2Cu) in the α-phase. As above, here we can similarly determine the composition of the α- and θ-phases and determine the proportion of each of these phases by means of the inverse segments rule. For example, at 400°C (point G), we obtain 95% of the α-phase and 5% of the θ-phase. In practice, the Cu atoms separate from the α solution in the form of massive inclusions (quite massive precipitates) to form θ-phase inclusions in the α-phase. This phenomenon is made possible by the diffusion of Cu atoms in the α-phase. In practice, this phenomenon is slow and can often be blocked by means of a quenching. A quenching is a rapid cooling obtained by soaking the alloy in water, oil or on occasions simply by means of a cool air flow (the most famous example of quenching would be that of a blacksmith dipping a white-hot sword into water). In the case of quenching, the material obtained is not the mixture as projected by the equilibrium diagram, but a non-equilibrium mixture. Indeed, we should recall that the equilibrium diagram, as its name would suggest, lets us determine the equilibrium state of an alloy at equilibrium point. In practice, alloys are necessarily inclined to develop towards their equilibrium state, but in certain situations this occurs very slowly; in other words, over periods that could indeed be far longer than the structure’s use.
Let us now return to the heat treatment of 2024. As in the equilibrium diagram, the solutionizing treatment stage works to create a homogeneous α-phase. The temperature of 500±10°C does not correspond exactly to the Al/Cu equilibrium diagram presented, as the addition of other compounds also modifies this diagram somewhat. The solutionizing treatment duration of about 10 minutes works to dissolve any θ-phase precipitates that could have formed during the material’s development (the Cu atoms must be given enough time to diffuse in the α-phase). We should also bear in mind that if the workpiece in question is thick, it will be harder to obtain a homogeneous temperature throughout (thicker or thinner sheet metal).
Next, we perform quenching in water in order to fix the material’s structure in this α-phase. This gives us a supersaturated solution, since the proportion of Cu in the α-solution is greater than it should be at ambient temperature. In practice, sheet metal is taken out of the furnace then soaked in a water pool. This procedure must happen quickly in order to avoid cooling and thereby the formation of θ-phase precipitates. We then obtain a material with relatively low hardness and elastic limit (σe is in the order of 150 MPa), but with good ductility.
If we keep the alloy at ambient temperature, θ-phase precipitates will form, increasing its hardness and elastic limit (while simultaneously decreasing ductility). In this way, we can obtain an elastic limit up to approximately 300 MPa. These precipitates are much smaller and more numerous than those that could be obtained without quenching. Accordingly, their action is much better, which explains the significant increase in the elastic limit. Note that in order to increase the elastic limit we must restrict the movement of dislocations, by means of precipitates for instance. In practice, while hardening obtained by maturation is of interest, it requires long maturation periods and is often disregarded in favor of a return to an intermediate temperature of around 200°C for several hours.
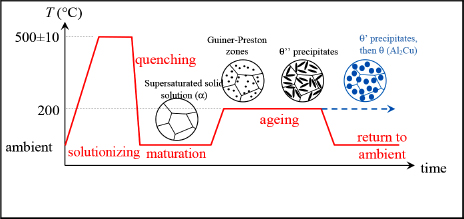
Figure 8.5. Heat treatment of 2024. For a color version of this figure, see www.iste.co.uk/bouvet/aeronautical.zip
At the start of aging, the Cu atoms regroup to form aggregates called the Guinier–Preston zone. In θ’’-phase, precipitates (this phase has a slightly different composition to that of θ-phase and a different crystallographic structure) are then formed in the shape of platelets. It is by means of these θ’’ platelets that we can significantly increase the hardness and elastic limit of 2024 (of course, fracture toughness decreases simultaneously), known as precipitation hardening. If aging is continued, θ’-phase precipitates, allowing for further small gains in hardness. Here, we cease aging for 2024. It is through a judicious mixing of θ’ and θ’’-phases that we obtain the best elastic limit. If aging were maintained, we would obtain a recomposition of θ’ and θ’’-phases as θ-phase, and since this phase is more coarse, we would have reduced the elastic limit. Clearly, we see why the 2024 alloy cannot be used at a high temperature: to avoid θ-phase formation. In practice, its use is limited to below 160°C. At higher temperatures, we must use titanium or steel.
The process for hardening aluminum alloys was discovered at the beginning of the 20th Century, though it was only explained by Guinier and Preston in 1938. It was later in 1950, with the development of transmission electron microscopy, that the various θ, θ’ and θ’’-phases were observed.
This overview of precipitation hardening should give some insight into the complexity accompanying the development of a new alloy. Indeed, metal workers must choose the composition and associated heat treatment in order to obtain the desired mechanical properties at the lowest cost. The possibilities of chemical composition are endless, and the number of heat treatments is similarly infinite; so metal workers’ choices are infinite, too!
This section’s overview of aluminum 2024 heat treatment is significantly abridged, and the interested reader is referred to [ASH 86], [BRO 04], [DEV 86], [DEQ 12], [DOR 86] and [DUP 13].
8.3. Carbon/epoxy composite T300/914
We will now consider a carbon/epoxy composite material widely used in aeronautical structures: T300/914.
Composite materials are increasingly used in the industry due to their high performance/mass ratio. Of course, this is particularly significant in the aeronautical and space fields due to the crucial importance of the mass criteria for the structures involved. This high performance/mass ratio is due to the use of material with high specific mechanical characteristics, such as carbon fibers, fiberglass or Kevlar.
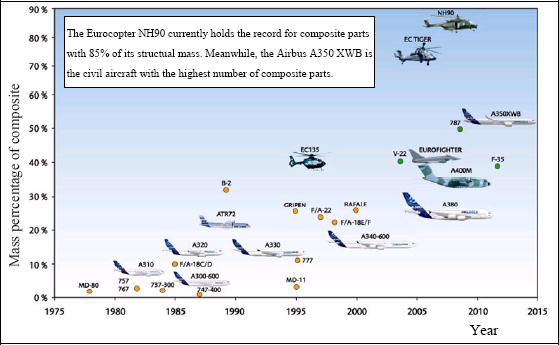
Figure 8.6. Mass percentage of composite in the structure of Airbus aircraft (according to http://www.airbus.com/). For a color version of this figure, see www.iste.co.uk/bouvet/aeronautical.zip
Nonetheless, these materials present the major drawback of being more brittle and so must be used alongside less brittle resin-type materials. This is the basic idea of composites, which seek to reinforce a high performance but brittle material, typically in the form of longer or shorter fibers according to the application, by means of a lower performance but less brittle matrix, typically a resin. We should briefly note that though the name would not suggest it, a composite material is not a material but rather the association of at least two materials, typically with complementary characteristics. It should also be noted that on the association of these two materials, an interface between the two is created that also plays its role in overall behavior of the composite.
In particular, we will consider a first generation carbon/epoxy composite made of 50% (in volume) carbon fibers and 50% epoxy resin, traditionally used in aeronautics: T300/914. Where T300 is the reference of the carbon fiber (manufactured by Toray) and 914 that of the epoxy resin. This composite is in the form of a fabric 0.1–0.2 mm thick that can be cut and stacked in order to attain the thickness required.
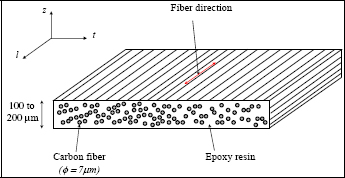
Figure 8.7. Carbon/epoxy UD lay-up. For a color version of this figure, see www.iste.co.uk/bouvet/aeronautical.zip
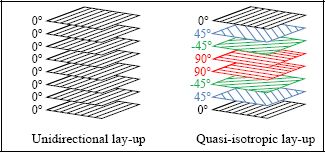
Figure 8.8. Unidirectional and quasi-isotropic lay-up. For a color version of this figure, see www.iste.co.uk/bouvet/aeronautical.zip
If we perform a test in the fiber direction, called the longitudinal direction, we observe a brittle elastic behavior similar to that of the fibers. The tensile strength is clearly significantly less than that of the fibers, since around 50% is resin, which has a relatively low tensile strength. This resin is necessary in order to provide a less brittle material and to give the material its form. The carbon fibers are indeed quite interesting features in terms of their mechanical characteristics, but cannot be shaped to allow for the desired geometry. In addition, when cracks occur perpendicularly to the fibers in the material, they provoke numerous fiber cracks and fiber debonding, requiring significant dissipation of energy, making the material less brittle. In practice, such cracks tend to propagate parallel to the fibers if they can, which means that other plies should be put in different directions in order to reinforce the material in all the loading directions (essentially, we can show that the four directions 0°, +45°, −45° and 90° should suffice). Such material is called composite lay-up, as opposed to composite material with a single fiber direction, which is called unidirectional composite.
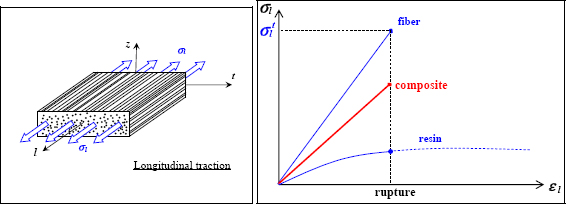
Figure 8.9. Tension test in longitudinal direction in a composite: fiber, resin and composite behavior. For a color version of this figure, see www.iste.co.uk/bouvet/aeronautical.zip
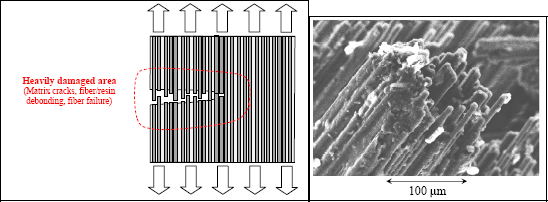
Figure 8.10. Tension test in longitudinal direction: damaged area. For a color version of this figure, see www.iste.co.uk/bouvet/aeronautical.zip
The actual structure of a composite is far more complex than that of a more or less homogeneous standard material of the metallic type and requires its own design. The design of a composite structure requires the simultaneous development of a material and a structure; this is the fundamental difference between the development of a metallic structure and a composite structure. In addition to the conventional design iterations of a metallic structure in terms of geometry, composite designs require iterations in terms of the material design; since clearly both of these types of iterations are closely related. In practice, we must add decisions concerning draping sequence or composite manufacturing to the conventional steps of structure geometry.
If we compare Young’s modulus and the strength of the main structural materials according to density, we observe that composite materials impress with their performance, particularly when compared to metals. Ceramic materials are also very impressive, despite being too brittle for any structural use.
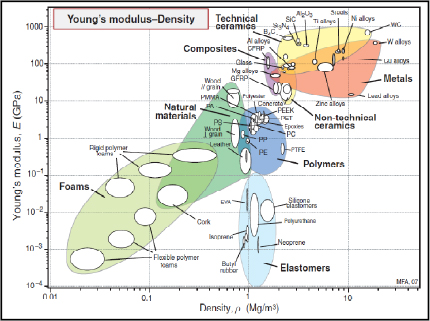
Figure 8.11. Young’s Modulus according to density [ASH 80]. CFRP: Carbon Fiber Reinforced Plastic/GFRP: Glass Fiber Reinforced Plastic. For a color version of this figure, see www.iste.co.uk/bouvet/aeronautical.zip
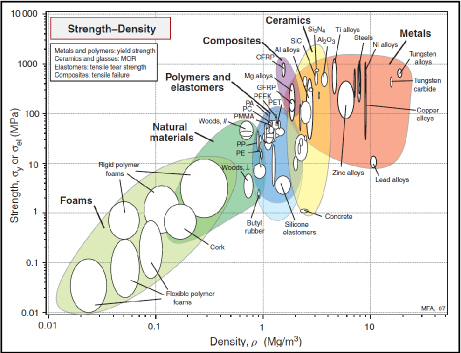
Figure 8.12. Strength according to density [ASH 80]. CFRP: Carbon Fiber Reinforced Plastic/GFRP: Glass Fiber Reinforced Plastic. For a color version of this figure, see www.iste.co.uk/bouvet/aeronautical.zip
The overview of T300/914 presented in this paragraph is significantly abridged and the interested reader is referred to [BER 99], [CAS 13], [GOU 10] and [GAY 15]
We will now consider the composition and microstructure of a composite material in detail, and that of epoxy resin in particular.
8.4. Polymers
The epoxy matrix is part of the wider polymer family generally known as plastics. The term “plastic” stems from the mechanical behavior of polymer that often presents plastic deformation, i.e. where deformation does not return to zero when a stress is released.
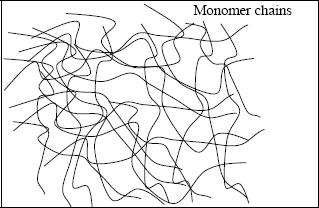
As the name implies, polymers are composed of monomer chains bonded together by covalent bonds. For present purposes, we will limit our scope to organic polymers. Note that organic matter is made up of various forms of life (vegetables, fungi, animals and microorganisms), and, in particular, through their decomposition. In contrast, inorganic or mineral matter is composed of glass, metal, ceramic or stone.
Organic polymers are based on chains of monomers, themselves based on carbon atoms. The covalent carbon–carbon bond is strong, leading to high mechanical properties. These carbon–carbon bonds act as the basis of the macromolecules that comprise the essential structure of the polymer material. In addition to these strong bonds, these macromolecules are bonded between one another by weak bonds (hydrogen bonds, Van der Waals bonds, etc.). It is the deformation of these weak bonds that induce the significant plastic deformation of polymers.
Let us consider the example of polyethylene, one of the simplest and least expensive polymers. It is composed of the polymerization of ethylene monomers (CH2 = CH2) leading to the creation of long chains. These chains are bonded between one another simply, by means of strong bonds. Accordingly, the mechanical characteristics obtained remain weak and heavily dependent on temperature.
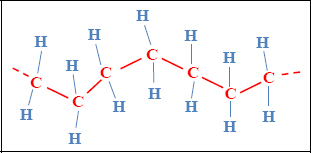
Figure 8.13. Structure of polyethylene. For a color version of this figure, see www.iste.co.uk/bouvet/aeronautical.zip
If, for example, we track Young’s modulus according to temperature, we obtain a characteristic curve in three parts allowing us to depict two characteristic temperatures of the material in question: the glass transition temperature Tg and the melting temperature Tm. Below Tg, the material’s behavior is conventional as per a solid material; above Tm, its behavior is almost that of a (more or less viscous) fluid; between the two temperatures, we observe a behavior known as rubbery, characterized by very low rigidity and high deformation capacity. Usually polymers cannot be used as a structural material or as the resin of a composite material at temperatures greater than Tg (although some exceptions to the rule exist, for example when this temperature exceeding Tg is only temporary).
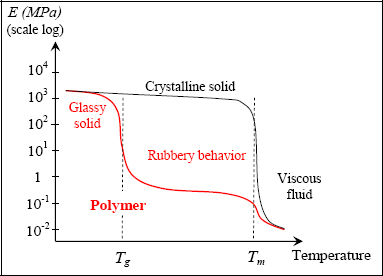
Figure 8.15. Polymer rigidity according to temperature. For a color version of this figure, see www.iste.co.uk/bouvet/aeronautical.zip
This rubbery behavior can occur since the molecule chains involved only have weak bonds (hydrogen bonds, Van der Waals bonds, etc.) between one another. This means that they can rearrange themselves, realigning with the loading. This type of polymer is known as a thermoplastic, since its plastic behavior is dependent on temperature.
If we perform a tensile test at a temperature far below its Tg (T1 in the below figure), we obtain a brittle linear elastic behavior. If we increase the temperature, while staying below the Tg (T2 in the below figure), we then observe nonlinearity bonded to the viscoelasticity. Viscoelasticity is an intermediate behavior between elasticity, which requires that deformation returns to 0 once the force has been released, and viscous behavior, in which the material flows almost as a liquid.
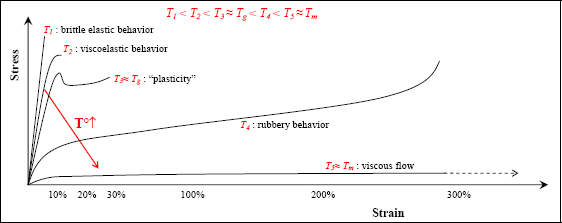
Figure 8.16. Behavior of polymers with temperature. For a color version of this figure, see www.iste.co.uk/bouvet/aeronautical.zip
Viscoelastic behavior is highly dependent on stress rate. When the stress is applied quickly, the material reacts immediately, like an elastic material. When the stress is applied slowly or maintained over a long period, the material tends to flow like a viscous fluid.
If we increase the temperature to Tg (T3 in the figure above), we observe “plasticity” of the material. However, here, the meaning of “plasticity” is taken in the plastic sense of the word, that is, not returning to its initial state once the force is released, and is unrelated to the plasticity of metallic materials. This “plasticity” is due to the molecule chains being stretched by the load, and once stretched, being unable to return to their natural state.
If we increase the temperature beyond Tg (T4 in the figure above), then we obtain a rubbery elasticity. This elasticity is similar to that of elastomers with a highly nonlinear behavior (the curve begins by softening, then proceeds to harden), but always with a return to zero (or almost zero) deformation on release from stress.
If we increase the temperature still further to around the melting temperature Tm, then we obtain the behavior of a viscous fluid with a nonlinear and perfectly plastic behavior: when the stress is released, the material remains in the deformed state without elastic return.
If we wish to increase the mechanical characteristics of a polymer, we must stop the relative movement of the molecule chains by creating covalent bonds between molecule chains. This phenomenon is called cross-linking.
This is referred to as a thermoset polymer (or a thermoset, the widely used abbreviation, which we will adopt here) if the degree of cross-linking is significant, or as a thermoplastic polymer if cross-linking is absent. It should be noted that the term “thermoset” stems from the fact that the chemical reaction that allows cross-linking is activated by temperature. While this is true during manufacturing, it is not the case latter on once the polymer is already cross-linked.
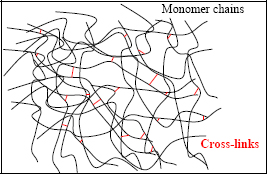
Figure 8.17. Secondary bonds between monomer chains: cross-links. For a color version of this figure, see www.iste.co.uk/bouvet/aeronautical.zip
There is a third class of polymer, elastomers, which offer behavior between that of thermosets and thermoplastics. Typically, elastomers have low levels of cross-linking that is characterized by a different sort of covalent bond based on sulfur (referred to as vulcanization). These sulfur-based bonds provide them with very high levels of (largely nonlinear) elasticity.
Now, returning to the change in Young’s modulus according to temperature, we are able to differentiate a thermoset polymer from a thermoplastic polymer by a less evident, or absent, glass transition and by the absence of a melting temperature. The glass transition is due to the dissociation of the weak bonds by thermal agitation. Nonetheless, since the thermoset presents numerous cross-links, this cross-link network endures beyond Tg, conferring the thermoset with a good mechanical behavior even after Tg. If we continue to increase temperature, then we reach the material decomposition by pyrolysis, i.e. by decomposition in the form of various gasses and residues (CO, CO2, H2, etc.).
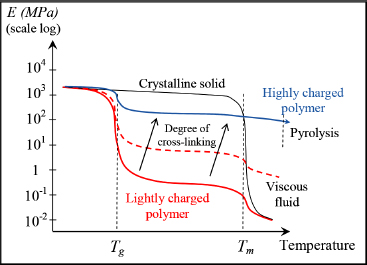
Figure 8.18. Polymer rigidity according to temperature and degree of cross-linking. For a color version of this figure, see www.iste.co.uk/bouvet/aeronautical.zip
In chemical terms, this thermoset/thermoplastic difference is due (as a first approximation) to the type of chemical reaction used to synthesize the polymer. Thermoplastic is obtained by a simple addition reaction or polyaddition (making the creation of cross-linking bonds difficult), while a thermoset is obtained by a condensation reaction or polycondensation (inducing many cross-links). This is also known as a polymerization reaction that regroups both of these reactions.
The presence (or absence) of cross-links in the polymer network completely modifies not only its mechanical behavior but also the manufacturing and recycling process. Thermoset is created once and for all during the polycondensation reaction. Accordingly, it must be set in their form prior to this reaction and cannot be reshaped afterwards. Let us consider the example of the carbon/epoxy composite T300/914 mentioned above (epoxy is a thermoset polymer). It is typically sold in the form of film that is 0.1–0.2 mm thick, comprising approximately 50% epoxy matrix and 50% carbon fiber (fiber diameter approximately 7 μm), called prepreg. The name “prepreg” stems from the fact that the fibers are pre-impregnated by resin. This resin is composed of monomers and a hardener, working to favor the chemical reaction of polymerization. In order to avoid the polymerization of prepreg, it has to be maintained at low temperature (typically in the freezer at –20°C) and has a rather short expiration date (typically in the order of 1–2 years). The prepreg must then be assembled in order to create the part required, before the whole is heated. This heating initially acts to cause the resin to melt (or, more precisely, to decrease its viscosity), and thereby give the part its shape. This is a particularly delicate phase since any air bubbles present in the prepreg have to be evacuated, especially those in the layers of the prepreg, in order to avoid any porosity (which act as potential cracks, making the material more brittle). In order to aid the evacuation of these air bubbles, we typically place the thermosetting composite in vacuum sheet, in which we create a primary vacuum, with the whole then being put under pressure (between 5 and 12 bars) and cure. For this, we use an autoclave (essentially, a large pressure cooker), which of course has to be bigger than the workpiece in question; however, this can prove problematic if we need to make the wing of a plane.
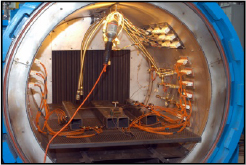
Figure 8.19. Autoclave for thermoset curing. For a color version of this figure, see www.iste.co.uk/bouvet/aeronautical.zip
Next, the temperature activates the polymerization reaction (here, polycondensation) and consolidates the material. If we heat the composite a second time then nothing more will happen unless we exceed the pyrolysis temperature. Accordingly, it is impossible to shape a material twice or even to recycle it. Indeed, the need to maintain these materials at low temperature, their short expiration date and the lack of any recycling possibilities constitute the major drawbacks of thermoset polymer.
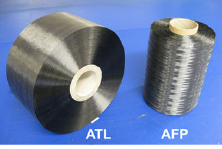
Figure 8.20. Photo of a prepreg roll (photo Hexcel). For a color version of this figure, see www.iste.co.uk/bouvet/aeronautical.zip
Unlike thermoset, thermoplastic does not contain cross-linking, which means that it can be reshaped by simply heating it above the melting temperature. As a result, it is easily recyclable and can be kept at ambient temperature with no expiration date. Its major drawback is its lower mechanical characteristics compared to thermoset. Yet despite this, it is currently being tested as a replacement for thermoset in the aeronautical field. It is also undergoing significant scrutiny in the automobile field. It can be shaped by means of Sheet Moulding Compound, or SMC, which allows for high-throughput production. As a comparison, the typical curing cycle of a thermoset composite, such as the T300/914, is around 2 h, as opposed to several minutes for a thermoplastic composite shaped by SMC. Indeed, automobile manufacturers can only consider thermoplastic for production use (outside of a few luxury vehicles).
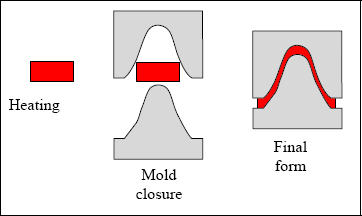
Figure 8.21. Sheet Moulding Compound (SMC) for thermoplastic heating and shaping. For a color version of this figure, see www.iste.co.uk/bouvet/aeronautical.zip
Nonetheless, it is possible to increase the mechanical characteristics of a thermoplastic by modifying the molecular chain’s morphology. For this, we have to correctly align the molecular chains in order to increase rigidity in the stretching direction. For example, let us consider a tensile test of a thermoplastic polymer. The typical behavior we see here is in three phases:
- – the first phase corresponds to the material’s linear elasticity;
- – if we continue stretching it, we then see a necking (a localized tightening of the cross-section) and plastic behavior (if we release the stress, the deformation does not return to zero). We then see a stress plateau corresponding to the material’s stretching and the development of the necking zone throughout the workpiece. Typically, we see maximum strain in the order of 100–300%!
- – once the workpiece is stretched, we observe significant rigidification in its mechanical behavior. If we continue to stretch it, we then observe the rupture of the molecular chains being stretched. This is a particularly interesting phase of rigidification since it allows us to obtain a much more rigid material than the initial material.
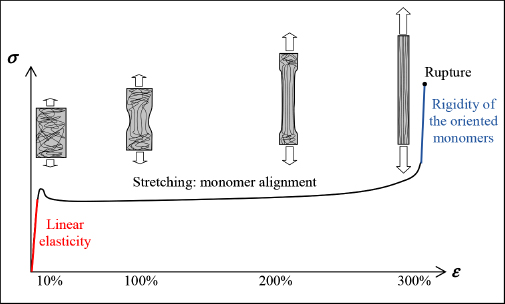
Figure 8.22. Tension test of a polymer. For a color version of this figure, see www.iste.co.uk/bouvet/aeronautical.zip
In practice, this stretching allows us to obtain fibers (for example, Nylon fiber is obtained by stretching a liquid form) or thin films, which can be stretched in one or two directions. Of course, this stretching does not provide us with a matrix of composite material, for which we need rigidity in all directions.
Such molecular chain alignments can also be obtained naturally during cooling, which would be crystallization. Indeed, we can show that in order to minimize their energy, molecules attempt to align in certain favored directions. These alignments are only possible in the absence of cross-links, and consequently appear only in thermoplastic.
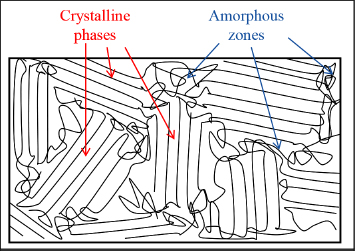
Figure 8.23. Crystalline phases and amorphous zones in a thermoplastic polymer. For a color version of this figure, see www.iste.co.uk/bouvet/aeronautical.zip
In practice, the degree of crystallization (or degree of crystallinity), i.e. the portion of the crystalline phase in the material, can reach 80–90% in the most organized thermoplastics, being dependent on the cooling rate. This degree of crystallization is higher as the cooling rate is lower; in other words, the macromolecules must be given time to reorganize if we want crystals. If cooling occurs too quickly, the material forms with no particular order and we obtain an amorphous material; this is a state also known as a glassy or vitreous state. This is also the origin of the term “glass transition”, since on passing the glass transition temperature Tg, the crystals disappear and the material again becomes amorphous. It is also due in part to the disappearance of this crystalline phase that thermoplastics’ mechanical characteristics decrease significantly on passing Tg.
NOTE.– The glass commonly used in windows is a vitreous material (though by no means a polymer, being largely composed of silica and clearly inorganic). Due to its amorphous state it is transparent, meaning light can pass through it without interacting with the crystalline network (which is absent).
To achieve a thermoplastic matrix with satisfactory mechanical properties, we must not only select an attractive molecule, but also develop a manufacturing process that encourages its crystallization. Now, returning to the development curve of Young’s modulus according to temperature, we see that a significantly crystalline thermoplastic behaves in a similar manner to a thermoset with an unremarkable Tg. Of course, we must be mindful not to use this thermoplastic too close to its melting temperature to avoid decreasing its degree of crystallinity and provoke its return to an amorphous state.
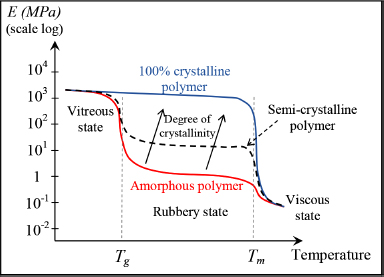
Figure 8.24. Rigidity of a thermoplastic polymer according to the temperature and degree of crystallinity. For a color version of this figure, see www.iste.co.uk/bouvet/aeronautical.zip
Currently, the composite materials used for structural applications in aeronautics are in large part composites based on an epoxy matrix; therefore thermoset. Two thermoplastic matrices are under consideration to replace this: the PPS matrix (PolyPhenylene Sulfide) and the PEEK matrix (PolyEther Ether Ketone). The value of thermoplastic is, as was mentioned above, its high recyclability and conservation at ambient temperature with no expiration date. Another advantage is its superior ductility. Since thermoplastic has no cross-links, it is more liable to deform prior to rupture, and presents superior ductility as a consequence. Indeed, remember that one of the major drawbacks of composite material is its brittleness, particularly following impacts, and so matrices with superior ductility let us reduce this brittleness.
In order to compare these three materials, a comparison table is provided below. These values must be taken with precaution, for cost in particular, since this is greatly dependent on the supplier, the quantity produced and the level of the mechanical properties, which depend both on the degree of crystallinity and on temperature. The values provided here correspond to measurements at ambient temperature and a high degree of crystallinity properly controlled during the manufacturing process (in other words, for a material created in good conditions).
| Epoxy matrix (thermoset) | PPS matrix (thermoplastic) | PEEK matrix (thermoplastic) | |
| Density (kg/dm3) | 1.29 | 1.35 | 1.32 |
| Tg(°C) | 190 | 90 | 143 |
| Maximum working temperature (°C) | 110 | 100 | 260 |
| Tm(°C) | - | 285 | 380 |
| Young’s modulus (GPa) | 4 | 3.3 | 3.3 |
| Tensile stress at rupture (MPa) | 100 | 50 | 100 |
| Fracture toughness (J/m2) | 100–500 | 700 | 4,000 |
| Price (€/kg) | 10 | 10 | >100 |
Compared with epoxy, PPS has the advantage of a similar cost with somewhat lower mechanical characteristics with the exception of fracture toughness, which is much higher. Its working temperature is also slightly below that of epoxy.
PEEK is a particularly attractive as a candidate to replace epoxy, even if its price still remains prohibitive. It can be used up to 260°C, with mechanical characteristics similar to those of epoxy, with the exception of fracture toughness, which is much higher. Nonetheless, it is more complex to implement, requiring heating above its Tm to be shaped, i.e. temperatures approaching approximately 500°C, while for an epoxy resin a temperature of approximately 190°C is recommended. In all likelihood, we can expect to see its use increase in the coming years once the manufacturing process has been perfected and the cost reduced.
The overview of polymers presented in this paragraph is significantly abridged and the interested reader is referred to [ASH 80], [ASH 86], [DEQ 12], [DOR 86], [DUP 09], [DUP 13], etc.