
Figure 12.1.Air pollution in Beijing, China. Photo by testing. Stock photo ID: 354568241. Shutterstock.com.
Chapter 12
Humans and the environment–pollution and climate change
In China, students at expensive private schools play on fields enclosed by massive tents with air filters to keep out smog. In Japan, the 2011 Fukushima nuclear power plant disaster forced nearly 500,000 people to evacuate the surrounding area due to radiation leaks. Contaminated water kills hundreds of thousands of people each year. New York, Houston, and other cities around the world are flooded by massive hurricanes, and record breaking wildfires scorch the southwestern United States, Portugal, and other regions as the climate changes and brings drought, irregular precipitation, and extreme storms. Clearly, we face a wide range of environmental impacts: pollution of our air, water, and land and global uncertainty brought about by a changing climate (figure 12.1).
Figure 12.1.Air pollution in Beijing, China. Photo by testing. Stock photo ID: 354568241. Shutterstock.com.
As humans impact and modify our planet, many argue that we have entered a new geologic epoch, one that is less dependent on natural changes in the earth and atmosphere and more dependent on humans. This human-induced epoch is known as the Anthropocene, a stage in which human actions have drastically altered the earth. People have transformed landscapes by altering plant and animal compositions, cutting and filling mountains and valleys, altering the flow of rivers, and changing the global climate. But while many people see these changes as a condition of modern human society, in fact, humans have been moving the planet into the Anthropocene ever since Homo sapiens migrated out of Africa.
Over twenty thousand years ago, as humans settled Eurasia, Australia, and the Americas, they immediately began altering the natural environment. With fire they cleared forests, through hunting they contributed to extinctions of megafauna, and with their migrations they carried invasive plants and animals to new places. The process of environmental transformation accelerated with the advent of agriculture roughly ten thousand years ago. Forests and grasslands were cleared on a massive scale for wheat and rice cultivation. Additional clearing resulted as pastoralism diffused across the continents via domesticated animals such as cows, goats, and sheep. Some researchers even argue that deforestation and increasing methane emissions from these actions were the first stage in human-induced climate change. As humans further expanded via the seas, they brought environmental change with them to ecologically isolated islands, such as Cyprus in the Mediterranean, Tonga in the Pacific, and many other places. Islands were dramatically altered as humans introduced new plant and animal species and cleared forests for human uses. In many cases, these new species quickly decimated native ones. Bird species went extinct, as did mammals, lizards, flowers, and other native life. Often, overall biological diversity was drastically reduced after human arrival.
With urbanization and the expansion of global trade, human impacts on the environment accelerated. Bronze Age people around the Mediterranean cleared native forests for orchards, such as olives, grapes, and figs. In the Americas, the Mayan people and others cleared tropical forests as their populations grew as well. As early as the thirteenth and fourteenth centuries, there is evidence that Northern and Western Europeans were overexploiting fish reserves.
Overall, it can be said that there are no pristine natural landscapes on the earth, and there likely have not been any for thousands of years. Humans are part of the ecosystem and modify it just as other species do, although arguably on a greater scale. Because of the substantial impacts we make on the environment, it is essential to understand how they happen and how to mitigate them to ensure healthy ecosystems for ourselves and other life on earth.
Pollution
As human populations have grown and settlement patterns have become denser, pollution of the air, water, and land has become of greater concern. Pollution occurs when a substance is added to the environment at a quicker pace than it can be dispersed, decomposed, or diluted. Smoke from a fire pit that quickly disperses into the air may not be considered pollution, but when smoke from myriad fires—whether from chimneys, garbage incineration, factories, vehicles, wood-burning stoves, or other sources—is emitted in an urban area and accumulates over the city, it becomes pollution. The same holds true with water. A small amount of fertilizer runoff that is quickly diluted in a large river poses no problem, but when larger amounts flow into water bodies, they can change the water’s chemistry and kill native flora and fauna. When most products were made of wood, animal skins, and other organic materials that quickly decompose, land pollution was not an issue. However, with plastics and other synthetic materials, which take hundreds if not thousands of years to break down, impacts on the land can be substantial. For instance, animals are injured and killed when they consume these materials or get tangled in them and are unable to move. Likewise, synthetic chemicals that decompose slowly can accumulate in soils, making them toxic to humans who live or farm there. Because of the harm that pollution causes to humans and other life, many companies, institutions, and government agencies are working to reduce it and make our world a cleaner place to live.
Air pollution
Contaminated air can be one of the most visible types of pollution. It is often easy to see a brownish haze lying over cities, and peoples’ bodies can quickly react to high levels of air pollution, which causes itchy eyes, runny noses, and impaired breathing. Air pollution impacts a large segment of the world’s population. Each year, over 80 percent of people in urban areas are exposed to air pollution levels that exceed World Health Organization standards. This exposure causes a wide range of health problems, including an increased risk of stroke, heart disease, lung cancer, asthma, and more. More than three million people annually die prematurely from these causes. But the impact from air pollution is not spatially even. Low- and middle-income countries are disproportionately impacted: fully 98 percent of urban residents in those places are exposed to unhealthy air, while just 56 percent of urban residents in high-income countries are.
Sources of air pollution
Various contaminants contribute to air pollution. In the United States, six pollutants that can harm human health and the environment are regulated: ground-level ozone, particulate matter, carbon monoxide, lead, sulfur dioxide, and nitrogen dioxide. Many of these pollutants come from the burning of fossil fuels. Carbon monoxide comes largely from cars, trucks, and other vehicles and machinery, while nitrogen dioxide comes from these sources as well as from power plants. Sulfur dioxide comes primarily from power plants and other industrial facilities. Lead, on the other hand, comes from ore and metals processing, aircraft that use leaded fuel, waste incinerators, utilities, and lead-acid battery producers. Particulate matter consists of tiny particles that, when inhaled, can cause serious health problems. These particles can come from construction sites, fields, fires, and unpaved roads, but most are formed by chemical reactions of sulfur dioxide and nitrogen oxides. Ozone is not directly emitted from any source. Rather, it forms when nitrogen oxides react with volatile organic compounds. This process occurs when emissions from power plants, vehicles, and other industrial sources react in the presence of sunlight.
Temporal trends
As private motor vehicle use has diffused to a wider proportion of the world’s population and as manufacturing continues to use more energy and produce more goods, air pollution globally has increased. World Bank measurements of PM 2.5 ambient particulate matter (particles measuring less than 2.5 microns that can penetrate deep into the respiratory system and cause severe health damage) show that at the world scale, exposure levels increased by over 11 percent between 1990 and 2015. However, this increase was not spatially uniform (figure 12.2). By income, both low-income and high-income countries saw declines in air pollution exposure, while increases were found in the middle-income countries. Increases in middle-income countries are attributable to expanding manufacturing economies and growing wealth. As these countries develop, they shift from agricultural economies to typically dirtier industrial ones. At the same time, growing affluence means that more people can afford exhaust-spewing private vehicles (figure 12.3). With more factories, cars, and motorbikes in middle-income countries, air pollution levels rise. This can be seen in lower-middle-income Bangladesh, which saw a 40 percent increase in particulate matter air pollution between 1990 and 2015, the result of rapid expansion of the garment industry in recent years. And, of course, China, an upper-middle-income country, has gone through one of the most significant industrial transformations in the history of the world. As a result, its levels of air pollution increased by over 20 percent since 1990.

Figure 12.2.Particulate matter exposure, percentage of change, 1990 to 2015, by country income level. Data source: World Bank.
The picture is brighter for the high-income United States. Nationally, particulate matter (PM 2.5) levels fell by an impressive 42 percent between 2000 and 2016. Declines were found in all regions of the country, generally a positive sign of improving environmental quality. However, the greatest decline was found in the central part of the US, including states such as Ohio, Illinois, Indiana, and West Virginia. In this region, a decline in air pollution is likely tied to deindustrialization, meaning that cleaner air came at the expense of economic vitality and employment.
Nevertheless, the overall improvement in air quality is something to be celebrated. It may be hard to imagine, but notoriously polluted cities across the country once had even dirtier air. For example, Houston’s particulate matter declined 26 percent between 2000 and 2015. During the same time, Pittsburgh’s fell by 42 percent, while that of Cleveland and Los Angeles went down by 48 percent.

Figure 12.3.Traffic jam in Jakarta, Indonesia. Increasing private vehicle use in middle-income countries has contributed to worsening air pollution. Photo by AsiaTravel. Stock photo ID: 494677234. Shutterstock.com.
Spatial patterns
As of 2015, air pollution impacted those in middle-income countries to the greatest degree (figure 12.4). Levels of particulate matter in lower-middle-income countries was 3.4 times greater than in high-income ones, while upper-middle-income countries were 2.5 times larger. This can be seen in figure 12.5, where upper-income countries in North America, Western Europe, and parts of the Pacific have relatively low levels of particulate pollution. Higher levels of pollution are found in poorer regions, such as in much of Latin America and especially in parts of Africa, the Middle East, and Asia. As mentioned previously, many middle-income countries have seen substantial growth in industry and private vehicle use, which contributes to poor air quality. Another factor that needs to be highlighted in places that have not seen substantial manufacturing growth is dust from agricultural and pastoral uses. In places such as the Sahel region of sub-Saharan Africa, farming and grazing is replacing natural forests and grasslands. This leaves more soil exposed, which is picked up by wind and contributes to high levels of particulate pollution. In fact, dust kicked up by wind often creates massive sandstorms, some of which are so large they cross the Atlantic and impact air quality in the United States (figure 12.6).

Figure 12.4.Particulate matter exposure, 2015, by county income level. Data source: World Bank.
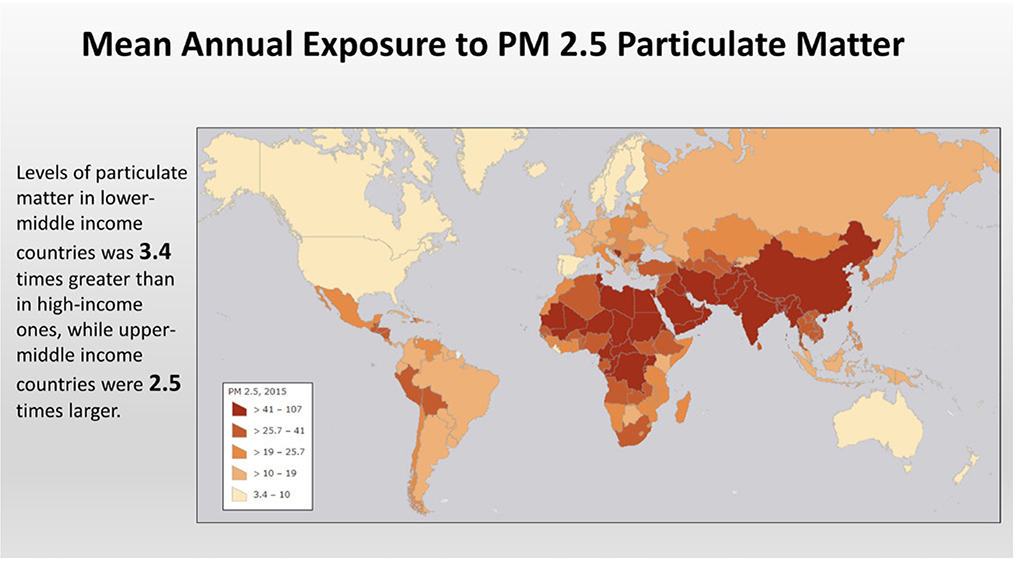
Figure 12.5.Mean annual exposure to PM 2.5 particulate matter, 2015. Explore this map at https://arcg.is/19LKvf. Data source: World Bank.
The World Health Organization recommends that annual mean levels of PM 2.5 particulate pollution fall at 10 μg/m3 (micrograms per cubic meter) or less. However, at a national scale, few countries meet this standard (figure 12.5). The United States and Canada, as well as a few European countries, Australia, New Zealand, and a handful of other small countries fell within these limits in 2015. Among the worst are oil-producing Qatar and Saudi Arabia, both with particulate levels over ten times the recommended maximum. The industrializing countries of South Asia exceed the level by over seven times, while manufacturing-heavy China exceeds the level by nearly six times.
Levels such as these have profound impacts on human health. Air pollution increases the risk of stroke and heart disease, contributes to pulmonary obstruction diseases and lung cancer, and causes respiratory infections in children. These conditions too often result in early death. Deaths from air pollution are less common in high-income countries and most prevalent in parts of Asia and Africa (figure 12.7). The lowest rates are found in Sweden, Australia, and New Zealand, where less than 1 death per 100,000 people is attributed to air pollution. In the United States, the rate is a relatively modest 7 deaths per 100,000. At the high end, however, rates are much greater. The highest rate is found in North Korea where well over 200 people per 100,000 die prematurely due to air pollution. North Korea has a substantial industrial sector but is technologically backward, resulting in very dirty factories as well as inadequate safety and health-care infrastructure. Other countries, such as India, China, and Afghanistan in Asia and much of West Africa have rates well over 100 deaths per 100,000. Notably, the Middle East, a place with relatively high levels of air pollution, has lower death rates than would be expected. It appears that the combination of exceedingly poor air quality along with inadequate health care leads to higher death rates.

Figure 12.6.Satellite image of a dust storm blowing off the northwest coast of Africa. Land degradation from farming and grazing leaves soils exposed and contributes to wind-blown particulate air pollution. Sometimes the quantities are so large that they impact air quality in North America. Image by NASA.
It should be noted that the death rates discussed here and shown in figure 12.7 are age-standardized. As you’ll recall from the chapter on population, death rates tend to be higher in places with more elderly and lower in places with more youth. For this reason, air pollution death rates between countries have been standardized to account for each country’s age structure. Using age standardization, rates for Sweden, with a larger elderly population, will not be misleadingly too high, and Afghanistan, with a larger youth population, will not misleadingly be too low.
While national-scale data helps illustrate global impacts of air pollution, there is great spatial variation within countries. Levels of pollution and health impacts depend on physical characteristics of the landscape, such as topography and weather, as well as proximity to sources of pollution. Places in valleys or largely enclosed by hills often trap contaminants, resulting in higher levels of air pollution than found in places with flat and open topography. Wind can contribute to cleaner air by dispersing it, while still weather conditions can allow contamination to accumulate, worsening air quality. Furthermore, places that lie downwind of pollution sources will have higher levels of pollution than those that are upwind. In the Los Angeles region, for instance, sea breezes typically push smog inland from the coasts, which then accumulates in cities at the base of the San Gabriel Mountains. Likewise, cities such as Mexico City and Santiago, Chile, both surrounded by mountains, have consistently poor air quality (figure 12.8).

Figure 12.7.Age-standardized mortality rate attributed to household and ambient air pollution (per 100, 000 population). Explore this map at https://arcg.is/19LKvf. Data source: World Health Organization.
Proximity to pollution sources also plays a powerful role in levels of air pollution and impacts on human health. Transportation routes and facilities are among the most severe producers of air pollution in many locales, increasing the risk of cancer and other cardiorespiratory illnesses. Health risks are substantial within 300 feet of a freeway but can still impact health within 1,000 feet and beyond, depending on wind patterns. The same holds true for truck-heavy distribution centers, rail yards, and port facilities. Oil refineries, power plants, and other industrial facilities are also important emitters of contaminants, leading to increased rates of health impacts for those living close to or downwind from these locations. Especially in terms of particulate matter, agricultural regions can have high levels of air pollution, even when industry and vehicle emissions are limited.

Figure 12.8.Smog against the Andes Mountains in Santiago, Chile. Air pollution is often more severe in places where mountains inhibit its dispersal. Photo by Alexmillos. Stock photo ID: 289832411. Shutterstock.com.
Solutions
Air pollution has increased globally alongside manufacturing, motor vehicle use, and removal of natural vegetation for farming and livestock, but within the United States and other upper-income countries, air quality has improved. This provides hope for people in poorer regions that face serious health impacts from contaminated air. Solutions exist, but they cost money and are unlikely to be implemented voluntarily, so government regulation is typically required.
Air pollution regulations gained traction in the 1940s and 1950s in North America and Europe, as manufacturing and automobile use was expanding rapidly. Myriad stories show the severity of the air pollution crisis, from a “gas attack” one summer day in 1943 when visibility in Los Angles was reduced to three blocks, leaving residents with stinging eyes and throat-scraping sensations, to London’s killer smog that took 4,000 lives in 1952. Regulations initially began at the local and state levels but ultimately were embraced on a national level, such as with the US Clean Air Act of 1970.
A wide range of rules have been implemented in upper-income countries to tackle air pollution, many of which have been resisted by those who see them as an inconvenience or as harming economic opportunity. At the household level, regular municipal trash service replaced backyard incineration of garbage. Other regulations on consumer products, such as paints and even barbecue starter liquids, have had positive impacts on air quality. Strict limits on burning coal and wood for heating homes have also been established in many cities. On farms, the use of “smudge pots,” where used motor oil and old tires are burned to prevent frost in orchards, has been eliminated.
With automobiles and other vehicles, a wide range of solutions have been implemented. For instance, in many US cities, sleeves on gas fuel pump nozzles prevent vapors from leaking into the air. Lead has been eliminated from gasoline, and reformulated fuels burn more cleanly. Catalytic converters on vehicles reduced tailpipe emissions substantially. With time, more electric vehicles will reduce emissions along roadways, but overall air quality will improve only if power plants produce electricity in a clean manner.
Factories and power plants have been required to meet emissions standards via better operations practices and clean-air technologies. Some fuels are cleaner than others; for example, natural gas is cleaner than coal. Smokestack emissions have been reduced when regulators require using what lawyers refer to as “best practicable technology” or “best available technology,” varying standards that account for economic and/or technological feasibility. Of course, technological solutions improve with time, meaning that legal definitions such as these can result in ongoing improvement of air quality.
One interesting solution to air pollution that gives companies flexibility in meeting standards is the use of pollution credits, or emissions trading. This works by setting emissions targets for industries, say, in terms of total output of sulfur dioxide and nitrogen oxide. Industries can install emissions-reducing technology to reach these goals, and if they exceed the goals, they can sell pollution credits to another facility that has not met the goals. By selling credits, a company can offset some of the cost of clean-air technology. At the same time, companies that do not meet standards can buy pollution credits. This may be more cost effective than installing new clean-air technologies, giving an important level of flexibility to some companies. The key to this type of program is that the total level of allowed emissions within a region is reduced each year. Air quality is thus improved but without rigidly regulating how much each individual company can emit per year.
Go to ArcGIS Online to complete exercise 12.1: “US air pollution: Where is it bad and where is it improving?” and exercise 12.2: “Air pollution exposure at a local scale.”
Water pollution
In 1969, the Cuyahoga River in Ohio caught fire. It was at least the ninth time in a century that the river was in flames, the result of industrial and domestic waste from steel mills, chemical plants, and sewage discharges. While damage from the fire was less than in previous ones—a 1912 fire killed five dockworkers, and a 1952 fire caused millions of dollars in damages—this one was caught on film and broadcast on national television. Shock from these images helped lead to the formation of the US Environmental Protection Agency in 1970 and the federal Clean Water Act in 1972. As with air pollution, by the 1960s, Americans were calling for laws to regulate and control contaminants that were poisoning water for both humans and ecosystems. Great gains have been made in much of the developed world since then, but water pollution continues to negatively impact lakes, rivers, and oceans. And as with other types of pollution, contaminated water in developing countries poses an even greater threat to human health and ecosystems.
Sources of water pollution
Water pollution comes from five major sources: agriculture, industry and energy production, mining, water-system infrastructure, and human waste. Agricultural production employs large amounts of inputs, such as nitrogen and phosphate fertilizers and pesticides. These chemicals seep into groundwater and run off into water bodies, causing a wide range of impacts to ecosystems. For instance, nitrogen and phosphorus feed algae, which can overtake native plants and deplete dissolved oxygen used by fish. Agricultural runoff can also increase the salinity of water as high-salt soils erode and wash into rivers, streams, and lakes. Runoff of this type also can increase sediment loads in water, harming fish, plants, and other aquatic life.
Factories and power plants are other significant sources of water pollution (figure 12.9). Discharge from these sources often includes toxic metals, such as lead and mercury; toxic chemicals, including solvents, pesticides, and asbestos; phosphorus and nitrogen nutrients; and suspended matters, including particulates and sediments. All of these pollutants, when discharged in sufficient quantities, can harm wildlife and contaminate water used by humans for drinking, bathing, and other purposes. In addition, water is sometimes used by industrial facilities and power plants for cooling purposes. During this process, heat is transferred from the facility to the water, which is then discharged with a temperature well above the ambient temperature of the water body, harming aquatic life.

Figure 12.9.Industrial water discharge pipe in Antwerp, Belgium. Photo by IndustryAndTravel. Stock photo ID: 367273355. Shutterstock.com.
Mine runoff is another source of water pollution. As rocks and minerals are extracted from mines, toxic compounds such as lead, copper, arsenic, and zinc, as well as sulfur, can leach into nearby water bodies and subsurface groundwater. The mining process also uses mercury and other toxic chemicals to extract minerals, which can further contaminate water when it escapes from the mine site. As with agriculture, erosion and sedimentation from mines also cause ecological damage.
A less commonly known source of water pollution comes from water-system infrastructures, such as dam construction and irrigation systems. In the case of dams, natural water flows are altered. This can lead to changes in sedimentation flows, which prevent the natural movement of nutrients downstream. Altered water flow patterns also impact fish and other native life that thrive in fluctuating river flows. Likewise, irrigation systems draw water from natural water bodies for use on farms. This can substantially reduce the quantity of water that flows downstream, reducing plant and animal life.
Lastly, an important source of water pollution comes from human waste. Globally, over 80 percent of wastewater is discharged without treatment. However, there is wide variation between upper- and lower-income countries. In high-income countries, roughly 70 percent of municipal and industrial wastewater is treated, but this figure falls to just 8 percent in low-income countries. Meanwhile, over 2.4 billion people do not have access to improved sanitation, while one billion practice open defecation. This means that in some places, human feces can flow directly into surface and groundwater.
Temporal trends
Global datasets for water quality over time are limited, making general conclusions about water pollution trends more difficult than for air pollution. Nevertheless, temporal trends appear to reflect those seen with air quality: some improved water quality in the developed world and declining quality in much of the developing world.
Nutrient loads of nitrogen and phosphates have increased globally, promoting the growth of oxygen-depleting algae that damage fisheries and other ocean and fresh water ecosystems. For example, in the case of coastal areas, the number of “dead zones,” places with oxygen levels that no longer support most marine life, roughly doubled each decade between 1910 and 2010. These are mostly found at river mouths, where agricultural runoff from upstream accumulates and suffocates marine life.
In addition to nitrates, which come largely from agriculture, industrial and mining activity discharges myriad toxic compounds. In recent decades, as manufacturing shifted from developed countries, which often have stricter environmental controls, to developing countries with weaker controls, water pollution has become of greater concern. In China, over 80 percent of water wells in parts of the country are unfit for drinking or bathing due to industrial and agricultural contamination. Because of this, many cities must draw water from groundwater reservoirs hundreds or thousands of feet below the surface, where toxic contaminants have not yet percolated. China’s massive industrialization during the past few decades makes it an extreme case, but similar patterns can be found in other less-developed manufacturing countries as well.
The greatest threat to water quality and human health in developing countries comes from untreated human waste and wastewater. As developing countries continue to urbanize, human waste is increasingly concentrated in densely populated areas. Given that over 80 percent of wastewater goes untreated, the volume of sewage discharged into rivers, lakes, and oceans has increased in many places, threatening water supplies and making many places unfit for swimming or bathing.
In contrast, evidence shows that in the developed world, some types of water quality have improved. In the affluent European countries of the Netherlands, Belgium, and Denmark, for example, nitrogen balances per hectare of agricultural land fell substantially between 1990 and 2004. Likewise, environmental regulations in the United States, including the Clean Water Act, have greatly improved water quality in some areas. Toxic components such as mercury, lead, DDT, and PCBs all saw declines since the 1970s, although the rate of decline has slowed in recent years. Certain pesticides found in water bodies have fallen as well due to government restrictions and/or better agricultural management techniques. Household wastewater, one of the greatest threats to human health, is nearly universally treated in the most affluent countries today. In Canada, for instance, about 60 percent of the population was connected to wastewater treatment facilities in 1990, but by 2010, it had risen to around 85 percent. The United States has improved as well, but to a lesser degree, reaching 75 percent coverage by 2012. Affluent countries in Europe have even higher rates of treated sewer connections: over 95 percent in Germany and Spain and over 80 percent in France, to name a few.
With nutrient loads of nitrogen and phosphates, progress is more limited. For instance, 30 percent of agricultural streams in the United States still contain nitrogen levels higher than those recommended by the EPA for human consumption. Likewise, nitrate transport downriver to the Gulf of Mexico was 10 percent higher in 2008 than in 1980. Part of the reason for less progress in this area is that early pollution controls focused more on point-source pollution rather than on nonpoint-source pollution. Point-source pollution controls regulate discharges from fixed locations, such as drainage pipes at factories and power plants. Nonpoint-source pollution comes from dispersed locations, such as agricultural and urban runoff. More recent regulations are tackling nonpoint-source pollution, but major gains are yet to be seen.
Spatial trends
Flaming rivers and toxic plumes of chemical effluent tend to grab the headlines and can be of concern in localized areas, but the greatest waterborne threat to human health comes from untreated human waste. Fecal contamination of water sources comes from both open defecation (no latrine) and untreated sewage wastewater. Rainwater runoff washes fecal material from open defecation into rivers and lakes, while much untreated sewage is discharged directly into water bodies. This pollutes water with pathogens that cause serious diseases such as diarrhea, cholera, trachoma, and schistosomiasis. It is estimated that over two million people die annually from diarrhea alone, three-quarters of whom are children under the age of five.
Globally, the largest number of people using open defecation is in India, where over 500 million people lack access to toilet facilities. Other countries in Asia with large numbers include Indonesia, Pakistan, Nepal, China, and Cambodia. In sub-Saharan Africa, the other region with substantial numbers, Ethiopia, Nigeria, Sudan, Niger, Burkina Faso, and Mozambique stand out. Figure 12.10 shows the percentage of people with access to improved sanitation facilities in 2012. Regionally, sub-Saharan Africa has the lowest proportion, followed by South Asia. For instance, only 10 percent or less of the populations of South Sudan and Niger have access, while in India, about 40 percent do. Rates are relatively high in Latin America and the Caribbean, but there is substantial variation. In Argentina and Chile, nearly all of the population has improved sanitation, but just over one-quarter of the population has access in Haiti, while less than half does in Bolivia. In upper-income regions of North America and the European Union zone, on the other hand, around 99 percent of the population has access to improved sanitation.
Access to improved sanitation has a clear spatial relationship with mortality from exposure to unsafe water. In figure 12.11, it is clear that sub-Saharan Africa and South Asia are the epicenter of waterborne disease deaths, along with Haiti in the Western Hemisphere. In India, a person is over forty-five times more likely to die from waterborne disease than in the United States or Canada. This number rises to a shocking 170 times greater risk in countries such as Central African Republic, the Democratic Republic of the Congo, and Angola.
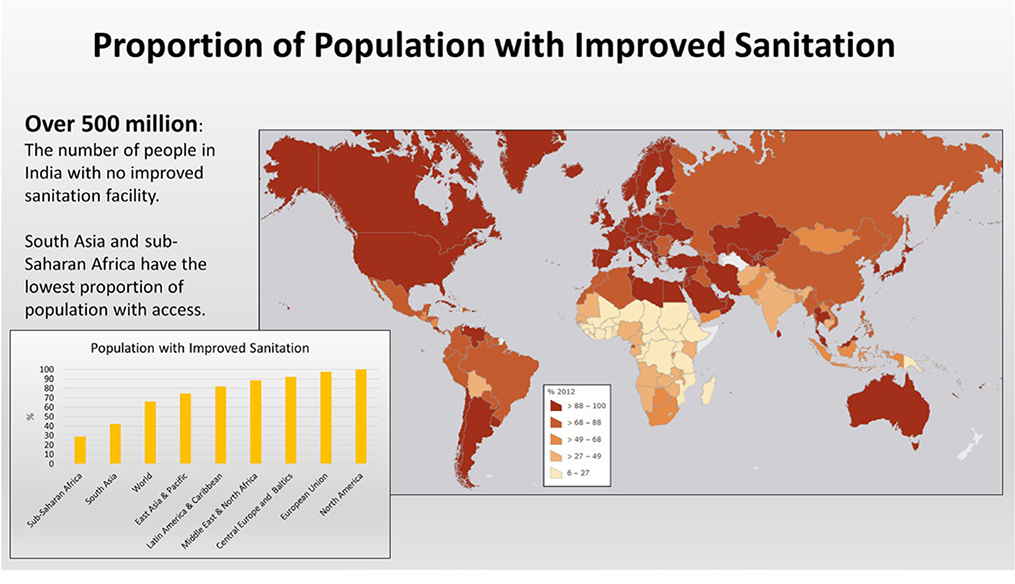
Figure 12.10.Population with improved sanitation. Explore this map at https://arcg.is/1GbLT9. Data source: World Health Organization.
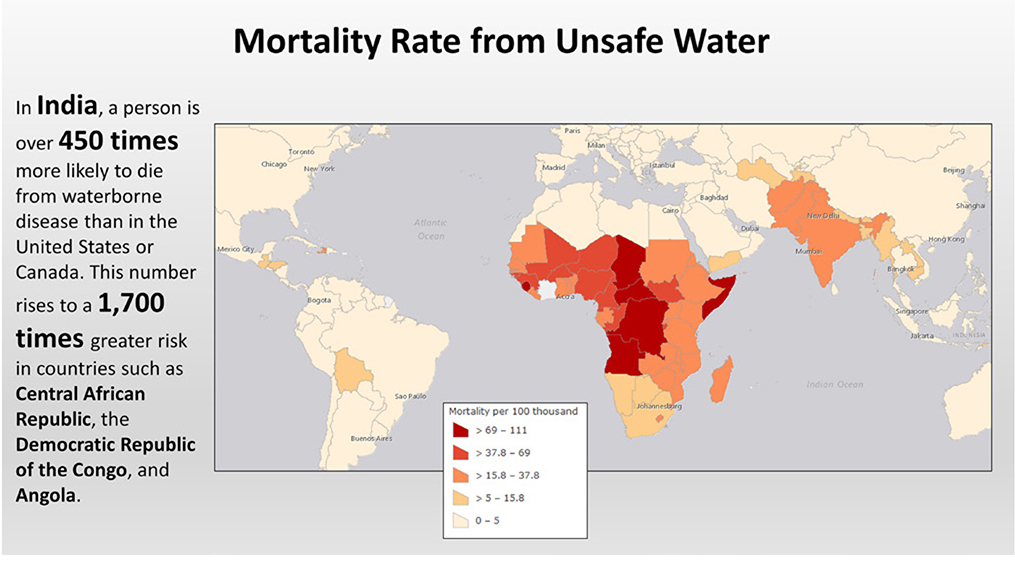
Figure 12.11.Mortality rates from unsafe water. Explore this map at https://arcg.is/1GbLT9. Data source: United Nations.
Solutions
Solutions to water pollution vary by type and level of available technology. Point-source pollution in upper-income countries has been reduced substantially through government-established standards and implementation of filters on effluent. For instance, in the United States, the Clean Water Act established the National Pollutant Discharge Elimination System (NPDES), which requires permits to discharge sewer, chemical and biological wastes, radioactive materials, solid waste, and other pollutants into water bodies. In developing countries, this type of control is less common, as the costs of technology, as well as political will and effective enforcement of regulations, is more limited.
Nonpoint-source pollution is less well controlled in both developed and developing countries. Reducing runoff from agriculture and livestock land can be accomplished in different ways. With geospatial technologies such as remote sensing, farmers can now map fertilizer requirements with great detail, allowing them to use just the right amount of fertilizer on individual patches of land. Less fertilizer use means less runoff into nearby water bodies. Other solutions include planting certain cover crops that recycle excess nitrogen from the soil; planting buffers of trees, shrubs, or grasses around fields to absorb runoff; managing drainage; and reducing field tillage. In the case of urban runoff, rains wash oil, animal waste, and garbage into storm drains. Often, these drains are not connected to municipal wastewater treatment plants and instead run directly into lakes, rivers, and oceans. Connecting storm drains to treatment facilities can help reduce this type of nonpoint-source pollution.
Managing human waste, the deadliest of all water pollutants, has been largely accomplished in upper-income countries, but costs and even culture have made progress much slower in developing ones. Construction of toilet facilities, sewerage systems, and treatment plants is prohibitively expensive for many poor countries, resulting in only a small proportion of waste being properly treated. But culture, surprisingly, can also inhibit the use of proper toilet facilities. In India, many rural residents view open-defecation as healthy and convenient, so much so that in rural areas, 40 percent of households with a working toilet had at least one resident who did not use it. The government has set out to build over 100 million new toilets in rural India, but problems persist: they are often used as storage rooms once they are built and government workers leave. Without a concerted education campaign on the health benefits of toilets, construction alone is unlikely to be effective.
Despite financial and cultural challenges, human waste treatment is being approached in innovative ways. Toilets connected to expensive municipal sewerage systems and treatment plants are not the only solution. Lower-cost pit latrines and compost systems can also be effective. In Bolivia, feces is collected from dry toilets and then composted with worms and converted into fertilizer for use on potato fields. In Tanzania, private collectors pump waste from latrine pits and haul it to municipal treatment facilities, eliminating the need for costly sewerage systems. As long as human waste is properly contained, transported, and treated, it does not matter if it is done through a modern sewerage and treatment facility or a simpler pit and compost system.
Go to ArcGIS Online to complete exercise 12.3: “Water pollution: Sanitation facilities and human health.”
Land/solid waste pollution
In the late 1970s, President Jimmy Carter declared environmental emergencies at Love Canal in Niagara Falls, New York. At this location, a school and hundreds of homes had been built directly on top of a landfill where Hooker Chemicals and Plastics Corporation (now Occidental Chemical Corporation) had disposed of over 21,000 tons of hazardous chemicals from 1942 to 1953. As a result, by the 1970s, residents were reporting chemical residues, foul odors, and increased rates of cancer and other health problems. Ultimately, nearly 1,000 families were evacuated from the site, and partially as a result, in 1980, the US government passed what is commonly known as the Superfund law (Comprehensive Environmental Response, Compensation, and Liability Act [CERCLA]).

Figure 12.12.Informational poster for World Toilet Day. The United Nations runs this campaign to promote the healthy disposal of human waste. Image from United Nations.
But hazards do not come only from buried waste materials. In 2017 alone, massive garbage refuse dumps have caught fire and collapsed onto surrounding homes, killing hundreds in Sri Lanka, Ethiopia, and the Philippines. These tragedies resulted from developing countries’ inability to safely dispose of growing urban waste combined with housing shortages that result in squatter settlements on undesirable land.
As with air and water pollution, land pollution can cause serious health impacts and negatively impact ecosystems from improper disposal of solid waste materials. Various types of filters in factories, water sanitation facilities, and power plants help keep contaminants from being discharged into the air and water, but ultimately, the filtered material must be disposed of somewhere. The same is true for solid waste material from households, construction sites, and manufacturing plants. In poor countries, much waste is dumped randomly in gullies, ditches, and water bodies, where it contributes to human health problems and harms wildlife. As countries develop, more waste is collected by municipal governments. This material typically ends up in open dumps, sanitary landfills, and hazardous waste disposal facilities, with varying levels of environmental protection.
Sources of solid waste
Solid waste comes from a variety of sources. We are all aware of our own solid waste production through residential disposal of paper, cardboard, plastics, paints, electronics, and other items. Then there is industrial solid waste from manufacturing and power plants, such as packaging and food waste, hazardous chemical wastes, and ashes. Commercial and institutional waste from businesses, schools, hospitals, and government buildings includes additional plastics, paper, glass, metals, biohazard waste, and e-waste. Construction and demolition waste from development sites includes wood, steel, concrete, dirt, bricks, and other such material. Municipal services from street cleaning, landscaping, and wastewater treatment facilities results in waste such as plant and tree trimmings and solid sewage sludge.
Temporal trends
Solid waste production has increased with population, urbanization, and economic development. More people obviously means more consumption of goods and greater use of sanitary facilities. But even more important than the number of people is where they live and how affluent they are. Urban residents tend to be wealthier than their rural counterparts. They purchase more goods and dispose of more paper, plastics, glass, and other materials. In fact, urban residents produce about twice as much waste as rural ones. Likewise, as countries develop economically, people consume more. Increased affluence leads to more electronic goods, more prepackaged foods, more clothing and household goods, and so on. As the world becomes even more urban and affluent, the production of solid waste is likely to increase. Currently, about 1.3 billion tons of municipal solid waste are created each year, but this is likely to increase to 2.2 billion tons by 2025.
The silver lining to this trend is that upper-income countries tend to recycle more and use more efficient production techniques that can minimize solid waste leftovers. This can partially offset increases in waste production. However, many countries have yet to pass through middle-income levels, and recycling is not at the point where it replaces most solid waste.
Spatial trends
By region, the greatest amount of waste is produced by the mostly rich countries of the OECD (Organization for Economic Co-operation and Development), which includes most of Western Europe, the United States and Canada, Australia and New Zealand, Japan and South Korea, Chile and Mexico, among others (table 12.1). These countries produce twice as much waste per capita as middle-income regions in Eastern and Central Asia, Latin America, and the Middle East. At the low end are poorer regions, such as sub-Saharan Africa and South Asia. These countries produce roughly one-quarter the amount of waste per capita as the OECD countries.

Table 12.1.Solid waste production by region. Kilograms per capita per day. Data source: World Bank.
In terms of pollution, collection rates are possibly more important than the amount of waste produced. High-income countries collect roughly 98 percent of municipal solid waste, using methods that are mechanized, efficient, and frequent. Waste is typically left in containers that can be quickly and easily picked up by refuse collection trucks at least weekly. In contrast, low-income countries collect about 41 percent of waste. Even this smaller amount can consume a large portion of a municipal budget, as waste is placed curbside in small bags that are easily ripped open and scattered by dogs and informal recycling-waste pickers (figure 12.13). As would be expected, countries of the OECD collect the most waste, while those of South Asia and sub-Saharan Africa collect the least. Uncollected waste presents risks to health, spreading pathogens and increasing disease-carrying rodent and insect populations. It can also clog drainage systems, increasing contact between people and polluted rain runoff.

Figure 12.13.Uncollected garbage in Harare, Zimbabwe. Over half of solid waste goes uncollected in low-income regions, posing threats to human health and wildlife. Photo by Cecil Bo Dzwowa. Stock photo ID: 752490544. Shutterstock.com.
After collection, methods of disposal determine the degree of contamination and health impacts caused by solid waste. At the lowest level are semi-controlled or controlled open dumps. These consist of land set aside for the placement of solid waste, which have limited to no controls on leachate contamination, toxic dust, or vermin. While this type of disposal is uncommon in high-income regions, up to one-third of waste can end up in these in low- and middle-income regions. Nearby residents are exposed to contaminated air and water as well as diseases carried by insects and animals that feed in the dump. Health impacts can be especially dire for informal workers, some of whom live at the dump, who pick through the waste in search of materials to reuse or recycle (figure 12.14).

Figure 12.14.Catadores (rubbish pickers) at an open dump in Rio de Janeiro, Brazil. In many developing countries, poor residents make a living by picking through waste from their more affluent compatriots. Photo by A. Paes. Stock photo ID: 755069146. Shutterstock.com.
The next level of waste disposal facilities includes controlled landfills. Landfills differ from open dumps in that they include liners that contain leachate and remove at least some for treatment. They also get compacted by heavy machinery and are covered daily with soil to control toxic dust. Moving up to an even higher level of disposal are sanitary landfills. These are the most well designed, containing and treating nearly all leachate, thus posing minimal risk to air, water, and nearby residents. Some sanitary landfills are designed specifically for hazardous waste, and they include double liners and more stringent monitoring and controls. In high-income regions, the single largest destination for solid waste is to controlled or sanitary landfills.
Solutions
Contamination from solid waste disposal in the developed world no longer poses the risk it once did, but improper disposal is the norm in many lower-income countries. The obvious solution for lower-income countries is to improve collection and to build more controlled landfills (figure 12.15). This can be a challenge, however, since municipal funds are limited and collection alone can consume 80 to 90 percent of a city’s solid waste budget.

Figure 12.15.Sanitary landfill in Turin, Italy. Sanitary landfills include liners to prevent leachate contamination of water and are capped with soil daily to prevent toxic dust dispersion. Photo by Mike Dotta. Stock photo ID: 409903858. Shutterstock.com.
Another solution, for both rich and poor countries, is to reduce, reuse, and recycle, so that less material needs to be disposed of in the first place. Many high-income countries recycle 20 percent of their solid waste, with Singapore recycling fully 60 percent of its waste. The European Union, in 2010, recycled 35 percent of household waste, with a mandated target of 50 percent by 2020. In low- and middle-income countries, data is limited, since most recycling is done by informal waste pickers on streets and in dumps, making estimates difficult to calculate.
The reuse of goods is likely more common in lower-income countries, where limited incomes prevent people from buying and discarding goods at the same rates as in upper-income countries. Aside from lowering incomes, improving reuse rates requires a change in cultural attitudes to make it more acceptable to buy used clothing and to purchase durable items rather than disposable ones. Metal silverware instead of plastic at work, reusable water bottles instead of disposable plastic, refurbished electronics over new ones—these and similar measures can help to limit the production of solid waste.
Recycling and reuse help to reduce the amount of goods purchased and disposed of in the first place. Reduction can also be achieved in manufacturing and shipping of goods through more efficient processes that use fewer raw materials and create less waste material, reduce packaging, and so on.
Where contamination has already occurred, land can be cleaned and rehabilitated. The Superfund program in the United States, spurred by the tragedy in Love Canal, forces the parties responsible for contamination to either clean up sites or reimburse the government for cleanup work done by the Environmental Protection Agency. Under this program, over 390 sites have been cleaned and removed from the Superfund list; however, over 1,300 sites remain (figure 12.16). Obviously, much more work needs to be done, but cleanup can take years and even decades. In fact, dozens of sites on the Superfund National Priorities list were identified in the early 1980s.
Go to ArcGIS Online to complete exercise 12.4: “Land pollution: Superfund sites.”
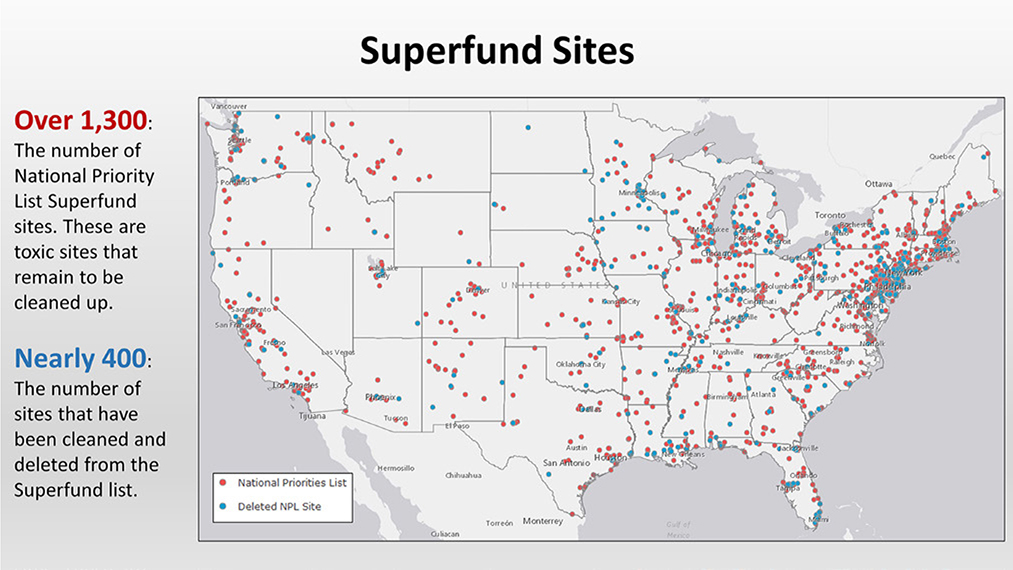
Figure 12.16.Superfund sites. Explore this map at https://arcg.is/1Gymay. Data source: US EPA.
Climate change
A winter blizzard buries the northeastern United States with record snowfall, hurricanes strike the Gulf Coast and cause millions of dollars in flood damage, and the western United States sees the driest year on record. People often use cases such as these to support or deny the existence of climate change, specifically, the phenomena of a warming planet. But that is to confuse weather with climate. Weather describes short-term behavior of the atmosphere, while climate reflects long-term patterns. To use a probably imprecise analogy, weather is like your mood and climate is like your personality. And just as one’s personality tends to change over time, all evidence is that the earth’s climate is changing as well. However, it is impossible to say any single weather event, such as a large snowstorm, hurricane, or drought, is due to a changing climate. Throughout history, there have been extreme weather events, even before evidence of warming. What climate change does is increase the probability of these events. Another analogy relates to baseball. If a player using steroids hits a home run, did the steroids cause the home run? Most likely, the player hit home runs even before taking steroids. But what steroids do is increase the probability of hitting a home run. The same goes for climate change. A single category 5 hurricane may or may not be due to climate change. But what is certain is that climate change increases the probability of category 5 hurricanes.
Evidence of global warming
The scientific consensus is that the earth’s climate is changing: it is warming and the warming is primarily due to human activity. The cause is a rapidly increasing level of carbon dioxide and other gases in the earth’s atmosphere, the result of the burning of fossil fuels, as well as the clearing of land for agriculture (figure 12.17). These gases occur naturally and, by trapping some of the sun’s energy, are what allow life to thrive on our planet. However, human burning of fossil fuels is increasing greenhouse gases significantly, causing more of the sun’s energy to be trapped and warming the earth beyond historic norms.

Figure 12.17.The greenhouse effect and climate change. The earth’s natural greenhouse gases trap some of the sun’s energy and keep the planet warm, allowing life to thrive (1). Human burning of fossil fuels is increasing greenhouse gases, causing more of the sun’s energy to be trapped, warming the earth beyond historic norms (2). Image by Designua. Stock vector ID: 527285524. Shutterstock.com.
Ice core data combined with more recent atmospheric measurements illustrate how carbon dioxide (CO2) levels have risen dramatically in recent time. For over 400,000 years, CO2 levels rose and fell but never below 300 parts per million (figure 12.18). Since the advent of the Industrial Revolution, however, carbon dioxide levels have accumulated rapidly, rising by one-third and passing 400 parts per million by 2017. These levels are unprecedented and are contributing to dramatic changes in the earth’s climate.
NASA presents a series of datasets that illustrate how CO2 is changing our planet. As atmospheric CO2 has risen, so too have global temperatures. Figure 12.19 illustrates how temperature has changed compared to the 1951−80 mean. The long-term trend is upward, but the greatest increase has occurred in the last thirty-five to forty years. In fact, sixteen of the seventeen warmest years from the past century have occurred since 2001.
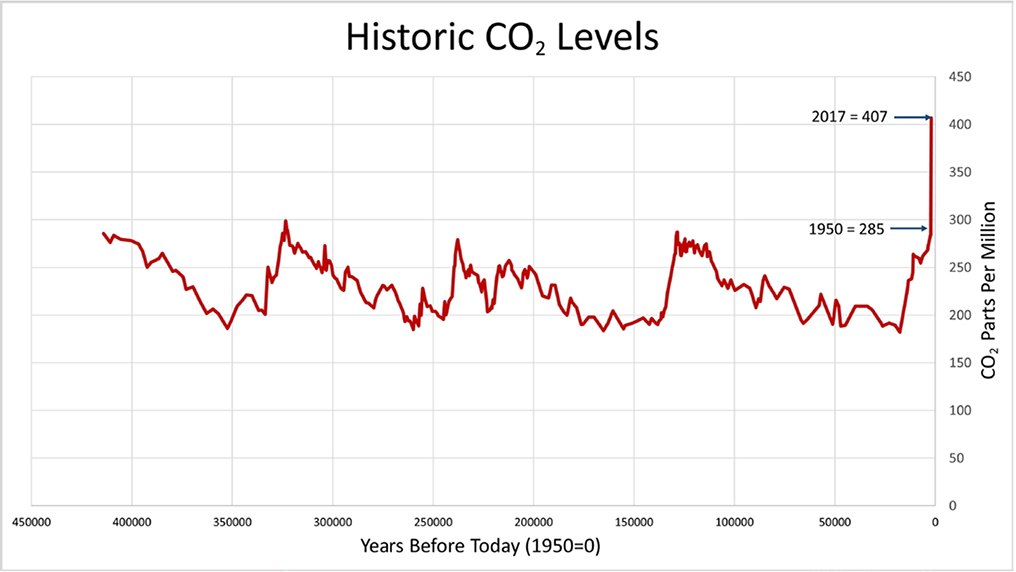
Figure 12.18.Historic CO2 levels. Data sources: Petit, J.R., et al., 2001; Tans and Keeling, 2018.
Some argue that this warming is due more to natural solar irradiance than to human-induced increases in greenhouse gases. This theory is plausible, but the evidence shows that solar irradiance is not a significant contributor. Since the mid-1700s, energy from the sun has been constant or has increased only slightly. If it was indeed a contributing factor, temperatures would rise in all layers of the atmosphere. However, only surface layers of the atmosphere are warming, where greenhouse gases trap heat, while upper layers have actually cooled. Furthermore, climate models cannot account for the level of heating we are seeing with solar irradiance alone. Only by including greenhouse gases can the changes be accounted for.
This warming is causing significant declines in polar ice cover. Arctic sea ice cover in September, which is the month that it reaches minimum extent, has been steadily declining since measurements in the late 1970s (figures 12.20 and 12.21). The same pattern is seen with Antarctic ice (figure 12.22).

Figure 12.19.Temperature difference from mean. Solid line represents five-year moving average. Data source: NASA/GISS.
Because of greenhouse gas buildup, warming temperatures, and melting polar ice, sea level has been rising. It occurs as millions of square miles of polar ice melt and return to the sea and through the expansion of sea water as it warms. Satellite measures since 1993 show that the global mean sea level has risen by roughly eighty millimeters, or a little over three inches (figure 12.23). Coastal tide gauge measurements from the 1880s indicated that sea level has risen eight inches since then.
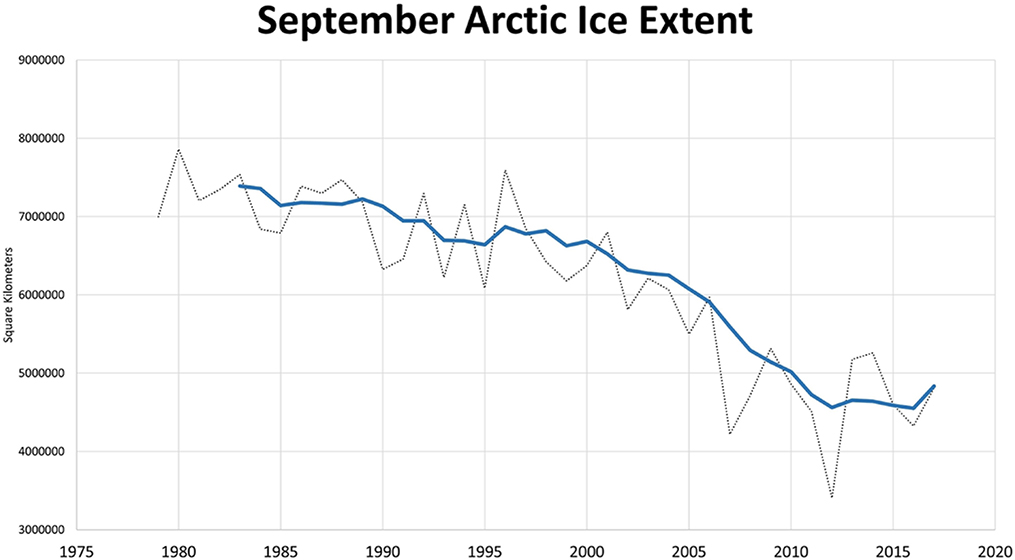
Figure 12.20.September Arctic ice extent. Data sources: NASA and National Snow and Ice Data Center.

Figure 12.21.Arctic September sea ice coverage: 1984 and 2012. Image source: NASA Scientific Visualization Studio.

Figure 12.22.Antarctic ice mass: Change from 2002. Data source: NASA.

Figure 12.23.Global mean sea level increase: 1993–2017. Data source: NASA.
Effects
Temperature, precipitation, and extreme weather
Climate change impacts many aspects of life on earth. Temperatures are expected to continue rising as human-produced greenhouse gases continue to be emitted. With rising temperatures, heat waves will become more common. Already, multi-month extreme heat has been on the rise since reliable records began in 1895. Furthermore, extreme heat days that occurred once every twenty years are projected to occur once every two to three years in much of the United States.
Precipitation will be altered as well, with many wet places getting wetter and many dry places getting drier. Generally, much of the North and Northeast regions of the US will see more precipitation, while the Southwest will see less. As another example, in Africa, countries along the already dry Mediterranean will likely see less precipitation, while tropical regions along the equator will see more. In drier regions, increasing heat and lack of precipitation will contribute to a greater frequency and intensity of wildfires. Extreme storms with heavy downpours will become more frequent as well, as warm air holds more water vapor than cooler air. These downpours will cause more flood events. Heavy precipitation and flooding will also become more common in areas at risk of hurricanes. Already since the 1980s, there has been a substantial increase in intensity, frequency, and duration of hurricanes in the Atlantic, the result of warming ocean waters.
Impacts on people, cities, and economies
Changes in temperature and precipitation will impact many aspects of human society, including numerous themes covered in this book. Air pollution is likely to increase along with climate change. Increasing numbers of hot, sunny days will contribute to greater ground-level ozone pollution, while wildfires and dust will add to particulate pollution. Health impacts from dirty air will be compounded by extreme heat days that contribute to deaths and hospitalizations from heat stroke and related conditions. Water pollution increases with flooding, whereby pathogens are picked up by floodwaters and carried into contact with people on streets and sidewalks and in homes, schools, and businesses.
As you’ll recall, humans are now an urban species, with over 50 percent of all people living in cities and towns. Yet most urban settlements, along with their manufacturing and service sector economies, have been built under climatic conditions of a cooler world. Increasing temperatures will put pressure on electrical grids as they struggle to power a greater number of air conditioners for a greater number of hours. Extreme downpours from heavy storms can bring down power lines and cut off electricity. Likewise, flooding threatens myriad infrastructure systems. Rising water from heavy downpours, hurricanes, and storm surges enhanced by rising sea levels can swamp highways and subways, overflow sewerage systems, and short-circuit electrical systems running everything from apartment and office building elevators to factory and oil refinery installations.
Many argue that Hurricane Sandy, which struck the New York metropolitan region in 2012, was just a sample of what is to come for many coastal urban areas. During that event, 100 people died in the metropolitan region as fourteen-foot storm surges swamped homes and businesses. Flooding and wind cut electricity to 8.5 million customers, leaving many Manhattanites in high-rise buildings without heat or light and unable to get out by elevator. Subway tunnels flooded, and tens of thousands of people were displaced from their homes.
As seen with New York’s subways, urban transportation infrastructure is also at risk from climate change (figure 12.24). Fuel supplies are threatened from flooding and storm events that damage refineries and distribution networks; bridges and roads can be destroyed by heavy flooding; and coastal ports, highways, and airports can be swamped by rising sea levels and storm surges. Incredibly, heat waves are also preventing commercial airliners from taking off. In Phoenix, Arizona, temperatures close to 120 degrees heat the air to a point where its density is too low for airplanes to get lift. Late-afternoon flights have been canceled and rescheduled for times when the temperature is lower. As global temperatures rise, this problem will affect airports in regions with extreme heat ever more frequently.

Figure 12.24.Flooded underpass from Hurricane Sandy in New York. Photo by Kobby Dagan. Stock photo ID: 117337669. Shutterstock.com.
Outside of crops grown in greenhouses, the spatial distribution of agriculture is highly dependent on climate. Changes in climate will substantially impact the type and quantity of crops and livestock produced around the world. With greater variation in temperature and precipitation, through heat waves, drought, floods, and other extreme events, agricultural output is likely to become much more unpredictable. Year-to-year variations will increase, with good output some in seasons and poor output in others. This will make food prices more volatile, putting low-income consumers at risk when agricultural production falls and prices rise. Warmer temperatures will also increase the prevalence of weeds, insects, and plant diseases, requiring greater use of pesticides and herbicides to keep them under control.
Agricultural impacts will vary by region. In North America, yields may increase in northern regions, but overall agricultural output is expected to decline by midcentury. For instance, in the West and Southwest, an increase in the number of dry days will reduce crop and livestock production. A lack of chilling will also negatively impact fruit and nut trees, an important source of California’s agricultural economy, as well as plum and cherry trees in the Northeast.
In Africa, a similar pattern is likely. Overall production of key crops such as cereals will fall, although specific regions may see some increases in crop yields (figure 12.25). Heat will also increase food spoilage, given that proper transportation and refrigeration technology is more limited than in richer regions. In Asia, rice production, the key staple for the region, is likely to decline, but wheat production could increase in Pakistan. Projections for Latin American agriculture are mixed. Southeastern regions of South America, such as southern Brazil, Uruguay, and Argentina, could see warmer and wetter conditions that improve production, while wider variation in precipitation in Central America will likely harm key crops such as coffee and maize.
Political instability, conflict, and migration
In terms of political instability and conflict, some argue that climate change increases violence and threatens the stability of states. As the climate changes, existing societal organization becomes stressed. This becomes evident when cities and other human settlements, as well as agricultural, manufacturing, and service economies, face warmer temperatures, shifting patterns of precipitation, greater volatility in storm activity, and rising seas. What once worked well may no longer function, while mismanagement of resources can become quickly unmasked.

Figure 12.25.Outside Koulomboutej village, Niger. Agriculture will become more difficult in arid landscapes such as the Sahel region, which crosses Africa south of the Saharan desert. Photo by Giulio Napolitano. Stock photo ID: 158008097. Shutterstock.com.
For instance, in the dry Sahel region of Africa, there may be more ethnic conflict as rainfall variability forces a switch from mixed-crop farming to livestock ranching and a concomitant increase in struggles for grazing land. In North Africa, Syria and Egypt have already seen climate-induced conflict. Syria once prided itself for its production of wheat and cotton, but declining winter precipitation led to its worst-ever drought from 2007 to 2010. Combined with inefficient agricultural practices, this led to agricultural and pastoral devastation and the displacement of almost two million people. This occurred even before Syria’s bloody civil war. Egypt, on the other hand, has always been extremely dependent on wheat imports to feed its population. When drought and heatwaves struck Russia and China in 2010−11, limited supplies of imported wheat drove prices of bread in Egypt up by 300 percent. Food riots resulted, contributing to anger against the leadership of now-deposed president Hosni Mubarak. In the South China Sea, warming waters are shifting fish populations to new areas farther north. This is disrupting important fishing grounds for countries such as Vietnam and the Philippines and contributing to tension over China’s claims to much of the sea. Throughout the world, changes such as these are contributing to instability and conflict and are likely to accelerate as climate further changes.
As has happened throughout history, when stresses become too great in a place, people seek lives in new locations. Climate change is likely to increase push forces to migrate, as economic livelihoods and settlements become unsustainable. This will be felt more strongly in developing countries, where resources to mitigate impacts, be they sea walls or irrigation systems, are financially out of reach. Migration flows will lead to urban areas, as people flee unsustainable rural communities where agriculture has declined, and from vulnerable cities prone to flooding. Receiving cities will struggle in both the developed and developing world to absorb large migrant flows from what some are referring to as climate refugees.
Broadly, there are three types of areas most at risk. First are dryland regions with variable precipitation. These are places where water for agriculture and human consumption is already scarce. As these places become even drier, with longer periods of drought and intermittent downpours and flooding, hundreds of millions of people will face pressure to migrate. Africa’s Mediterranean north and Sahel regions, as well as dry regions of northern India and southeast Pakistan, western China, coastal Peru, and others, will likely see climate-driven pressures to migrate.
The second type of region most at risk includes heavily populated low-lying coasts in areas of tropical cyclones. Over 200,000 people fled New Orleans after category 5 Hurricane Katrina in 2005, while the number of Honduran migrants caught at the US border rose significantly after Hurricane Mitch struck in 1998. In addition to the southeastern United States and tropical Latin America, other places that face regular flooding from events such as these include Bangladesh in the Indian Ocean and the Philippines in the Pacific, among others.
Third, low-lying atolls in the Pacific and Indian oceans are threatened. Islands such as Kiribati, the Maldives, Seychelles, Solomon Islands, and Micronesia often consist mostly of land just a few meters above sea level. With rising oceans and more extreme storms, much of the land area of these islands will be under water or flooded so often as to be uninhabitable (figure 12.26). The risk is becoming such a concern that New Zealand has considered creating a special refugee visa for displaced Pacific Islanders.
A changing climate will reshuffle where humans can best survive and thrive. Economic activity and settlement patterns will have to adjust to these changes, as crops once suited to some places can no longer thrive, water infrastructure for cities requires more extensive distribution networks and flood control, and manufacturing and service businesses reorient where products are made and where consumers live. Managing these changes properly will cost lots of money, while neglect will likely lead to conflict, political instability, and disruptive migration flows.

Figure 12.26.Malé, Maldives. Islands such as this are at risk from rising sea levels and extreme storms. The average elevation of the Maldives is four feet, with a high point of just eight feet. Photo by Chumash Maxim. Stock photo ID: 159659003. Shutterstock.com.
Solutions
In recent years, there has been strong political disagreement over the extent and cause of climate change. Regardless, the science clearly shows that it is significant and that it is caused by humans, with at least 97 percent of actively publishing climate scientists in agreement. Models still vary in how much temperatures will rise, to what degree precipitation will change, how high sea levels will rise, and which regions will be most negatively impacted, but the impacts will be real and substantial in all scenarios. With that said, however, it is clearly fair to debate the best response to climate change. Creative and potentially useful solutions are being proposed from people of diverse political orientations. This is where open debate should be encouraged.
Solutions to climate change can be broken down into two categories. First is mitigation. Mitigation refers to reducing levels of carbon dioxide and other greenhouse gases in the atmosphere. Second is adaptation. This refers to reducing the vulnerability of populations, such as from flooding, heatwaves, and reduced agricultural output.
Mitigation
The long-term and permanent solution to climate change is through mitigation: the reduction of carbon dioxide and other greenhouse gases to levels that can be absorbed naturally by plants, trees, and oceans. The bad news, as shown earlier in this chapter, is that carbon dioxide emissions have increased steadily over the years. But there is good news as well. Between 1963 and 2008, studies show that carbon dioxide emissions per unit of energy produced in the United States has fallen. This tells us that total emissions are increasing along with population and economic growth, but we are becoming more efficient in our energy production over time. If we can continue to become even more efficient, emissions can ultimately be reduced to sustainable levels.
To push forward remedies to climate change, 174 countries have signed the Paris Agreement, a nonbinding platform whereby signatories promise to reduce carbon emissions so that global temperatures in this century rise less than 2 degrees Celsius (3.6 degrees Fahrenheit) above preindustrial levels and to aim for temperature increases of only 1.5 degrees Celsius (2.7 degrees Fahrenheit). How this is to be achieved is not stipulated, giving countries wide leeway to develop mitigation policies.
Absorption of carbon dioxide is heavily influenced by land-use change. As people clear forests and other vegetation for cities, rangeland, and farms, the amount of vegetation available to absorb gases decreases. Reforestation, on the other hand, increases absorption. The problem is that overall, land-use change is resulting in less carbon-absorbing vegetation, not more. Reforestation programs and better land-use planning can help, but more mitigation strategies are required.
This means that mitigation must rely heavily on reductions of emissions. Different approaches are being used, and there are vibrant debates as to which is the most cost effective. In places such as California and parts of the northeastern United States, carbon pricing via cap and trade programs are being used. As with air and water pollution, cap and trade programs set a cap for the total amount of carbon that can be emitted within an area. Companies are then issued emissions permits, which they can use to emit carbon, or they can reduce their emissions and sell the remaining credits to other companies. Over time, permits are removed from the program, thus reducing the amount of permissible carbon emissions.
Other government regulations and standards are being used to reduce carbon emissions as well. Fuel standards for cars and trucks force manufacturers to produce and sell more fuel-efficient vehicles. In the United States, passenger cars in 1980 traveled 24.3 miles per gallon, but by 2014, this number had increased to 36.4 miles per gallon. In government building construction, LEED (Leadership in Energy and Environmental Design) certification has made buildings more energy efficient, requiring less air conditioning and heating. Government-certified Energy Star appliances, such as washers, dryers, and refrigerators, are much more efficient than in the past, while various environmental standards have increased energy efficiency in manufacturing processes.
Government subsidies also impact carbon emissions. Many governments have helped subsidize energy production or consumption via tax breaks, rebates, subsidized loans, and other tools. In all cases, a government subsidy means that the government pays part of the cost of the energy. China, along with big oil states such as Iran, Saudi Arabia, Russia, and Venezuela, provides heavy subsidies to greenhouse gas–producing fossil fuels. Many countries subsidize cleaner renewable energy, such as solar, wind, and geothermal, to jump-start its use.
Opponents of climate change policies argue that the costs of government intervention, be it a tax on carbon via cap and trade, regulations that mandate automobile fuel efficiency, or subsidies for renewable energy, are too high. From a purely economic standpoint, they argue that government spending on these types of mitigation strategies will divert money from other uses, whether private investment or government spending on schools, roads, and the military.
Some point out that technological change and free markets are leading to the use of climate-friendly energy sources anyway. Between 2009 and 2016, the unsubsidized total lifetime cost of building and running wind energy facilities has fallen by 66 percent. During the same time, the cost of utility-scale soar projects has fallen by 85 percent (figure 12.27). This has made them competitive with conventional generating technologies such as coal and natural gas. From 2010 to 2016, the greatest addition to net energy capacity came from renewable energy sources, primarily solar and wind, resulting in substantial growth of renewable electricity output (figure 12.28). Worryingly, coal also increased substantially, but that will change moving toward 2040. By that time, renewables will be even more prevalent, while the role of coal will fall.

Figure 12.27.Solar farm in Qinghai province, China, a country that has been taking the lead in solar power production, accounting for a substantial amount of new installed capacity. Photo by lightrain. Stock photo ID: 636564641. Shutterstock.com.
The question remains whether market and technological solutions will be fast enough to prevent catastrophic warming or if further governmental regulation will be required to speed up reductions in greenhouse gas emissions. By 2022, 30 percent of energy will be produced globally by renewables, up from 24 percent in 2016. However, coal use will still dominate. And while coal growth is expected to fall by 2040, what is needed even more are declines in its use.

Figure 12.28.Renewable electricity output as a percentage of total electricity output. Renewable energy sources have been providing a steadily increasing share of electricity at a global scale since the turn of the century. Data source: World Bank.
Adaptation
Earth is already warming, with corresponding changes in temperature and precipitation and more numerous extreme weather events. Consequently, adaptation to climate change is necessary, even if greenhouse gas emissions are ultimately brought under control.
Adaptation will take many forms. Land-use planning for homes and businesses must consider rising sea levels and larger areas at risk for flood. Infrastructure and transportation networks must be made more resilient to storms and flooding. Water systems must be expanded to conserve water from irregular precipitation patterns, while agricultural regions will have to change the types of crops grown and install more widespread irrigation systems. Seawalls and storm surge barriers will be needed in vulnerable coastal communities (figure 12.29). In some cases, relocation of populations will be necessary. Heatwaves will put pressure on electrical grids. Public health will be at risk, so adaptation must include emergency planning for everything from flood rescue to air-conditioned community cooling centers.

Figure 12.29.The Maeslantkering storm-surge barrier in the Netherlands. These massive arms swing shut to block heavy storm surges from flooding Rotterdam. Expensive adaptations such as these may be necessary to protect New York and other vulnerable coastal cities from rising sea levels and more severe storms. Photo by GLF Media. Stock photo ID: 590781014. Shutterstock.com.
Most governmental adaptation in the United States is occurring at the local level. In Chicago, the city is promoting green rooftops to reduce urban heat. New York and other cities are updating flood insurance maps requiring properties formerly considered safe to buy policies. In the Miami region, regulations are discouraging new developments in areas prone to rising seas and flooding. Phoenix, Arizona, and other cities are focusing on public health by establishing community cooling centers that open during heatwaves.
While some people argue over the significance of climate change, many hard-nosed corporate managers are already adapting their businesses to reduce risks from a warming planet. Coca-Cola has invested in water projects around the world to ensure reliable water for its beverages in a time of uncertain precipitation. ConAgra Foods is diversifying its supply chain so that tomatoes and other produce come from multiple suppliers to reduce the risk of shortages from drought or storm damage. Pacific Gas and Electric Company is upgrading its grid to accommodate higher demand from air conditioning and is working to improve reservoirs and canals to ensure a steady flow of water for hydroelectric power as the Sierra Nevada snowpack declines. Many other companies are taking similar actions to evaluate risks to their physical infrastructure, transportation and supply-chains, and customer needs.
All mitigation and adaptation strategies cost money. Carbon pricing for cap and trade raises the price of fossil fuels, which are the most commonly used sources of energy today. Rising prices on everything from gasoline for our cars to electricity for our offices and factories can harm economic growth. Government rules and regulations do the same by imposing costs on producers who use fossil fuels. Subsidies and research and development for cleaner renewable energy divert money from investment by private companies or from other government programs, be it education, health care, or military spending. Adapting infrastructure to withstand flooding and extreme weather will also be very expensive, as will building sea walls, irrigation and water-supply conduits, and flood-control projects. But if we choose not to pay today, the cost will be even greater in the future as impacts from a warming climate become even more severe. The time of climate change denial is over; hard decisions must now be made on the best way to tackle this global threat to human society.
Go to ArcGIS Online to complete exercise 12.5: “Global carbon emissions.”
References
BBC News. 2017. “Phoenix Flights Cancelled Because It’s Too Hot for Planes.” BBC News, June 20, 2017. http://www.bbc.com/news/world-us-canada-40339730.
Bhada-Tata, Perinaz, and Daniel A. Hoornweg. 2012. “What a Waste?: A Global Review of Solid Waste Management.” Urban Development Series Knowledge Papers; No. 15. Washington, DC: World Bank Group. http://documents.worldbank.org/curated/en/302341468126264791/What-a-waste-a-global-review-of-solid-waste-management.
Boivin, N. L., M. A. Zeder, D. Q. Fuller, A. Crowther, G. Larson, J. M. Erlandson, T. Denham, and M. D. Petraglia. 2016. “Ecological Consequences of Human Niche Construction: Examining Long-Term Anthropogenic Shaping of Global Species Distributions.” Proceedings of the National Academy of Sciences. http://www.pnas.org/content/113/23/6388.full.
Buckley, C., and V. Piao. 2016. “Rural Water, Not City Smog, May Be China's Pollution Nightmare.” The New York Times, April 12, 2016. https://www.nytimes.com/2016/04/12/world/asia/china-underground-water-pollution.html?_r=0.
California Air Resources Board. 2017. Air Quality and Land Use Handbook. California Environmental Protection Agency Air Resources Board. https://www.arb.ca.gov/ch/landuse.htm.
Center for Climate and Security. 2017. Epicenters of Climate and Security: The New Geostrategic Landscape of the Anthropocene. Washington, DC: Center for Climate and Security. https://climateandsecurity.org/epicenters.
Duggan, B. 2017. “Death Toll Rises in Ethiopian Trash Dump Landslide.” CNN, March 15, 2017. https://www.cnn.com/2017/03/15/africa/ethiopia-trash-landslide-death-toll/index.html.
Dunbar, B. 2005. “What's the Difference Between Weather and Climate?” NASA, February 1, 2005. https://www.nasa.gov/mission_pages/noaa-n/climate/climate_weather.html.
European Environment Agency. 2013. “Highest Recycling Rates in Austria and Germany—But UK and Ireland Show Fastest Increase.” Press release, March 3, 2013. https://www.eea.europa.eu/media/newsreleases/highest-recycling-rates-in-austria.
Intergovernmental Panel on Climate Change (IPCC). 2014. Fifth Assessment Report—Impacts, Adaptation and Vulnerability. Geneva: IPCC. https://www.ipcc.ch/report/ar5/wg2.
International Energy Agency. 2017. “Energy Subsidies by Country, 2016.” https://www.iea.org/weo/energysubsidies.
———. “Renewables 2017: A New Era for Solar Power.” https://www.iea.org/publications/renewables2017.
Jaquith, C. 2016. Levelized Cost of Energy Analysis 10.0. New York: Lazard. https://www.lazard.com/perspective/levelized-cost-of-energy-analysis-100.
Larsen, M. C., P. A. Hamilton, and W. H. Werkheiser. 2013. “Water Quality Status and Trends in the United States.” In Monitoring Water Quality. Washington, DC: USGS Publications Warehouse RSS.
NASA. 2014. “Global Climate Change.” https://climate.nasa.gov.
NBC News and Reuters. 2017. “Sri Lanka Garbage Dump Disaster: 100 Feared Dead after Trash Pile Collapse.” NBC News.com, April 17, 2017. https://www.nbcnews.com/news/world/sri-lanka-trash-dump-disaster-100-feared-dead-after-trash-n747231.
Palaniappan, M., P. Gleick, L. Allen, M. Cohen, J. Christian-Smith, and C. Smith. 2010. Clearing the Waters: A Focus on Water Quality Solutions. Oakland, CA: Pacific Institute.
Patel, A. 2014. “Why Many Indians Can’t Stand to Use the Toilet.” Wall Street Journal, October 8, 2014. https://blogs.wsj.com/indiarealtime/2014/10/08/why-many-indians-cant-stand-to-use-the-toilet/?mg=prod%2Faccounts-wsj.
Petit, J. R., and Jean Jouzel. 2001. “Vostok Ice Core Data for 420,000 Years.” IGBP Pages/World Data Center for Paleoclimatology Data Contribution Series, No.2001-076. NOAA/NGDC Paleoclimatology Program, Boulder, CO.
Roque, P. 2000 “31 Filipinos Killed in Garbage Dump Collapse.” ABC News, July 10, 2000. http://abcnews.go.com/International/story?id=83209&page=1.
South Coast Air Quality Management District (AQMD). n.d. “REgional CLean Air Incentives Market (RECLAIM).” Accessed February 12, 2017. http://www.aqmd.gov/home/programs/business/about-reclaim.
———. n.d. “The Southland’s War on Smog: Fifty Years of Progress Toward Clean Air (through May 1997).” Accessed February 16, 2017. http://www.aqmd.gov/home/research/publications/50-years-of-progress#The%20Arrival%20of%20Air%20Pollution.
Tans, P., and R. Keeling. 2018. “Trends in Atmospheric Carbon Dioxide.” National Oceanic and Atmospheric Administration/Earth System Laboratory. https://www.esrl.noaa.gov/gmd/ccgg/trends.
Taylor, L. 2017. “New Zealand Considers Visa for Climate ‘Refugees’ from Pacific Islands.” Reuters, November 17, 2017. https://www.reuters.com/article/us-newzealand-climatechange-visa/new-zealand-considers-visa-for-climate-refugees-from-pacific-islands-idUSKBN1DH1JB.
United Nations Educational, Scientific and Cultural Organization (UNESCO). 2012. UN World Water Development Report, Managing Water Under Uncertainty and Risk. Paris: UNESCO. http://www.unesco.org/new/fileadmin/MULTIMEDIA/HQ/SC/pdf/WWDR4%20Volume%201-Managing%20Water%20under%20Uncertainty%20and%20Risk.pdf.
———. 2017. UN World Water Development Report, Wastewater: The Untapped Resource. Paris: UNESCO. http://www.unesco.org/new/en/natural-sciences/environment/water/wwap/wwdr/2017-wastewater-the-untapped-resource.
United Nations Framework Convention on Climate Change. 2017. “The Paris Agreement.” http://unfccc.int/paris_agreement/items/9485.php.
US Environmental Protection Agency. 2017. “Love Canal Site Profile.” https://cumulis.epa.gov/supercpad/SiteProfiles/index.cfm?fuseaction=second.Cleanup&id=0201290#bkground.
———. “Criteria Air Pollutants.” https://www.epa.gov/criteria-air-pollutants.
———. 2018. “Superfund.” https://www.epa.gov/superfund.
US Global Change Research Program. 2014. National Climate Assessment. Washington, DC: US Global Change Research Program. https://nca2014.globalchange.gov/report.
The World Bank. 2017. Atlas of Sustainable Development Goals 2017. Washington, DC: World Bank Group.
World Health Organization. 2016. Ambient Air Pollution: A Global Assessment of Exposure and Burden of Disease. Geneva, Switzerland: World Health Organization.