We need to keep an eye on the potentially strong supply of private homes that will come on-stream from now till 2015. In particular, we need to be wary about the supply in 2011 and 2012 because the global economic recovery remains elusive.
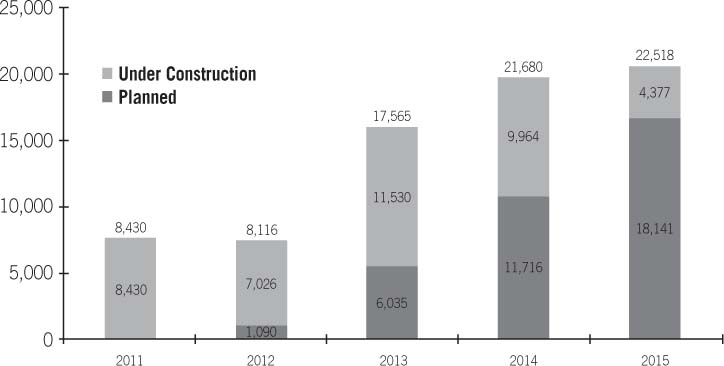
Based on the Urban Redevelopment Authority’s (URA) release on 28 January 2011 of the fourth quarter (Q4) 2010 data for private residential properties, compiled from developers’ surveys, the estimated number of residential units that will obtain a Temporary Occupation Permit (TOP) from 2011 to 2015 are as shown in Figure 8.
Figure 8 Current forecast of residential supply for 2011 to 2015
(Source: URA)
Now, these TOP numbers are all higher than the average annual increment of around 6,500 private residential units in the 10-year period from 2001 to 2010 (where annual increment is defined as TOP units minus demolitions). If we do not net off demolitions, the average new supply was about 8,000 units per year, still less than half of the estimated annual supply for 2013 to 2015.
To be rigorous in our analysis, we need to take into account the potential demolitions so as to arrive at the net new supply numbers. There are apartments from the last en bloc peak which are expected to be demolished this year or next, such as Lucky Tower and Leedon Heights. In addition, there were about 30 en bloc transactions in 2010. Taken together, the expected demolitions in 2011 and 2012 should number no more than 1,000 units per year. This means that net new supply in these two years could be in the region of 7,500 units per year. So at first glance, it would seem that we are safe from an over-supply situation.
The estimated TOP supply for 2010 was 10,744 units in the URA’s Q2 2010 report and 10,536 units in its Q3 2010 report. We eventually ended with 10,399 units completed, based on the Q4 2010 report. The forecasts in the second and third quarters of 2010 were within 3 per cent of each other and of the final tally. This is fine. It was also within our forecast of 10,000 to 11,000 units.
However, the estimated TOP supply for 2010 was way off before Q2 2010. The four quarters from Q2 2009 to Q1 2010 saw TOP numbers revised upwards sequentially from a low of 5,394 to 10,744. That’s an increase of 100 per cent over a 12-month period. Could construction companies and developers have ramped up the pace of construction that quickly?
The estimated TOP supply for 2010 was even further off in 2006 to 2008. At its peak, the highest estimate given was for more than 21,000 units to be completed in 2010. With hindsight, we see that the reality is half of the peak estimate.
We had forecast TOPs of 11,000 to 12,000 units of new supply each year — much higher than the long-term average.
However, looking at Figure 9 on “Quarterly Forecast of Residential Supply for 2011”, we see that the URA’s survey of the developers’ completion is only starting to increase. The increase from Q3 2010 forecast to that of Q4 2010 is a significant 25 per cent.
Figure 9 Quarterly forecast of residential supply for 2011
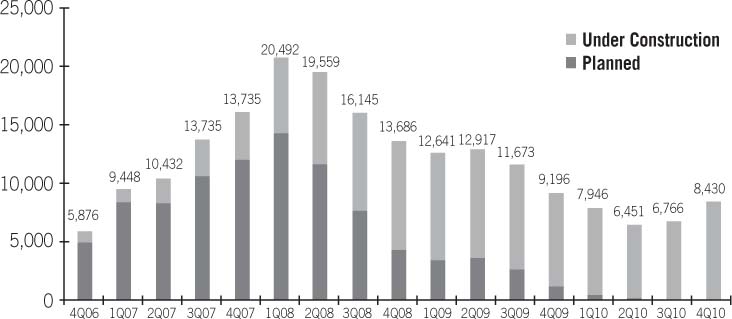
(Source: URA)
I would expect to see at least one more upward revision in the 2011 forecast. And we have to be well into the year before solid survey data from developers will yield a better estimate. Similarly, we would be well into 2012 before we are within a few percentage points of the actual 2012 supply.
According to URA data, we can expect completions of 17,565 units of residential property in 2013, 21,680 units in 2014 and 22,518 units in 2105. The completion data is skewed heavily towards the last three years of the five-year forecast period.
When we analysed the detailed data and looked into projects on the drawing block, projects launched and projects under construction, our forecast of the supply numbers is smoother but still skewed towards the later years, as shown in Table 11.
Table 11 Supply of private residential properties, 2011 to 2015
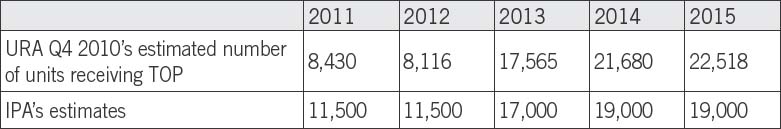
(Sources: URA, IPA)
Whichever way the supply numbers turn out, they will be way over the averages recorded in the post-millennium decade. Some 30 to 40 per cent of the residential units that will be completed in 2011 and 2012 will come from the central region, including Sentosa.
From 2013 to 2015, 90 per cent of the new completions will be in the outskirts of Singapore, for example Hougang, Sengkang, Pasir Ris and Punggol. During the same period, we may also expect the completion of close to 40,000 public housing units (launched in late 2010 and 2011), particularly in Sengkang, Yishun, Punggol and Woodlands.
There may be strong downward pressure on rentals and prices unless many more expatriates and permanent residents land on our shores. This could be possible with strong jobs creation, backed by a steady pace of economic growth over the next five years.
However, if the current economic thinking prevails and we see shorter recession-to-growth cycles, then property peak-to-trough cycles should shrink too. Since the current property up-cycle began in 2009, might we experience a down-cycle during the strong over-supply period of 2013 to 2015?