- The parameter thickness can take positive and negative values. If the value is positive, it indicates the thickness of the outline. A negative value (for example, -1) indicates that a filled shape will be drawn. For example, to draw a filled ellipse, note the following:
cv2.ellipse(image, (80, 80), (60, 40), 0, 0, 360, colors['red'], -1)
You can also use cv2.FILLED:
cv2.ellipse(image, (80, 80), (60, 40), 0, 0, 360, colors['red'], cv2.FILLED)
- The lineType parameter can take three values (cv2.LINE_4 == 4, cv2.LINE_AA == 16, cv2.LINE_8 == 8). To draw Anti Aliased lines, you must use cv2.LINE_AA:
cv2.line(image, (0, 0), (20, 20), colors['red'], 1, cv2.LINE_AA)
- The diagonal line is created with the help of the following code:
cv2.line(image, (0, 0), (512, 512), colors['green'], 3)
- The text is rendered as follows:
cv2.putText(image, 'Hello OpenCV', (10, 30), cv2.FONT_HERSHEY_SIMPLEX, 0.9, colors['red'], 2, cv2.LINE_4)
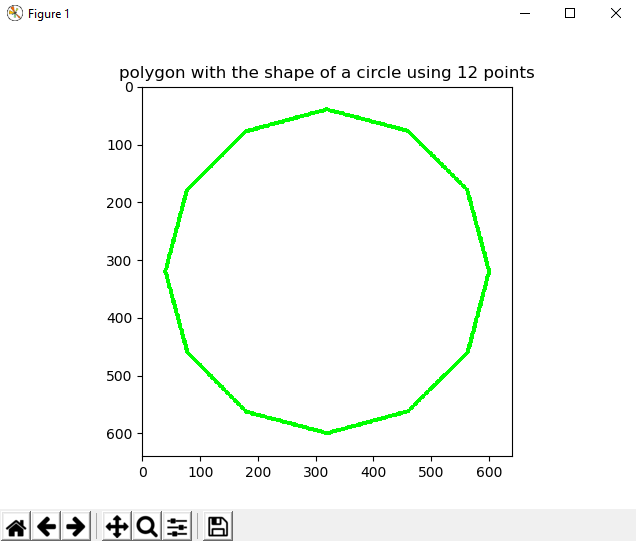
- The code for this exercise corresponds to the circle_polygon.py script. To get the coordinates, you can use the parametric equation of the circle (see analog_clock_values.py). The following figure shows you this polygon:

The code for the circle_polygon.py file is as follows:
"""
Example to show how to draw a circle polygon
"""

# Import required packages:
import cv2
import numpy as np
import matplotlib.pyplot as plt


def show_with_matplotlib(img, title):
    """Shows an image using matplotlib capabilities

    """
    # Convert BGR image to RGB
    img_RGB = img[:, :, ::-1]

    # Show the image using matplotlib:
    plt.imshow(img_RGB)
    plt.title(title)
    plt.show()


# Dictionary containing some colors
colors = {'blue': (255, 0, 0), 'green': (0, 255, 0), 'red': (0, 0, 255), 'yellow': (0, 255, 255),
          'magenta': (255, 0, 255), 'cyan': (255, 255, 0), 'white': (255, 255, 255), 'black': (0, 0, 0),
          'gray': (125, 125, 125), 'rand': np.random.randint(0, high=256, size=(3,)).tolist(),
          'dark_gray': (50, 50, 50), 'light_gray': (220, 220, 220)}

# We create the canvas to draw: 640 x 640 pixels, 3 channels, uint8 (8-bit unsigned integers)
# We set background to black using np.zeros()
image = np.zeros((640, 640, 3), dtype="uint8")

# If you want another background color you can do the following:
# image[:] = colors['light_gray']
image.fill(255)

pts = np.array(
    [(600, 320), (563, 460), (460, 562), (320, 600), (180, 563), (78, 460), (40, 320), (77, 180), (179, 78), (319, 40),
     (459, 77), (562, 179)])

# Reshape to shape (number_vertex, 1, 2)
pts = pts.reshape((-1, 1, 2))

# Call cv2.polylines() to build the polygon:
cv2.polylines(image, [pts], True, colors['green'], 5)

# Show image:
show_with_matplotlib(image, 'polygon with the shape of a circle using 12 points')
- The code corresponds to the matplotlib_mouse_events_rect.py script.
The key point is how to capture the double left click:
- Double click: event.dblclick
- Left click: event.button == 1
The code for the matplotlib_mouse_events_rect.py file is as follows:
"""
Example to show how to capture a double left click with matplotlib events to draw a rectangle
"""

# Import required packages:
import cv2
import numpy as np
import matplotlib as mpl
import matplotlib.pyplot as plt

# Dictionary containing some colors
colors = {'blue': (255, 0, 0), 'green': (0, 255, 0), 'red': (0, 0, 255), 'yellow': (0, 255, 255),
          'magenta': (255, 0, 255), 'cyan': (255, 255, 0), 'white': (255, 255, 255), 'black': (0, 0, 0),
          'gray': (125, 125, 125), 'rand': np.random.randint(0, high=256, size=(3,)).tolist(),
          'dark_gray': (50, 50, 50), 'light_gray': (220, 220, 220)}

# We create the canvas to draw: 400 x 400 pixels, 3 channels, uint8 (8-bit unsigned integers)
# We set the background to black using np.zeros()
image = np.zeros((400, 400, 3), dtype="uint8")

# If you want another background color you can do the following:
image[:] = colors['light_gray']


def update_img_with_matplotlib():
    """Updates an image using matplotlib capabilities

    """
    # Convert BGR to RGB image format
    img_RGB = image[:, :, ::-1]

    # Display the image:
    plt.imshow(img_RGB)

    # Redraw the Figure because the image has been updated:
    figure.canvas.draw()


# We define the event listener for the 'button_press_event':
def click_mouse_event(event):
    # Check if a double left click is performed:
    if event.dblclick and event.button == 1:
        # (event.xdata, event.ydata) contains the float coordinates of the mouse click event:
        cv2.rectangle(image, (int(round(event.xdata)), int(round(event.ydata))),
                      (int(round(event.xdata)) + 100, int(round(event.ydata)) + 50), colors['blue'], cv2.FILLED)
    # Call 'update_image()' method to update the Figure:
    update_img_with_matplotlib()


# We create the Figure:
figure = plt.figure()
figure.add_subplot(111)

# To show the image until a click is performed:
update_img_with_matplotlib()

# 'button_press_event' is a MouseEvent where a mouse botton is click (pressed)
# When this event happens the function 'click_mouse_event' is called:
figure.canvas.mpl_connect('button_press_event', click_mouse_event)

# Display the figure:
plt.show()
- The code corresponds to the meme_generator_opencv_python.py script. This is a simple script where an image is loaded, and afterwards, some text is rendered:
"""
Example to show how to draw basic memes with OpenCV
"""

# Import required packages:
import cv2
import numpy as np
import matplotlib.pyplot as plt


def show_with_matplotlib(img, title):
    """Shows an image using matplotlib capabilities

    """
    # Convert BGR image to RGB
    img_RGB = img[:, :, ::-1]

    # Show the image using matplotlib:
    plt.imshow(img_RGB)
    plt.title(title)
    plt.show()


# Dictionary containing some colors
colors = {'blue': (255, 0, 0), 'green': (0, 255, 0), 'red': (0, 0, 255), 'yellow': (0, 255, 255),
          'magenta': (255, 0, 255), 'cyan': (255, 255, 0), 'white': (255, 255, 255), 'black': (0, 0, 0),
          'gray': (125, 125, 125), 'rand': np.random.randint(0, high=256, size=(3,)).tolist(),
          'dark_gray': (50, 50, 50), 'light_gray': (220, 220, 220)}

# We load the image 'lenna.png':
image = cv2.imread("lenna.png")

# Write some text (up)
cv2.putText(image, 'Hello World', (10, 30), cv2.FONT_HERSHEY_TRIPLEX, 0.8, colors['green'], 1, cv2.LINE_AA)

# Write some text (down)
cv2.putText(image, 'Goodbye World', (10, 200), cv2.FONT_HERSHEY_TRIPLEX, 0.8, colors['red'], 1, cv2.LINE_AA)

# Show image:
show_with_matplotlib(image, 'very basic meme generator')