Sometimes, you have to work with specific channels on multichannel images. To do this, you have to split the multichannel image into several single-channel images. Additionally, once the processing has been done, you may want to create one multichannel image from different single-channel images. In order to both split and merge channels, you can use the cv2.split() and cv2.merge() functions, respectively. The cv2.split() function splits the source multichannel image into several single-channel images. The cv2.merge() function merges several single-channel images into a multichannel image.
In the next example, splitting_and_merging.py, you will learn how to work with these two aforementioned functions. Using the cv2.split() function, if you want to get the three channels from a loaded BGR image, then you should use the following code:
(b, g, r) = cv2.split(image)
Using the cv2.merge() function, if you want to build the BGR image again from its three channels, then you should use the following code:
image_copy = cv2.merge((b, g, r))
You should remember that cv2.split() is a time-consuming operation, and so you should only use it if strictly necessary; otherwise, you can use the NumPy functionality to work with specific channels. For example, if you want to get the blue channel of the image, you can do the following:
b = image[:, :, 0]
Additionally, you can eliminate (set to 0), some of the channels of a multichannel image. The resulting image will have the same number of channels, but with the 0 value in the corresponding channel; for example, if you want to eliminate the blue channel of a BGR image, you can use the following code:
image_without_blue = image.copy()
image_without_blue[:, :, 0] = 0
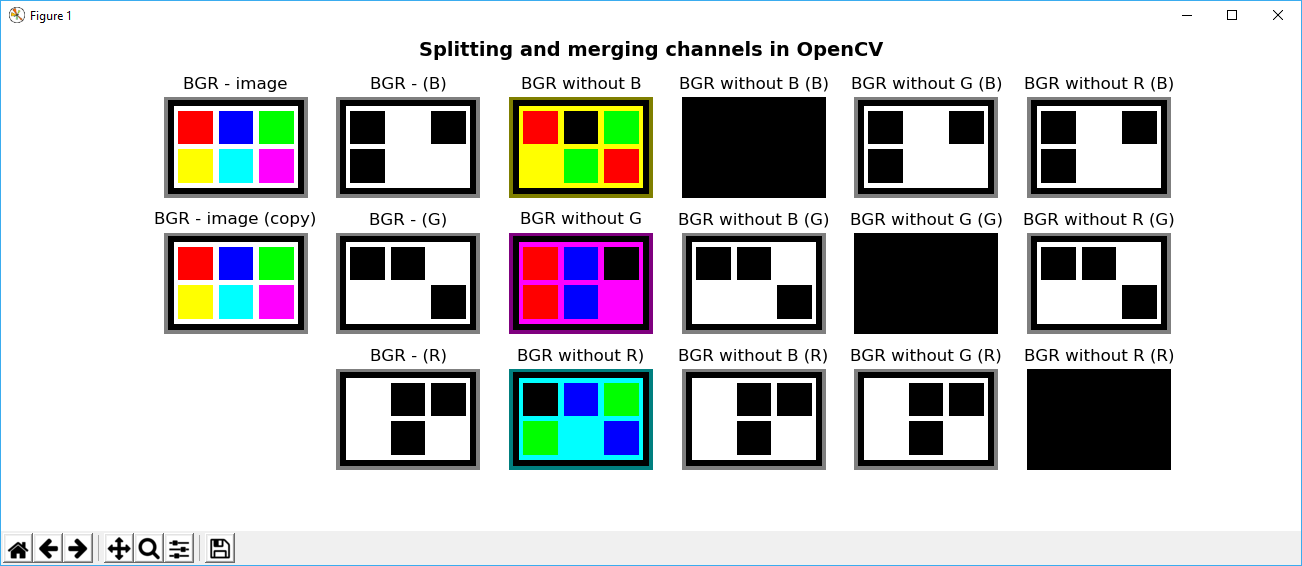
If you execute the splitting_and_merging.py script, you will see the following screenshot:

In order to understand this screenshot, you should remember the additive properties of the RGB color space. For example, in connection with the subplot BGR without B, you can see that most of it is yellow. This is because green and red values yield yellow. Another key feature that you can see is the black subplots corresponding to the specific channels that we have set to 0.