Do you watch the forecast on the television each evening, or look at the weather maps in the newspaper? The chances are that if you are a farmer, fisherman, gardener, long-distance traveller or a teacher with the prospect of ‘wet playtime’, your everyday life is influenced by changes in the weather and it is important to you to know what the heavens have in store for you. It is something that has preoccupied people for thousands of years, so the study of the weather – a science known as meteorology – has ancient roots.
The ancients
When prehistoric humans in the colder parts of the globe emerged from their caves each day, they probably did what you do every morning when you leave your house: they looked up at the sky and thought ‘will it rain or will it shine?’ The perceptions of warmth and cold, sunshine, wind, rain or snow must have been some of their earliest sensations. Eventually, they recognised signs and patterns in the sky and passed these observations on to successive generations, first by word of mouth and then in writing. These were the early weather forecasts, and they were recognised in the Bible.
When it is evening, ye say, It will be fair weather: for the sky is red. And in the morning, It will be foul weather today: for the sky is red and lowering.
St Matthew 16:2–3
Watch the sky... and the cat
Down the centuries, watching the behaviour of both wild and farmyard animals gave rise to short-range weather forecasts. Sayings and rhymes were once the only weather observations used to indicate what might happen in the following twenty-four hours.
If cows stand in a field it will be fine, if they lie down it will rain.
When bees stay close to the hive, rain is close by.
If crows fly low, wind’s going to blow; If crows fly high, wind’s going to die.
When seabirds fly to land, there truly is a storm at hand.
Flies will swarm before a storm.
Before a rainstorm: cats will clean and mew more; pigs wallow about and squeal; cows huddle together; horses ‘switch and twitch’ and sometimes bolt; insects fly low and bite; and birds chirp more loudly.
Similarly plants were good indicators.
Moss dry, sunny sky; Moss wet, rain you’ll get.
When a rainstorm is approaching: dandelions close their blossoms tightly; morning glories tuck in their blooms as if ready for a sleep; clover folds up its leaves; and the leaves on many trees roll up or turn to show their undersides.
Weather soothsayers even tried longer-term predictions for weather in another season of the year.
When squirrels collect a big store of nuts, it will be a hard winter.
If the groundhog sees its shadow on 2 February, there’ll be another six weeks of winter.
Fire, earth, air and water
For thousands of years humankind must have relied on folklore and myth to record the weather, but then along came the philosophers and scientists and the activity became more formalised.
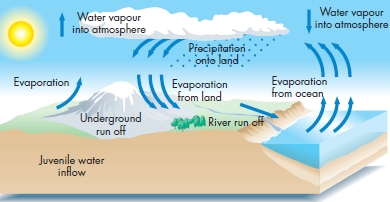
The word ‘meteorology’ comes from Aristotle. He referred to heat and cold in terms of the four elements – fire, earth, air and water – but by 350 BCE he had already recognised the basics of what we now know as the hydrological cycle.
Aristotle’s hydrological cycle
Now the Sun, moving as it does, sets up processes of change and becoming and decay, and by its agency the finest and sweetest water is everyday carried up and is dissolved into vapour and rises to the upper region, where it is condensed again by the cold and so returns to earth.
Aristotle (384–322 BCE)
First measurements
Crude measurements of rainfall were made in India about 400 BCE, using a container 46 cm (18 in) wide as a rain gauge. Rain gauges dating from the fifteenth century have been found also in Korea.
Early instruments
The first accurate meteorological measurements were taken in the seventeenth century.
Air pressure: In 1643, the Italian physicist Evangelista Torricelli invented a barometer that could measure air pressure. Torricelli noticed that the weather changed as air pressure changed, a drop in pressure indicating a storm is coming and a rise in pressure predicting fair weather.
Humidity: Until 1655, observers relied on the moisture-absorbing properties of materials such as natural sponges, seaweeds and dried wool to measure humidity but that year Ferdinand II of Tuscany developed the hygrometer, which relied on the condensation of dew on an artificially cooled surface. Using this method, the amount of moisture in the atmosphere could be measured more accurately.
Wind speed: The Greeks recorded wind direction as far back as 100 BCE, but it was not until 1667 that Robert Hooke built an anemometer that measured wind speed reliably.
Temperature: Around the turn of the seventeenth century, Galileo Galilei invented the thermoscope, making the first rudimentary measurements of temperature; but it was not until 1714 that the German physicist Gabriel Fahrenheit developed the mercury thermometer.
By the middle of the eighteenth century, science had the wherewithal not only to monitor accurately several different aspects of the weather, but also to predict what it was about to do.
![]()
FACT
Torricelli’s barometer was something of an ‘accidental invention’, arising out of his experiments to prove that air actually has weight.
In 1765, French scientist Antoine-Laurent Lavoisier was one of the first to collect daily records that included measurements of air pressure, moisture content of the atmosphere and wind speed and direction. From the information he gathered, he claimed to be able to make weather predictions. ‘With all of this information,’ he said, ‘it is almost always possible to predict the weather one or two days ahead with reasonable accuracy.’
The new science was given a boost in 1854, after a shipping disaster. A French naval ship and 38 merchant vessels were sunk in a violent storm near Balaklava in the Crimea. The director of the Paris Observatory was asked to investigate. He discovered that the storm had formed two days before the disaster and had moved across Europe from the south-east. Its arrival at Balaklava could have been predicted. This prompted the establishment of a national storm-warning system in France – probably the birth of the science of meteorology.
Global cooperation
Weather records were gathered first by amateur naturalists and recorded in personal diaries, but by the nineteenth century national meteorological services were established in Europe and later elsewhere. In 1853 an international conference on maritime meteorology agreed to exchange weather data in order to draw up the first weather maps, and by 1873 national services grouped together to form the International Meteorological Organisation (IMO). In 1950, after World War II, it was designated the World Meteorological Organisation (WMO) and by 1951, the United Nations recognised it as a specialised agency. As of 2004, 187 countries were members, enabling the free communication of standardised weather data for the purposes of forecasting the weather, as well as monitoring global climate changes and the long-range transmission of pollutants in the atmosphere.
![]()
FACT
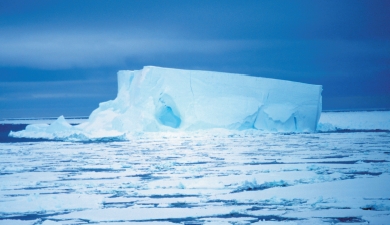
The world’s coldest temperatures of -88.3°C (-126.9°F) and -89.2°C (-128.6°F) were recorded at Vostok, Antarctica, on 25 August 1960 and 21 July 1983.
Temperature is measured in the shade, not in direct sunlight, so the thermometer itself does not heat up and give a false reading. Temperatures in direct sunlight can be 10–15°C (18–27°F) higher than in the shade in still air, though this may be lower on windy days.
Maximum and minimum
The highest and lowest temperatures are recorded during the course of 24 hours by a special ‘max and min’ thermometer. The column of mercury or alcohol pushes tiny metal markers up and down inside the thermometer’s tube. The bi-metallic dial type of thermometer has ‘hands’ that point to figures on a clock face.
![]()
FACT
The highest air temperature of 58°C (136°F) was recorded at El Azizia in Libya, Africa, on 13 September 1922.
Fahrenheit and Celsius
Gabriel Fahrenheit published the first temperature scale in 1724. He assigned 0°F to the freezing point of a liquid (not simply water) that gave the lowest possible temperature at that time. The human body temperature was set at 98°F (actually 98.6°F) and the boiling point of water became 212°F.
Swedish astronomer Anders Celsius introduced the Centigrade (now known as Celsius) scale in 1742. It is based on the freezing and boiling points of water, divided conveniently into 100 divisions. This makes the freezing point of water 0°C and the boiling point 100°C.
Temperature conversion table

Some like it hot
The hottest temperatures on Earth are experienced in Ethiopia, Libya, Australia and the United States.
Dallol, Ethiopia: The world’s highest annual mean temperature was recorded in Dallol. Between October 1960 and December 1966, an average temperature of 35°C (94°F) was documented. Compare this with an average summer temperature for Key West, Florida, of 25.7°C (78.2°F).
Death Valley, California: On 43 consecutive days between 6 July and 17 August 1917, the average temperature was over 48°C (120°F) in Death Valley, California. A few years earlier, on 10 July 1913, the mercury reached 56.7°C (134°F). Death Valley is the lowest point on the Earth’s land surface in the Western Hemisphere, and although the location is in mid-latitudes, the lower the altitude, the higher the temperature. The 209-km (130-mile) by 23-km (14-mile) desert has little more than 5 cm (2 in) of rain per year. It gets its name from one of 18 survivors from a party of 30 that was heading for the California gold fields in 1849.
Marble Bar, Australia: The world’s longest hot spell spanned 162 consecutive days from 30 October 1923 to 7 April 1924 at Marble Bar, Western Australia, where the temperature was 38°C (100°F).
Some have it cold
The coldest temperatures on Earth are experienced not only in the Antarctic, but also in north-eastern Siberia where the mercury can drop to -68°C (-90°F).The townsfolk of Verkhoyansk on the Yanu River and Omyakon on the Indigurka River often experience these icy temperatures. Both towns are surrounded by mountains far from the Arctic Sea, at latitudes of 63° North.

An ‘eruptive prominence’ of gas from the Sun measuring more than 128,747 km (80,000 miles) long and 33,315°C (60,000°F).
![]()
FACT
The hottest air temperature experienced on Earth is 58°C (136°F). 150 million kilometres (93 million miles) away on the surface of the Sun the temperature is close to 5,538°C (10,000°F ), and about 22,200°C (50,000°F) at its centre.
The average air pressure at sea level over the whole of our planet is 1,013.25 millibars. Due to the altitude on the top of high mountains, such as Mount Everest, the barometric air pressure is about one-third less than at sea level.
Low pressure
The lowest air pressure recorded on land was in a category 5 hurricane that hit the Florida Keys on 2 September 1935 – the Labor Day Storm. The barometer dropped to an unexpected 892.3 millibars. The railroad connecting Key West to the mainland was destroyed, every tree ripped from the ground and people were blasted by sand such that their clothes were stripped away.
Manned weather stations on the ground monitor a whole host of factors – cloud height, speed and direction of movement, visibility, sunlight duration and intensity, maximum and minimum air temperature, soil temperature, atmospheric pressure, precipitation, humidity, wind speed and direction, pollution and pollen count, radiation from the Sun, space and the Earth itself and evaporation.
![]()
FACT
Eureka Weather Station at Slidre Fjord on Ellesmere Island in the Canadian High Arctic is about 1,130 km (702 miles) from the North Pole and considered to be the world’s most remote manned weather station. In deepest winter, temperatures plunge regularly to -40°C (-40°F) and it’s dark for 24 hours a day.
Untouched by human hand
The latest in weather monitoring is the Automated Weather Sensor System (AWSS), operated by the Federal Aviation Administration in the United States. Every minute, it records temperature, visibility, wind, precipitation, humidity, dewpoint, barometric pressure, cloud cover and the presence of thunder and freezing rain. This information is available instantly to airline pilots and weather offices providing the most accurate forecasts possible.
Weather radar
Weather radar produce pulsed signals that bounce off objects as small as raindrops and hail, providing data on precipitation and the movement of thunderstorm cells and wind shear events – changes in wind speed and/or direction over short distances. Smaller objects, such as water droplets and ice crystals in clouds, are detected by Millimeter Wave Cloud Radar, giving data on cloud thickness and height.
Although ground-based observations are valuable for weather watchers, in order to obtain an overall view throughout the atmosphere other methods need to be employed.
Kites: In 1149, Scottish meteorologists Dr Alexander Wilson and Thomas Melville attached thermometers to kites in order to monitor temperatures 915 m (3,000 feet) above the ground.
First balloons: In 1896, French meteorologist Leon Teisserenc de Bort began to attach instruments to balloons launched from his home in Versailles. In 1902 he revealed his discovery that the atmosphere consisted of two layers – the troposphere and stratosphere.
Radio balloon: In 1931, a balloon carried the first radio receiver and detectors (radiosonde) that transmitted weather data to the ground. In 1935 it was adopted as a routine activity first in Scandinavia.
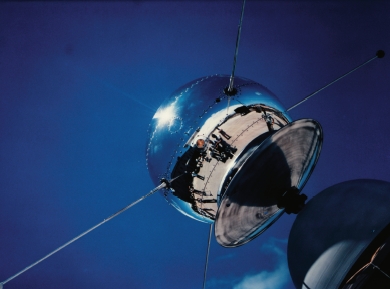
Vangourd satellite, the first weather satellite, was launched 26 June 1 958.
Weather balloons
Today, weather balloons filled with hydrogen or helium, with radiosondes attached, are tracked by Global Positioning System navigation satellites. They are considered to be the most effective way of gathering weather data from the upper atmosphere. They are flown twice a day from 1,100 sites around the world. A flight lasts for about two hours, the radiosonde reaching 40 km (25 miles) above the ground and drifting about 200 km (125 miles) from its release point. Temperatures in the region of -90°C (-130°F) are experienced up there, together with air pressure that is one-thousandth or less than that at the Earth s surface. As well as information about atmospheric pressure and humidity, special flights can also monitor ozone levels.
Whoosh!
Above 40 km (25 miles) solid fuel sounding rockets or elevator research rockets, which fly for 8–10 minutes, are used to obtain meteorological information. They usually take readings from altitudes of 50–200 km (31–124 miles) above the Earths surface – the gap between balloons and satellites. European Space Agency (ESA) rockets take off from Kiruna in the north of Sweden and the National Space Administrations (NASA) sounding rockets go from Wallop on Virginia’s eastern shore.
Earth from space
The first unofficial ‘weather satellite’ was NASA’s Vanguard II, which took the first pictures from space of Earth’s cloud cover. It was launched on 17 February 1959, but it was not until 1 April 1960 that TIROSI was put into orbit and it was established that satellites could monitor the Earth’s weather patterns.
TOPEX/Poseidon was launched in August 1992, revolutionising our understanding of seasonal patterns in the world’s oceans. The follow-up satellite, Jason-1, provided yet more data on ocean circulation and topography, enabling scientists to understand and predict the disruptive weather cycle known as ‘El Niño’.
Supercomputers are the key to today’s weather forecasts. Data is taken from all over the world and fed into sophisticated software programs that simulate the atmosphere, from sea level to the highest altitudes. In order to predict what will happen, the atmosphere is divided up into ‘cells’ and as much data as possible is acquired from each cell. If predictions are short term, then data ‘downwind’ – where the weather systems are going – need only cover 160 km (100 miles) or so, but if a long-term forecast is required then global information is needed.
Accuracy
The complexity of the atmosphere and weather systems, and their chaotic behaviour, means that weather forecasts become less accurate the further ahead they try to predict. The accuracy of daily forecasts drops off significantly after 10 days, and even in the 5–10 day range errors can be large. Even highly visible events, such as hurricanes, can be difficult to predict. The predicted track of a storm five days away can be off as much as 587 km (365 miles) – the distance from Manchester to Penzance in England.
Unpredictable fluctuations
Small-scale fluctuations in the atmosphere, known as ‘inertia-gravity waves’, have an impact on the lower 16 km (10 miles) of the atmosphere. They can be seen, for example, as ‘stripy’ features in cloud and are the result of changes in fluids in the atmosphere. They can have a significant influence on weather prediction.
The forecast pioneer
English mathematician Lewis Fry Richardson made the first mathematical predictions about the behaviour of the atmosphere. In 1922, his laborious calculations in a pre-computer age meant that his results were not available until the weather system had passed. He concluded that his calculations would require the work of 60,000 people in order to provide a forecast before the event. Nevertheless the numerical system he developed has been used to the present day.