Uneven heating of the Earth’s surface causes air to move mainly horizontally between air masses, causing ‘wind.’ Wind flows between air masses of different barometric pressure, from high pressure to low pressure, in an attempt to even them out. Winds can be local breezes caused by temperature differences between land and sea, or be global winds caused by an enormous differentiation between the temperatures at the Equator and the Poles.
If our planet did not rotate, there would be a simple flow of warm air from the Equator to the Poles in the upper atmosphere, because hot air rises, and a flow of cooler air from the Poles to the Equator nearer the ground, because cool air falls. However, the Earth does rotate, with the result that this simple pattern is made much more complex. Across the world, there are bands of winds that blow in different directions depending on the latitude; these winds have been familiar to sailors for centuries and have well-established names.
Trade winds
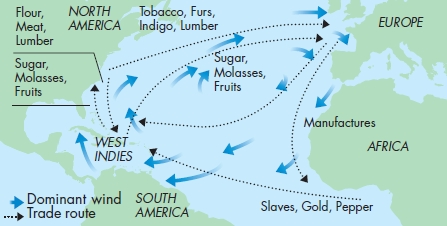
These are the most reliable winds on the planet, winds on which mariners in sailing ships relied to carry them from Europe to the Americas. They form under what is known as the ‘Hadley Cell’ on either side of the Equator. This meteorological phenomenon carries warm air upward at the Equator and transports it toward the Poles. At latitudes 30° North and South the air cools and descends, making its way back to the Equator, albeit with a shift to the west due to the Coriolis effect (a force associated with the rotation of the Earth). In the Northern Hemisphere the winds blow from the northeast and are known as the Northeast Trades. In the Southern Hemisphere they blow from the southeast and are the Southeast Trades. The name ‘trade’ comes from the Old English word trade meaning ‘track’, giving rise to the expression ‘the wind blows trade’ or ‘on track’.
Roaring forties
The name ‘roaring forties’ was applied by mariners to strong and steady westerlies occurring between latitudes 40° and 50° South, where they are unhindered by major land masses.
Polar easterlies
A permanent body of falling cold air dominates the high latitude end of the ‘Polar Circulation Cell’, and winds caused by the outflow of air from that cell are cool, strong and unrelenting. They blow in both hemispheres. In the Northern Hemisphere, they sometimes combine with warm moist air from the Gulf Stream, producing violent thunderstorms and even tornadoes, such as the devastating 1987 Edmonton tornado, as far north as latitude 60° on the North American continent.
Westerlies
These winds are linked to a mid-latitude phenomenon known as the ‘Ferrel Cell’. This cell balances the Hadley and Polar Circulation Cells and its air moves in the same direction as our planetary rotation. Eddy currents are created that cause the airflow and, therefore, the wind at the Earth’s surface to flow mainly from west to east.
Jet streams
These are upper level winds that move generally eastward in the tropopause (the continuously moving boundary between the troposphere and stratosphere) at the junction between the Polar Circulation Cell and Ferrel Cell. They also form in winter at latitudes of 30° at the junction between Hadley and Ferrel cells. Jet streams are not continuous around the world and their tracks can shift to north and south.
Doldrums
These are an area of calm close to the Equator, between latitudes 5° North and South, where the air rises but does not blow horizontally. Sailors caught here found the weather conditions depressing so it became known as the ‘doldrums’. The area is known technically as the ‘Intertropical Convergence Zone’ or ITCZ. The trade winds converge here and produce some of the world’s heaviest rainfalls.
Horse latitudes
This is a name given to a band between 30° and 35° North and 30° and 35° South – the boundary between the Hadley and Ferrel cells. Here, dry air descends, high pressure dominates and winds are weak. It is also known as the subtropical high. According to folklore, sailors gave the region this name because their sailing ships were stranded and they threw any livestock, such as horses, overboard in an attempt to save on provisions.
![]()
FACT
A ‘microburst’ wind was responsible for the crash of a commercial airliner at Dallas-Fort Worth International Airport in 1985.
Microbursts and macrobursts
Tornadoes are often blamed for damage caused by ‘microbursts’. These are winds that blast down to the ground from thunderstorms at speeds of more than 240 km/h (150 mph), destroying buildings, blowing down trees and probably accounting for some aircraft crashes. The phenomenon is known generally as a ‘downburst’, but if it affects an area less than 4 km (2.5 miles) square it is known as a ‘microburst’, and if it affects a larger area it is a ‘macroburst’.
Mesoscale winds
These are winds that rise and fall in a short time and generate their own weather. Many have local names, as seen below:
|
Country |
Local names for mesoscale winds |
|
Argentina |
Pampero, Suestado, Williwaw, Zonda |
|
Australia |
Brickfielder, Cockeyed Bob, Fremantle Doctor, Guba |
|
Canada/ Northern USA |
Barber, Chinook, Nor’easter, Piterak, Squamish, Taku, Knik |
|
Central America |
Chubasco, Papagayo |
|
France |
Aspre, Auster, Autan, Maestro, Marin, Mistral/Cierzo |
|
Greece |
Etesian/Meltemi, Euros, Gregale, Lips, Vardar, Zephyr/Zephyros |
|
Hawaii |
Kona, Mauka, Pali |
|
India |
Bhoot, Elephanta, Brubu |
|
Italy |
Bentu de Soli (Sardinia), Libeccio, Sirocco, Garigliano/Tramotana |
|
Mexico |
Chocolatero, Cordonazo, Coromell, Nortes, Teheuntepecer |
|
New Zealand |
Canterbury Nor’wester |
|
Persian Gulf |
Nashi, Shamal, Sharki |
|
Siberia (Russia) |
Buran, Burg, Purga |
|
Southwest USA |
Blue Norther, Diablo, Haboob, Santa Ana, Sundowner |
|
Switzerland |
Bise, Föhn, Maloja |
|
South Africa |
Cape Doctor/Black Southeaster, Bull’s Eye Squall |
Anabatic and katabatic winds
Known also as a valley breeze, an anabatic wind moves up a slope. In the morning the Sun warms the upper slopes of the mountains while the valley is in shade. The warm air rises and is replaced by cooler air from below Katabatic winds are driven by cold air racing down slopes, also known as ‘mountain breezes’. They can form when cool air on a cold plateau, such as Mongolia, Antarctica, the Patagonia Ice Sheet or Greenland, is set in motion under the influence of gravity, and they can be very fierce.
Windiest place on Earth
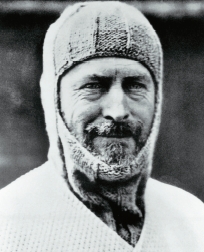
The windiest place on Earth close to sea level is Cape Denison in the Antarctic. It was Australian explorer Douglas Mawson’s base in 1911. On his arrival Mawson found it odd that no sea ice prevented him from reaching shore, an indication perhaps of strong winds in the area. Sure enough, the next six months delivered gusts up to 160 km/h (100 mph), peaking at 320 km/h (200 mph) in May 1912. Mawson dubbed the Cape and adjacent Commonwealth Bay as ‘Home of the Blizzard’. Its winds are katabatic and are the consequence of the domed continent and low-pressure systems at the coast. Large quantities of icy cold air slide down the coastal slopes of the Antarctic ice sheet, accelerating as they go to create hurricane force winds at the edge of the sea.
Warm Antarctic wind
A ‘Föhn bank’ is formed by a warm, contour-hugging wind passing over freezing ground. The warm air blowing over the cold land causes ice and snow to change from solid to gas without a liquid phase, a process known as ‘sublimation’. The result is a blanket of thick condensed vapour.
Warm katabatic winds
Some katabatic winds form on the lee side – sheltered side – of mountains. As the wind descends, it heats as a consequence of the air mass being compressed. The temperature of the wind can rise by 20°C (36°F) above the surrounding area, and several of the world’s locally named winds, such as North America’s Chinook, Switzerland’s Fohn, France’s Mistral and California’s Santa Ana, are formed in this way. They are also termed ‘orographic winds’ in that they are raised up over mountains before descending on the lee side.
Hot winds
During the summer of 1860, the temperature in Alabama, Mississippi, Louisiana and Missouri was hovering around 38°C (100°F) for several days non-stop; but the hottest experience was a searingly hot wind, just 90 m (300 feet) wide, that ploughed across central Georgia scorching cotton crops on a number of plantations. At Kansas, several people were left choking from the fiery blast. The temperature of the wind was reported to be 50°C (122°F).
![]()
FACT
On 23 February 1911, a schoolgirl entered an open playground in Bradford, England, in very windy weather. A violent gust picked her up and carried her some 6 m (20 feet) into the air. She then dropped and died on impact with the ground.
The oldest weather-measuring device is probably the weathervane, a simple flat object (vane) that swings around to indicate the direction from which the wind is blowing. The vane is often crafted in the shape of an animal, its head pointing into the wind. In Christian countries the most common shape is the cockerel, which started to appear on church roofs, spires and towers in the ninth century, to remind parishioners of the cock that crowed thrice when St. Peter denied three times that he knew Jesus Christ.
Wind speed measurement
The first wind-speed device was a revolving disc anemometer (from the Greek word anemos meaning ‘wind’) invented by Italian architect Leon Battista Alberti in 1450. Wind is measured today, however, by the spinning cup anemometer, a device with four hemispherical cups attached to a spindle that spins around when blown by the wind.
Wind speed categories
Mariners have always depended on the direction and strength of the wind, but it was not until 1805 that a standard method of wind speed measurement was introduced. Prior to this, although naval officers made regular weather observations, these were very subjective – one man’s ‘stiff breeze’ could easily have been another man’s ‘calm conditions’. Then, in 1805, Sir Francis Beaufort – an Admiral of the British Navy – introduced a simple scale for recording wind strength at sea. It is known as the Beaufort Scale, or the Beaufort Wind Force Scale. Originally based on the effect the wind had on a ship’s sails – from ‘just sufficient to give steerage’ to ‘that which no canvas [sails] could withstand’ – in 1906, with the advent of steam power, the descriptions were changed to the effect of the wind on the sea. It was later adapted for use on land. It is divided into ‘forces’, as listed in the table opposite, with specific signs on land and at sea for each force.
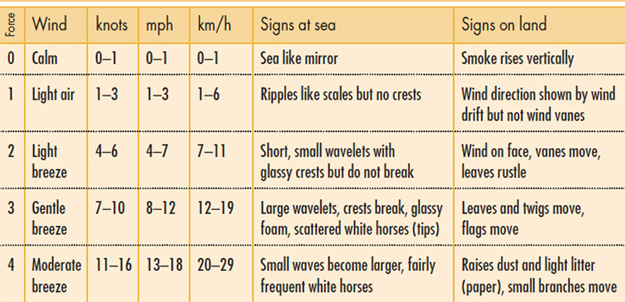
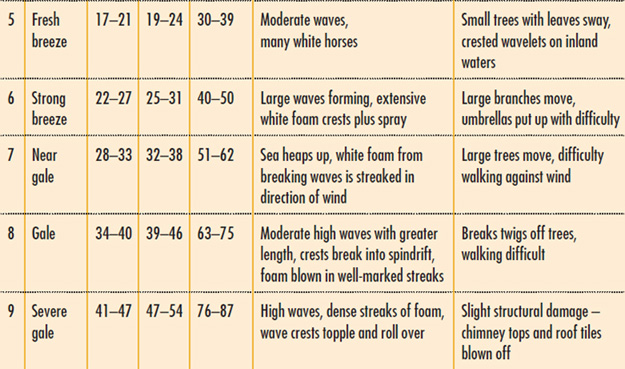
(Based on Observers Handbook, Met Office)
Hurricanes are probably the most powerful storms on Earth. Exceptionally high winds, incredible rainfall and battering storm surges accompany hurricanes and these can devastate entire coastal areas, destroying everything in their path and killing people living there. It has been estimated that during its life a single hurricane can use as much energy as 10,000 nuclear bombs.
What’s in a word?
The word ‘hurricane’ comes from the Central American god of evil Hurucán (from the Arawak language meaning ‘storm’) who was familiar to the Taíno tribe of the Greater Antilles in the Caribbean. It is used today to describe tropical storms in the Atlantic and Eastern Pacific. In the western Pacific and China Sea they are known as ‘typhoons’, from the Cantonese word tai-fung, meaning ‘great wind’. Around the Indian subcontinent and Australia they are called ‘cyclones’, although Australians also adopt the term ‘willy-willy’.
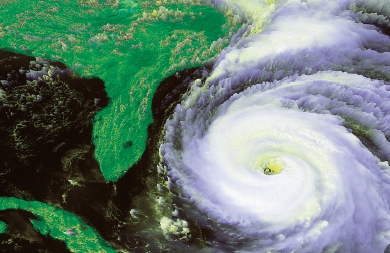
A satellite image of Hurricane Fran, just before it made landfall on the east coast of the United States in September 1996.
The rise of a hurricane
The hurricane season in the North Atlantic and North Pacific is usually between June and November, and between January and March in the Southern Hemisphere. The most vulnerable areas lie in the ocean between latitudes 8° and 20° North and South. Here, high humidity, light winds and warm sea-surface temperatures are the ingredients that make for a high-intensity tropical storm.
Tropical disturbance: A hurricane begins to develop when a cluster of thunderstorms, known as a ‘tropical disturbance’, appear over the tropical ocean. Most North Atlantic hurricanes that hit North America are derived from tropical disturbances that travel from east to west, having originally formed over West Africa.
Developing force: Where a hurricane is developing, the air pressure drops when water vapour condenses, releasing latent heat. The warming air rises, expands and then cools, causing more water vapour to condense, and so on until a chain reaction feeds the system and the pressure drops even more. The lower surface pressure encourages additional warm, moist air to flow in, resulting in the formation of more thunderstorms and higher winds. The Coriolis effect causes the winds to rotate in a counterclockwise manner (in the Northern Hemisphere), and they become increasingly strong. The air flowing out the top of the centre of the storm circles down towards the ground forming super-strength winds.
Tropical storm: When the persistent wind speed is 37 km/h (23 mph) the tropical disturbance is considered a ‘tropical depression’, and when the winds blow at 63 km/h (39 mph) it becomes a ‘tropical storm’. At this point it is given a name. Tropical storm names were exclusively female until 1953, but since 1979 male and female names alternate. When the wind speed increases to 119 km/h (74 mph) the storm is officially a ‘hurricane’.
Anatomy of a hurricane
The eye: At the centre of a hurricane is the ‘eye’. It resembles a chimney with a diameter of 10–65 km (6–40 miles), and it has no clouds, light winds and sinking air. It is the calmest part of the storm.
Eye wall: Surrounding the eye is the ‘eye wall’. It is a ring of violent thunderstorms and extremely high winds that deliver a deluge of rain. The highest winds are on the side of the wall that runs parallel to the direction of forward movement of the storm. If the storm is heading due west, for example, the highest winds will be on the northern wall. The result is a combination of the forward motion and the wind itself to create superwinds.
Spiral centre: Outside the wall are bands of heavy rain that form in a spiral centred on the eye of the storm – the so-called ‘spiralling rain bands’. The strength of wind and rain here can be as half as much as in the eye wall.
Storm surge
Accompanying the storm can be a rise in sea level of up to 10 m (33 feet), and this dome of water can be 80–160 km (50–100 miles) across. When it sweeps over the coastline, any shoreline structure, such as marinas, piers, docks, oceanside housing developments, bridges, roads and railways, can be seriously damaged or even destroyed by a wall of water.
![]()
FACT
The energy in an average hurricane, if harnessed and converted into electricity, could supply power to the entire United States for up to three years.
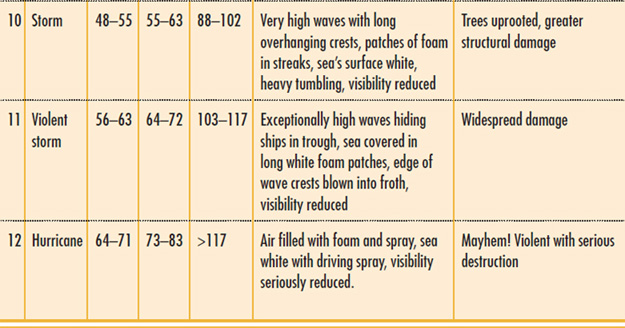
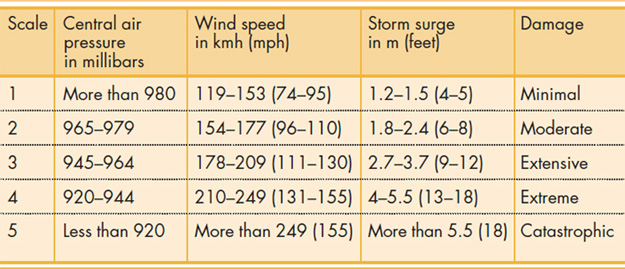
Saffir-Simpson hurricane scale
The Saffir-Simpson Scale for measuring hurricanes was devised in the 1970s by consultant engineer Herbert Saffir and meteorologist Robert Simpson. It consists of five categories that recognise the press, wind speed and storm surges associated with a hurricane.
Future hurricane names
Names for new hurricanes are determined in advance by the World Meteorological Organisation, using six lists in rotation. If names are not used in one year they are set aside for the list in six years’ time. The following name lists have now been issued:
|
Year |
Hurricane name |
|
2006 |
Alberto, Beryl, Chris, Debby, Ernesto, Florence, Gordon, Helene, Isaac, Joyce, Kirk, Leslie, Michael, Nadine, Oscar, Patty, Rafael, Sandy, Tony, Valerie, William |
|
2007 |
Andrea, Barry, Chantal, Dean, Erin, Felix, Gabrielle, Humberto, Ingrid, Jerry, Karen, Lorenzo, Melissa, Noel, Olga, Pablo, Rebekah, Sebastien, Tanya, Van, Wendy |
|
2008 |
Arthur, Bertha, Cristobal, Dolly, Edouard, Fay, Gustav, Hanna, Iko, Josephine, Kyle, Lili, Marco, Nana, Omar, Paloma, Rene, Sally, Teddy, Vicky, Wilfred |
|
2009 |
Ana, Bill, Claudette, Danny, Erika, Fred, Grace, Henri, Ida, Joaquin, Kate, Larry, Mindy, Nicolas, Odette, Peter, Rose, Sam, Teresa, Victor, Wanda |
|
2010 |
Alex, Bonnie, Colin, Danielle, Earl, Fiona, Gaston, Hermine, Igor, Julia, Karl, Lisa, Matthew, Nicole, Otto, Paula, Richard, Shary, Tomas, Virginie, Walter |
Great Hurricane
This was the deadliest known hurricane. In October 1780 it ploughed into the Caribbean islands of Martinique, St. Eustatius and Barbados. It was at the time of the American Revolution and it destroyed many ships in the British and French naval fleets that were vying for control of the region. It was one of three powerful hurricanes to hit the area in succession, and it coincided with a record peak in sunspot activity.
Hurricane Mitch
Mitch was one of the most powerful hurricanes ever recorded. Maximum sustained wind speeds of 290 km/h (180 mph) battered Central America in October and November 1998. Most of the damage occurred in Honduras and Nicaragua, where people died in mudslides and flooding.
Galveston Hurricane
On 8 September 1900, an enormous storm surge caused by a hurricane with 200 km/h (125 mph) winds swept over Galveston, Texas, killing more than 8,000 people and destroying 3,636 homes. It was the largest death toll caused by a hurricane in US history.
|
Season |
Hurricane |
Human deaths |
|
Oct 1780 |
Great Hurricane |
22,000 |
|
1998 |
Hurricane Mitch |
Up to 18,000 |
|
Sept 1900 |
Galveston Hurricane |
Up to 12,000 |
|
Sept 1974 |
Hurricane Fifi |
Up to 10,000 |
|
Sept 1930 |
Dominican Republic Hurricane |
Up to 8,000 |
Labor Day Hurricane: On 2 September 1935, the first category 5 hurricane reported in the United States came ashore at the Florida Keys. Sustained winds were in excess of 250 km/h (155 mph) and gusts reached 338 km/h (210 mph). Of the 423 people killed, 259 were World War I veterans building a bridge from the mainland to the Keys.
Hurricane Camille: Camille made landfall at Pass Christian, Mississippi, on 20 August 1969, with sustained winds reaching 305 km/h (190 mph) and gusts over 335 km/h (200 mph). About 256 people were killed and almost 9,000 injured. Damage was not only from the wind, but also from a 7.3 m (24-foot) high storm surge that swept in from the Gulf of Mexico.
Hurricane Andrew: Andrew, a category 5 hurricane, first hit the Bahamas on 23 August 1992, then made landfall on the United States at Homestead, Florida, with sustained winds of 265 km/h (165 mph) and gusts of 291 km/h (181 mph). 41 people were killed and over 250,000 people were left homeless. A few days later it moved into the Gulf of Mexico, coming ashore at Burns Point, Louisiana, as a category 3 storm and spawning 47 tornadoes that devastated southern and mid-Atlantic states.
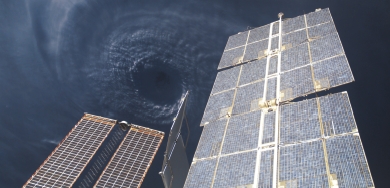
The eye of Hurricane Ivan, the most powerful hurricane of the 2004 Atlantic season. This photograph was taken from on board the International Space Station.
Hurricane Katrina was the second Category 5 hurricane of the 2005 season, and the sixth strongest ever recorded. The storm formed over the Bahamas on 23 August, but after crossing Florida as a Category 1 hurricane, it gained strength in the Gulf of Mexico. By 28 August, it had increased to Category 5, the air pressure at its centre dropping to 902 millibars and sustained winds reaching 280 km/h (175 mph), making it the strongest hurricane ever recorded in the Gulf.
By its second landfall near Buras-Triumph, Louisiana, on 29 August, and a third on the Louisiana/Mississippi border a few hours later, Katrina had become a Category 3 hurricane, but its vast size meant that it devastated areas over 190 km (120 miles) from its centre with sustained winds of 195-205 km/h (120-125 mph). Levees separating Lake Pontchartrain from New Orleans were breached and 80 per cent of the city was flooded.
Katrina maintained hurricane-strength until close to Jackson, Mississippi, 240 km (150 miles) inland, and downgraded again near Clarksville, Tennessee, where it broke in two. The death toll as of March 2006 is 1,604, with over 2,000 people still unaccounted for.
The National Guard patrolling central New Orleans in the aftermath of Hurricane Katrina. At this time much of the city was underwater.
1958 typhoon season
The typhoon season in the Pacific usually lasts from June until December, but in 1958 it ran all year. In January, for example, Typhoon Ophelia’s 260 km/h (160 mph) winds devastated Jaluit in the Marshall Islands. In May, following a procession of smaller storms, Super-Typhoon Phyllis had winds peaking at 298 km/h (185 mph), the strongest ever recorded in the region, but it remained over the open sea. In July, Super-Typhoon Winnie blasted through Taiwan and southeast China with 282 km/h (175 mph) winds, while in August the windswept region was host to Typhoon Flossie, which hit Tokyo, with many casualties. In September, Super-Typhoon Helen hit southeast Japan again before heading north, and in the same month Super-Typhoon Ida devastated the Japanese island of Honshu. Over 48,560 hectares (120,000 acres) of rice fields and 2,118 buildings were destroyed with 1,269 casualties.
Windy and wet typhoon
On 28 August 1992, Typhoon Omar slammed into Guam, the strongest since Typhoon Pamela in 1976. Gusts up to 275 km/h (170 mph) and 416.9 mm (16.41 inches) of rain were recorded at Andersen Air Force Base. And on 17 December 1997 events were repeated (but even more so) when Typhoon Paka crossed the island with winds gusting to 381.3 km/h (236.9 mph) and dumping 535 mm (22 inches) of rain before the rain monitoring equipment failed.
![]()
FACT
On 15 August 1291, a typhoon moving across the Sea of Japan destroyed an entire Mongol invasion fleet. It became known as the ‘Divine Wind’ or ‘Kamikaze’.
Lowest of the lows
The most intense storm ever recorded was Typhoon Tip, which blew up in the northwest Pacific Ocean on 4 October 1979. Its eye had a minimum pressure at the sea’s surface of only 870 millibars – the lowest pressure recorded to date – and maximum sustained winds of 306 km/h (190 mph). It was also the world’s largest tropical storm system with a circulation 2,174 km (1,350 miles) across.
Name change ... and back again!
Hurricane John, which formed on 11 August 1994, was the longest-lived tropical storm with a life span of 31 days. During its 13,000 km (8,000 mile) journey around the Pacific, it crossed the international dateline twice and in doing so switched from being Hurricane John to Typhoon John and back again.
Mighty cyclones
On 20 May 1999, a cyclone with winds in excess of 275 km/h (170 mph) hit the Sindh Province of southern Pakistan. More than 400 people were killed and 600 villages destroyed.
On 13 November 1970, a cyclone swept across Bangladesh, pushing a 15 m (50-foot) high storm surge ahead of it. Over 500,000 people were killed and a further 50 million were affected by the storm.
On 15 December 1999, Cyclone John ran into the northwest of Australia with winds gusting up to 260 km/h (162 mph). It was the strongest cyclone to hit the island continent in 100 years, but luckily it blew over mostly uninhabited areas. Cyclone Tracey was not so fortunate. It did not measure up to Cyclone John’s power, but on 25 December 1974 its 217 km/h (135 mph) winds destroyed much of the city of Darwin and killed 65 people. It was also the world’s smallest tropical storm with a circulation just 50 km (30 miles) wide.
A tornado starts as a severe thunderstorm known as a ‘supercell’. Winds entering the storm begin to swirl and form a tight funnel. The wind in the funnel spins increasingly faster, creating an extremely low pressure that sucks in more air and any object lying in its path. In the United States, the vast, flat Great Plains enable dry polar air from Canada to meet warm moist air from the Gulf of Mexico, so in Oklahoma, Texas, Kansas and Nebraska conditions are ripe for tornadoes to form. It has the highest concentration of tornadoes anywhere in the world, and is a magnet for ‘storm chasers’.
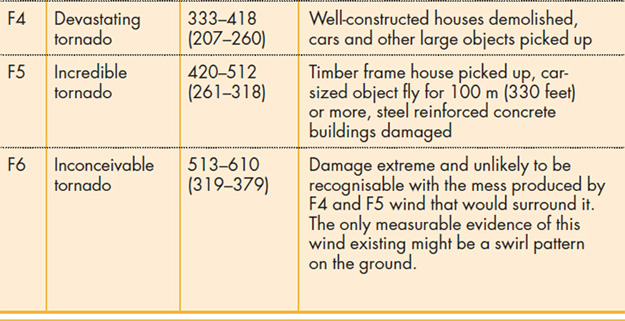
Fujita-Pearson Scale for measuring tornadoes
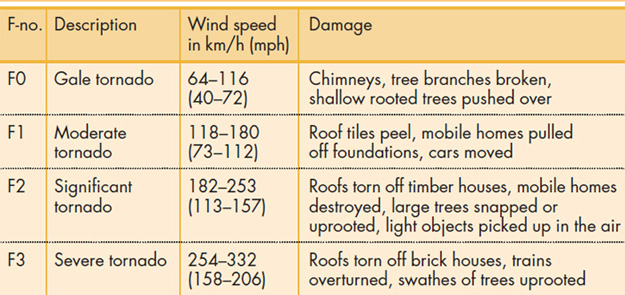
Killer tornadoes
About 1,000 reported tornadoes track across the United States each year, but year-by-year casualties are falling. Tornadoes causing large numbers of deaths occurred mostly in yesteryear. With better tornado prediction and detection and quicker communications, killer tornadoes are far fewer today.
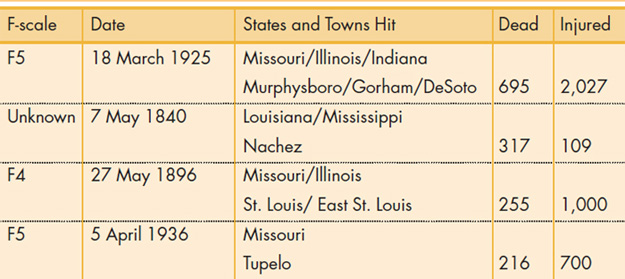
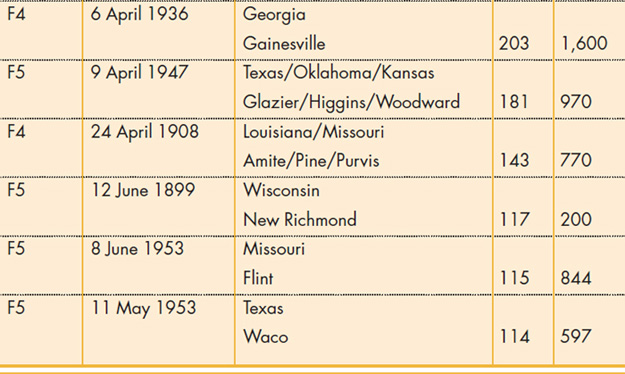
Killer tornadoes in the United States
![]()
FACT
The Great Bend tornado that sliced through a part of Kansas in 1915 undoubtedly had the most oddities among its storm debris. Five horses in a barn on a farm at Pawnee Rock were flown, uninjured, a distance of 0.4 km (a quarter of a mile) and were still attached to their rail.
Tornado day
On 3 April 1974, several destructive tornadoes occurred in 11 states and Ontario, Canada, during a single eight-hour period. In Ontario alone nine people were killed and 30 were seriously injured. Damage amounted to $1 billion.
Top wind speed
On 3 May 1999, the University of Oklahoma Doppler-on-Wheels radar unit recorded the wind in an F5 tornado and it was found to be blowing at a speed of 512 km/h (318 mph) about 40 m (130 feet) above the ground. This is the highest natural wind speed recorded to date.
French whirlwind
Europe is not often in the news for its devastating tornadoes, but on 19 August 1845 a tornado destroyed homes and mills near Monville, France, killing up to 200 people. It was one of Europe’s most devastating tornado disasters.
English tornado
The strongest tornado recorded in Britain struck the suburbs of Birmingham, England, on 28 July 2005. Winds blew up to 210 km/h (130 mph), uprooting trees, picking up cars and injuring people. Surprisingly, Britain has more tornadoes, relative to its land area, than any country in the world.
Not all whirlwinds are large. A letter in the respected journal Nature in 1935 describes a dust devil – a rotating column of sand that moves rapidly over open spaces – just 1.5 m (5 feet) high with a column less than 30 cm (12 inches) across that moved along at about 24 km/h (15 mph). The correspondent also recalled a revolving 2.54 cm (1 inch) thick sheet of sand and plant debris just 30 cm (12 inches) high, but with a diameter of 3.7 m (12 feet). It revolved around him for about three minutes, producing a ‘swishing sound’ before slowly dying away. Locally these miniature dust devils are considered to be spirits, so-called afrit or ginni (the genie of the Arabian Nights).
Steam devil
On 30–31 January 1971, the air temperature barely reached above -21°C (-6°F) off the Milwaukee shoreline of Lake Michigan. Steam fog accumulated over the lake surface, with revolving columns up to 200 m (656 feet) in diameter reaching up over 460 m (1,500 feet) into the cumulus clouds above. The ‘steam devils’ lasted no longer than a few minutes.
Fiery winds
Flaming cylinder: On a farm 8 km (5 miles) from Ashland in Cheatham County, Tennessee, in the summer of 1869, a fiery whirlwind scorched everything in its path. The ‘flaming cylinder’ travelled at about 8 km/h (5 mph), singeing the leaves on trees and burning the manes and tails of horses feeding in a field. Heading towards the farmhouse, it first set a haystack alight and then the shingles, so that after ten minutes the entire building was ‘wrapped in flames’. It finally reached a river, where it raised a column of steam that stretched right up to the clouds and then slowly fizzled out. Over 200 people witnessed the extraordinary event.
Wind fireworks: In 1881, near Americus, Georgia, a small whirlwind formed over a cornfield. It had a diameter of about 1.5 m (5 feet) and was about 30 m (100 feet) high, but its centre was ‘illuminated by fire’ and it emitted a ‘strange sulphurous vapour’. It occasionally split into three smaller clouds. As the clouds came back together, eyewitnesses heard a loud crash accompanied by cracking sounds, and then the whole thing shot up into the sky.
Dust storms
Between 14 and 24 March 2002, a huge dust storm raged across southern Asia. Driven by high winds, the dust was stirred up in the deserts of Mongolia and northern China, and was then carried across China, Korea and southeast Russia, creating the worst dust storm for 40 years. The dust-laden winds then headed out across the Pacific.
Electrical tornado
On 24 May 1949, a small tornado travelled across a clay tennis court at Curepipe, on the island of Mauritius in the Indian Ocean, and left behind a shallow trench 18 m (60 feet) long, 60 cm (2 feet) wide and up to 100 mm (4 inches) deep. A ball of bright light and a crackling sound like a ‘sugar cane fire’ accompanied the tornado. Material from the trench, including blocks weighing up to 0.5 kg (1 pound) each, was carried to a distance of 15 m (50 feet). An umpire’s chair weighing 23 kg (50 pounds) was carried 18 m (60 feet) into the air. What caused the scorching remains a mystery.
Inside tornadoes
Several eyewitnesses have observed the inside of tornado funnels and lived to tell their tale. They describe a light show of electrical phenomena, such as continuous lightning, brightly shining luminous clouds, great balls of fire and even a display ‘like a Fourth of July pinwheel’. ‘St. Elmo’s fire’ (electrical activity in the atmosphere) has been observed near the funnel mouth, along with buzzes and hissings indicative of electrical activity. The smell of ozone and nitrous oxides often pervades the air.
![]()
FACT
On 12 May 1934, a black blizzard containing topsoil from the ‘Dust Bowl’ dumped 12 million tons of dust on Chicago.