12.1 Introduction
In vivo imaging of corneal cells has been pioneered by confocal scanning laser microscopy (cSLM) and the availability of commercial devices. With the combination of the Heidelberg Retina Tomograph (HRT , Heidelberg Engineering GmbH) and the Rostock Cornea Module (RCM) a unique device using confocal point scanning technology was introduced in 2002 [1]. Since then, the HRT-RCM serves as a well-established instrument in experimental and clinical ophthalmology. The system represents an important device for ex and in vivo studies of animal and human corneas for a qualitative and partly quantitative analysis of corneal and limbal structures.
CSLM is a non-invasive imaging technique which generates transversal images (also called en-face images), with high resolution and excellent depth discrimination. Sequential acquisition of tomograms along the depth direction allows for 3D reconstruction of the volumetric data stack. The imaging procedures cover a broad range of experimental and clinical applications. For example, cSLM serves as a multifunctional tool for corneal analysis of laboratory animals [2], it allows for assessing stromal changes in patients with keratoconus before and after cross-linking [3], for experimental full-thickness corneal 3D imaging [4], and for the quantification of morphology of epithelial cell layers and the subbasal nerve plexus (SNP) [5]. Intense research is focused on large-scale image reconstruction of the SNP [6–11], because it has the potential to serve as biomarker for early neurodegenerative changes [12].
While OCT imaging is very promising for corneal cross-sectional imaging, confocal scanning laser microscopy still offers superior lateral resolution combined with higher imaging quality. Various 3D reconstruction techniques of confocal image stacks are published. Volume imaging with a tandem scanning confocal light microscope is demonstrated by research as described in [13], but image quality and resolution are reduced compared to cSLM based methods . Volume imaging with the HRT-RCM is described in [5, 14, 15].
This chapter summarizes the principles of confocal scanning laser microscopy and the technical implementation in the HRT-RCM. A selection of ophthalmological and non-ophthalmological applications is presented and current and future developments are shown.
12.2 Principle of Confocal Scanning Laser Microscopy
The development of confocal imaging was largely driven by cell biology and the desire to observe biological events in vivo. In the early twentieth century, techniques for fluorescent staining of cellular structures have paved the way for fluorescent microscopy. With the intention to study neurons and their function at a cellular level, Marvin Minsky developed and patented the principle of confocal scanning microscopy in 1957 [16]. The fundamental idea is to illuminate the sample pointwise and to detect the reflected light pointwise, which means that the image build-up takes place sequentially. As a consequence, it was not before the 1980s that the full potential of this technique could be exploited: The rapid progress in laser and scanning technology as well as digital processing and storage abilities paved the way for a more efficient technical implementation of the confocal imaging principle. In vivo imaging at sub-cellular resolution and in real time became feasible.
In conventional microscopy, the specimen is flood-illuminated, meaning that backscattering occurs for the whole illuminated field within the tissue simultaneously. The optical imaging system generates an image where, for each tissue location, also stray light from the vicinity contributes to the final image. This crosstalk leads to a noisy background signal and impacts the visibility of small and faint tissue structures. For a thick specimen, many fluorophores—not only those within a thin slice in depth—contribute to the final image. Therefore, the preparation of very thin samples is needed to get any depth information at all.

The principle of confocal illumination and detection: Using an aperture, a light source is imaged to illuminate a single spot within the specimen. With the same objective lens the backscattered (or fluorescent) light originating from this spot is imaged on the detector. The detector pinhole removes all light from outside the focal plane
Confocal reflection imaging reveals the backscattering or reflecting properties of the specimen. Elastic scattering preserves the photon energy, i.e. the wavelength of the backscattered light is not shifted with respect to that of the illuminating light. However, the backscattering efficiency or scattering cross section generally is wavelength dependent. In confocal fluorescence imaging the tissue is either stained with fluorophores or shows intrinsic (auto-) fluorescence. Additional optical barrier filters are needed to block the excitation light, thereby allowing for selectively detecting fluorescence light of a specific wavelength or wavelength range. Some selected applications of confocal fluorescence imaging in ophthalmology can be found in Chap. 2.
In vivo imaging of the eye is particularly demanding due to eye motion, which makes acquisition speed crucial. The first confocal scanning laser ophthalmoscope was presented by Webb et al. [17] in the 1980s, demonstrating imaging of the ocular fundus. Since then, retinal confocal imaging has developed into a routine application in clinical practice. Without any additional measures (i.e. adaptive optics), the optical resolution of retinal images is limited to about 15 μm. Both the finite pupil size and optical aberrations of the eye account for this and imaging at sub-cellular level cannot be achieved.
In contrast, confocal microscopy is feasible for the anterior segment of the eye. As the eye is not part of the imaging system—or only to a very limited extent—microscope lenses with high numerical aperture (NA) can be used. Employing a tandem scanning confocal microscope, Cavanagh et al. demonstrated in vivo imaging of the human cornea in 1989 [18]. Confocal imaging provides a much higher optical resolution and optical sectioning capability than a slit-lamp biomicroscope, which is limited to a magnification of about 40× and an optical resolution of about 20 μm.
Different types of confocal microscopes have been described for use in ophthalmology, which mainly differ in their principle idea to scan the specimen. The tandem scanning confocal microscope (TSCM) uses the basic idea of the Nipkow disc—a rotating disc equipped with a spiral array of pinholes and was originally developed by Petran and Hadravsky [19]. The specimen is illuminated and sampled in parallel by a set of conjugate pinholes arranged along concentric circular traces. A bright light source is required, usually a xenon or mercury arc lamp. This allows for true-color and real-time imaging, but has the disadvantage of a very low light throughput and therefore rather low image quality and contrast. The image is observed with the eye. The system is no longer commercially available.
The concept of the scanning-slit confocal microscope (SSCM) was developed by Thaer et al. [20, 21]. A sheet of light is scanned over the back focal plane of the microscope objective, thereby illuminating the specimen with a slit of light and detecting the backscattered light with a line sensor. The parallel illumination and detection allows for considerably increasing acquisition speed but with the drawback of reduced optical resolution. Confocality is maintained only along one spatial direction, resulting in anisotropic lateral resolution and degraded depth resolution.
Nowadays, laser diodes are commercially available at a variety of different wavelengths from the visible to the infrared region. Due to their compact design and simple control they can easily be integrated into imaging systems. When combined with beam shaping optics, laser can provide small spot sizes and high radiant flux, thereby allowing for a very efficient illumination and detection. Spot illumination eliminates the need for an illumination pinhole. Such confocal point scanning systems have superior signal-to-noise characteristics and allow for a laterally isotropic resolution and for an optimum depth sectioning ability. Nevertheless, in order to reach high frame rates the requirements for the scanning unit are demanding. The HRT-RCM represents a confocal microscope of this type and will be introduced in more detail in the next section.
The theory of confocal microscopy was more formally developed and extended by Wilson and Sheppard [22]. The superior optical performance of a confocal setup is reflected by its point-spread function (PSF) . Generally, the 3D PSF describes the intensity distribution in the image space of an optical imaging system resulting from a point source object . Depending on the imaging properties, the point image may be blurred in the presence of optical aberrations, in the ideal case it is limited by diffraction only. In this case, the central maximum of the 3D PSF, which contains nearly 90% of the total energy available, can be described as an ellipsoid of rotation.
For considerations of resolution and optical slice thickness, it is useful to define the area in which the intensity of the PSF in lateral and axial direction has dropped to half of its central maximum , respectively. In the transversal plane, this condition confines an area corresponding to the central bright disc of the concentric diffraction pattern. In the perpendicular plane it defines a double cone or hourglass along the optical axis, i.e. in depth z. The two characteristic measures are given by the beam waist Δx and the confocal parameter b, which corresponds to half the Rayleigh range z R.
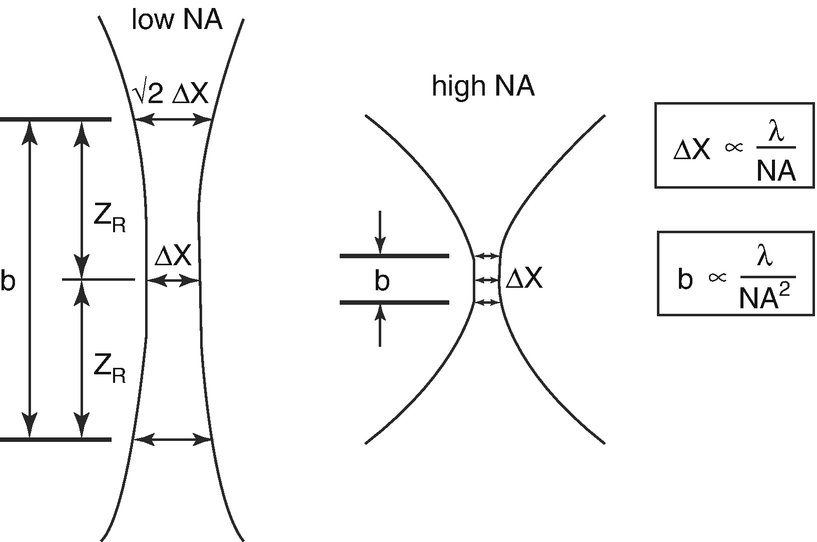
The numerical aperture (NA) determines the lateral image resolution and the depth of field. Lateral resolution is characterized by the beam waist Δx of the focused laser spot, depth of field is specified by the confocal range b or Rayleigh range zR
In contrast to conventional microscopy, the optical performance of the confocal system is determined by two PSFs: the illumination PSF ill, which describes the intensity distribution of the scanning laser focus in the object space and the detection PSF dec, which accounts for the projection of a point object into the image space. Both depend on the wavelength and numerical aperture (NA) as was shown above. In addition, PSF dec is determined by the size of the detection pinhole. The imaging properties of a confocal system are defined by the final PSF tot, which mathematically is described as the product of both single PSFs. It can be shown that PSF tot is always less than or equal to PSF ill, whereby the size of the detection pinhole plays the decisive role in resolution and depth discrimination. It controls the continuous transition from object information suppressed and such made visible. If the pinhole size is larger than the central disc of the diffraction pattern described above, the resolution is governed by PSF ill and there is no difference compared to conventional imaging. As the pinhole becomes smaller, PSF dec approaches PSF ill, which results in a superior resolution compared to conventional imaging. It can be shown, that in the limit of PSF dec = PSF ill, the lateral resolution and the depth discrimination are both improved by a factor of about 1.4 [23].
In practice, there is a trade-off between resolution and detection sensitivity. The size of the pinhole is adapted as to narrow the PSF dec as much as possible while still allowing enough photons passing through and being detected. The main benefit of confocal imaging is not the rather modest increase in optical resolution. The fundamental improvement results from the suppression of out-of-focus light, which allows to optically slice a specimen. Then, a depth (z) position can be assigned to each image and volumetric imaging for intact and living specimens becomes feasible.
12.3 In Vivo cSLM with the Rostock Cornea Module
The Heidelberg Retina Tomograph (HRT, Heidelberg Engineering GmbH) was the first commercial confocal scanning laser ophthalmoscope (cSLO) which was widely used in a clinical setting for glaucoma diagnosis. It was brought to market in the early 1990, the next generations of the device, called HRTII and HRT3, were released in 1998 and 2005, respectively.
The HRT uses point scanning to acquire a 3D stack of tomograms of the optic nerve head, which allows for its topographic analysis. A normative database is used to compare individual data with those of healthy and early-glaucoma patients. Follow-up examinations and progression analysis have shown to be highly beneficial in glaucoma care. The device enabled for routine screening in a clinical and medical practice setting.
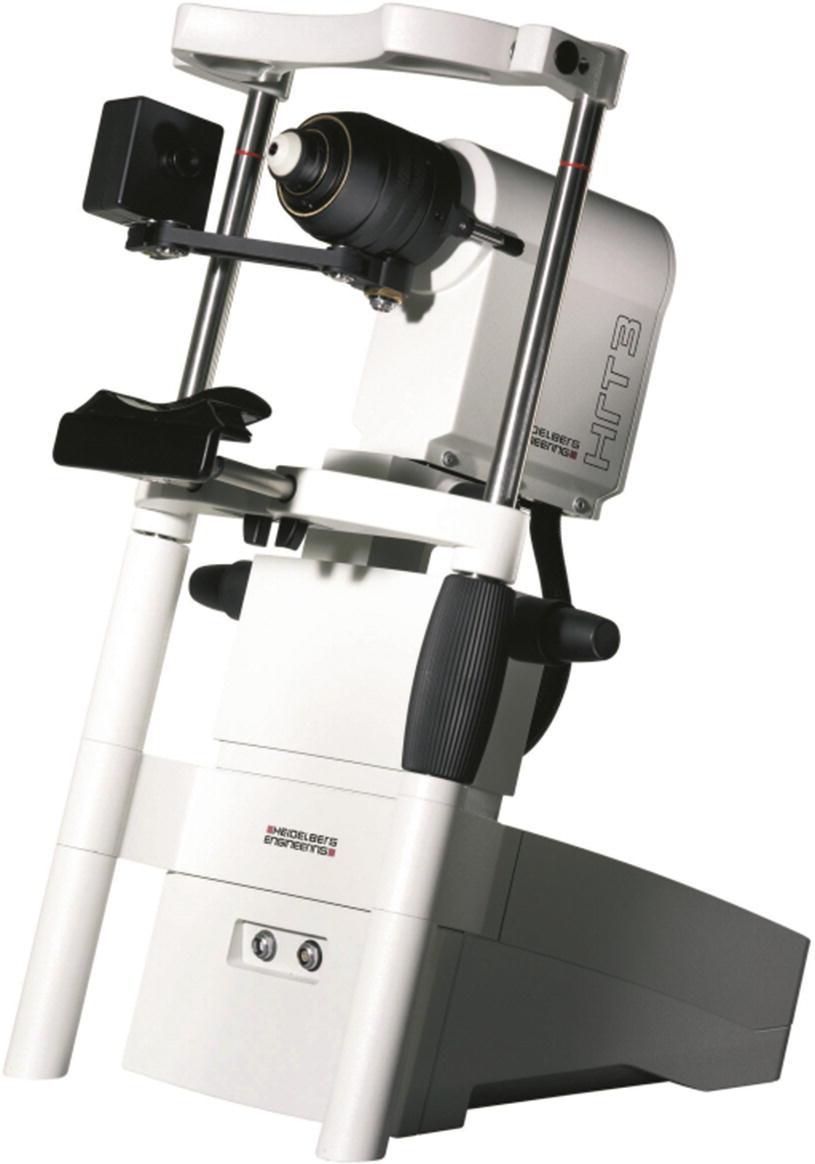
The Heidelberg Retina Tomograph (HRT3) is a confocal scanning laser ophthalmoscope which allows for analysis of the optical nerve head. In combination with the Rostock Cornea Module (RCM), which is attached to the HRT, confocal microscopy of the cornea is feasible
The HRT camera head integrates all core components required for confocal imaging—a light source, a scanning unit and a photodetector. Although the principal setup is the same for corneal imaging, the RCM objective changes the imaging parameters in a fundamental way. Image generation is briefly explained in the following section, where differences between corneal and retinal imaging are pointed out.
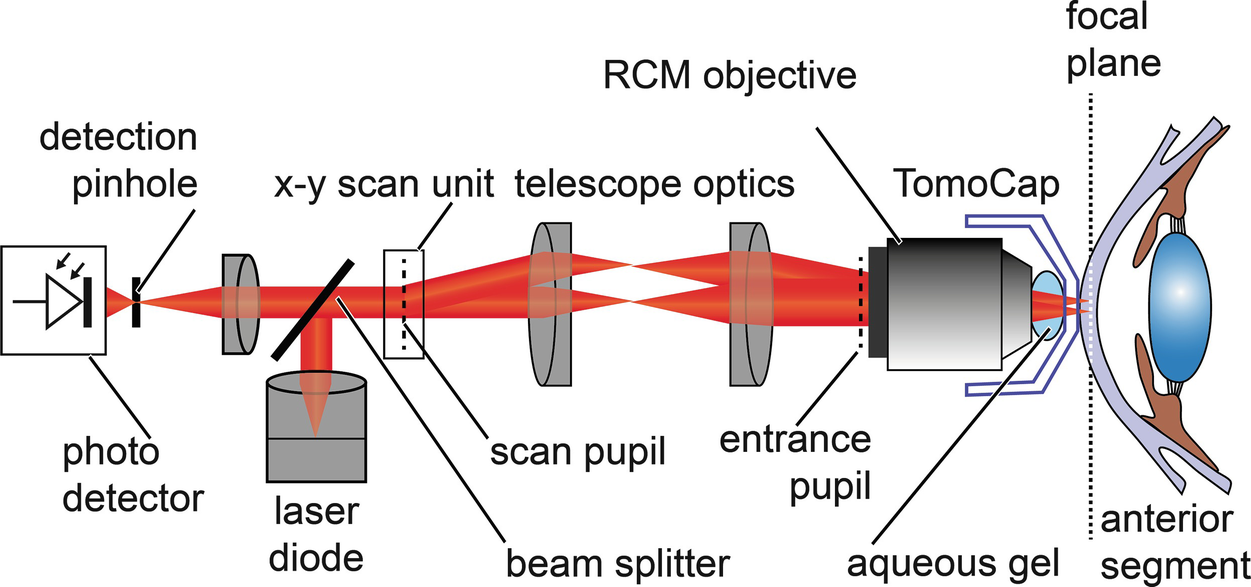
Principle setup of the confocal scanning laser microscope (cSLM): The HRT-RCM uses the light source and the scanning and detection units of the HRT. The RCM objective changes the imaging parameters to allow for microscopic imaging. The water immersion lens is coupled to the cornea with a single-use contact element
The scanning and detection scheme are the same for both, the HRT and the HRT-RCM. The collimated beam of a red laser diode (670 nm) is deflected by a beam splitter and enters the x-y scanning unit. To acquire a two-dimensional transversal image of the specimen the beam is deflected in two perpendicular directions. A resonant x-scanner supports a line rate of 16 kHz, a galvanometer scanner is used for the slower y-scan, thereby providing a raster scan.
The scan pupil is relayed by means of telescope optics to the entrance pupil of the RCM objective. The core component of the RCM is a water-immersion microscope lens with a high numerical aperture. It provides a focus at a distance of a few millimeters in front of the apex of the lens. The cornea or any other tissue under examination is positioned in the focal plane. From each illuminated point, backscattered light travels the same path back and is separated from the illumination path by the beam splitter . The signal is detected by an avalanche photo diode, which has a detection pinhole to ensure confocality. The output signal of the photodetector is sampled with a pixel clock of 12 MHz while the x-y scanning unit performs a transversal raster scan. Each digitized value is assigned to the corresponding pixel in the confocal image. The final image consists of 384 × 384 pixels and represents the backscattering properties of a thin transversal slice within the tissue. A frame rate of about 30 Hz allows for real-time imaging.
For volumetric imaging the focal plane has to be shifted axially to change the depth position of the image. The RCM has a mechanical z-feed, which allows for manual fine adjustment of the focus plane within a range of approximately 1.7 mm. In addition, the focal plane can be shifted optically within a range of 80 μm.
In the following, some important imaging details and components are described in more detail. The interesting reader can find more details on the HRT in Chap. 2. As can be recognized from Fig. 12.4, the pivot point of the scanning unit is optically transferred to the entrance pupil of the RCM objective. This pupil can be seen as the origin of a collimated beam being deflected by virtual scanners. Ideally, it is brought to coincide with the entrance pupil of the microscope lens. The large numerical aperture of the microscope lens (Achroplan 63×/W, NA 0.95, Zeiss) provides a high optical resolution and depth discrimination. The axial position of the focal plane measured from the front lens’ apex equals 2.2 mm and is called working distance.
The cornea or specimen is optically coupled to the imaging device using an aqueous gel of high viscosity and a sterile, single-use contact element—the TomoCap. The TomoCap is a thin, transparent cap made of PMMA, which touches the cornea with its flat front surface during the imaging procedure.
In contrast to retinal imaging, where the eye is an integral part of the imaging process, cSLM allows to set the magnification and resolution independent of the imaged object. Essentially, the microscope lens determines the optical parameters and must be selected accordingly.
The cornea has an average refractive index of n = 1.376, the main constituent being water. Therefore, water-immersion microscope lenses are the best choice. They are optimized for imaging in aqueous solution, i.e. for a medium with a refractive index of 1.33. They minimize spherical aberration while imaging through an aqueous specimen and they potentially provide higher numerical apertures compared to non-immersion types, as the focus is sharper and the acceptance angle to collect backscattered light is larger (by a factor of 1.33).
Any change in refractive index along the optical pathway gives rise to back reflection, which introduces signal loss and potentially can lead to ghost reflections. Therefore, the aqueous gel also has to be applied to bridge the air gap between the microscope’s apex and the TomoCap.
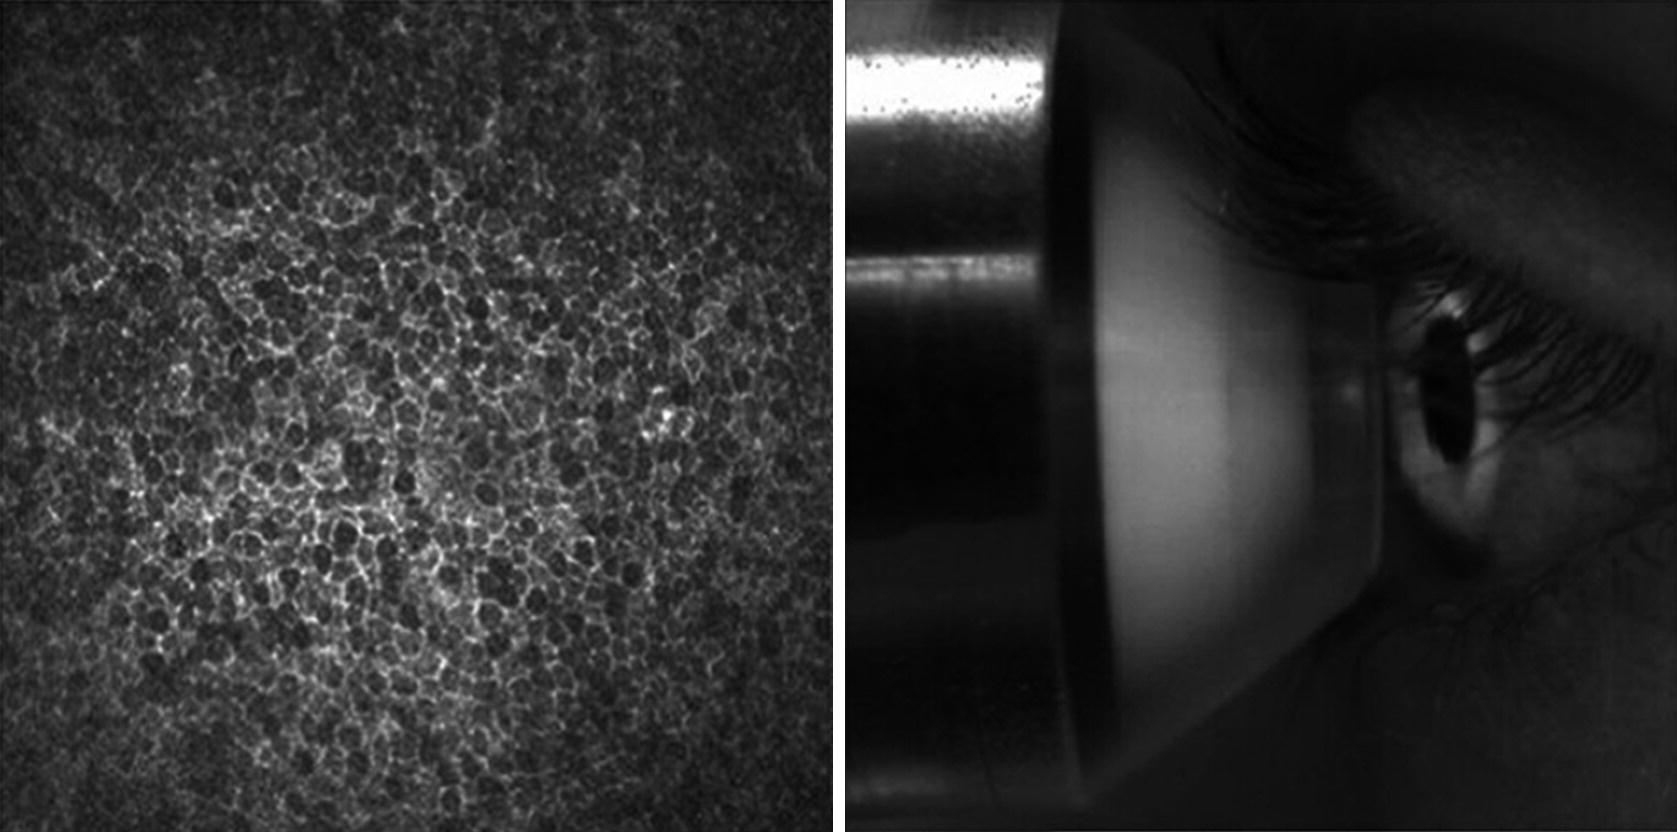
The user interface of the HRT-RCM software displays two images simultaneously: the cSLM image (left) and the monitoring image of the external camera (right)
The contact method provides a way to reduce eye motion and enables to assign depth values to the cSLM images due to axial stabilization. The actual focus position is measured with respect to a reference plane, which enables to detect certain cell layers in a more systematic way.
The HRT-RCM supports the acquisition of single images, movies and volume scans. A volume scan (also referred to as z-series) is a sequence of optical sections at an equidistant spacing of about 2 μm. Forty images are collected while the focus of the HRT incrementally changes by means of a stepping motor. This automated volume scan is limited to a depth range of about 80 μm.
The HRT-RCM features a field of view of 400 μm × 400 μm, a lateral resolution of 1–2 μm and an axial resolution of about 4 μm. It thus enables imaging on the subcellular level with almost isotropic resolution. Compared to retinal cSLO imaging the lateral resolution is increased by about the tenfold, the depth of field is decreased by about one hundred . Very sharp and narrow slicing of the specimen is feasible, which is essential to access single epithelial cell layers of the cornea. As was already pointed out, the large numerical aperture (NA) of the microscope lens accounts for the high resolution, whereas in retinal imaging it is limited by the rather low NA of the eye and the diameter of the imaging beam. This principle difference was schematically presented in Fig. 12.2.
Cellular imaging requires a microscope lens with a short focal length, which also limits the working distance (WD). The depth of the layer which can be accessed within the tissue is confined to that distance. A WD of 2.2 mm is sufficient to image cornea, limbus or sclera. But deeper tissue of the anterior segment, e.g. the lens epithelium, can only be imaged with a microscope lens of lower NA, which then reduces resolution.
The lateral field of view (FOV) is determined by the maximum scan angle and the focal length of the microscope lens, which is proportional to the FOV. Therefore, subcellular resolution is feasible only for small FOVs in the order of several hundreds of micrometers. Field of view and resolution cannot be optimized independently.
However, it is possible to stitch single frames to larger field of views. The mosaicking feature of the HRT-RCM software enables the acquisition of real-time composite images. These comprise a maximum area of 64 single frames resulting in a total FOV of about 3 mm × 3 mm. Each single frame is inspected for features that match the composite and is then aligned and added to the composite. In general, random and involuntary eye movement is not sufficient to fill this large frame. The patient needs eye guidance e.g. by a moving fixation target. Composite images have been shown for the subbasal nerve plexus, see the following section.
The cornea is a highly transparent tissue, which backscatters only about 1% of the incident light in the visible range [24]. Its main constituent is water which practically shows no absorption in the visible spectrum. The main contribution to light attenuation while passing through the cornea comes from scattering rather absorption.
In the field of biomedical optics Rayleigh scattering and Mie scattering are commonly used to describe light-tissue interaction.
Rayleigh scattering is referred to as scattering by small particles that have a refractive index different from the surrounding medium and a particle size much smaller than the wavelength . Also, spatial fluctuations in density on this scale may cause continuous variations in refractive index. Rayleigh scattering shows equal intensities for forward and backward scattered light, which are inversely proportional to the fourth power of wavelength.
Mie scattering is commonly referred to as scattering by particles comparable in size to the wavelength. It shows a weaker dependence on wavelength and preferably takes place in the forward direction.
Most biological tissues neither show pure Rayleigh nor Mie scattering: the photons are preferably scattered in the forward direction, i.e. scattering is highly anisotropic [25]. On the other hand, the observed wavelength-dependence is generally stronger than predicted by Mie theory [26]. Therefore, mathematical modeling of laser interaction with tissue or Monte Carlo simulation may be useful to deduce optical scattering properties. Structural modifications in tissue can manifest themselves in changes in confocal signal intensity and it is a major field of research to link macroscopic optical properties with microscopic tissue architecture.
The transparency of the cornea is attributed to an extremely regular structure of collagen fibrils of homogenous diameter [27]. The cornea is about 500 μm thick, of which about 90% consists of collagen fibers, interstitial substance and keratocytes.
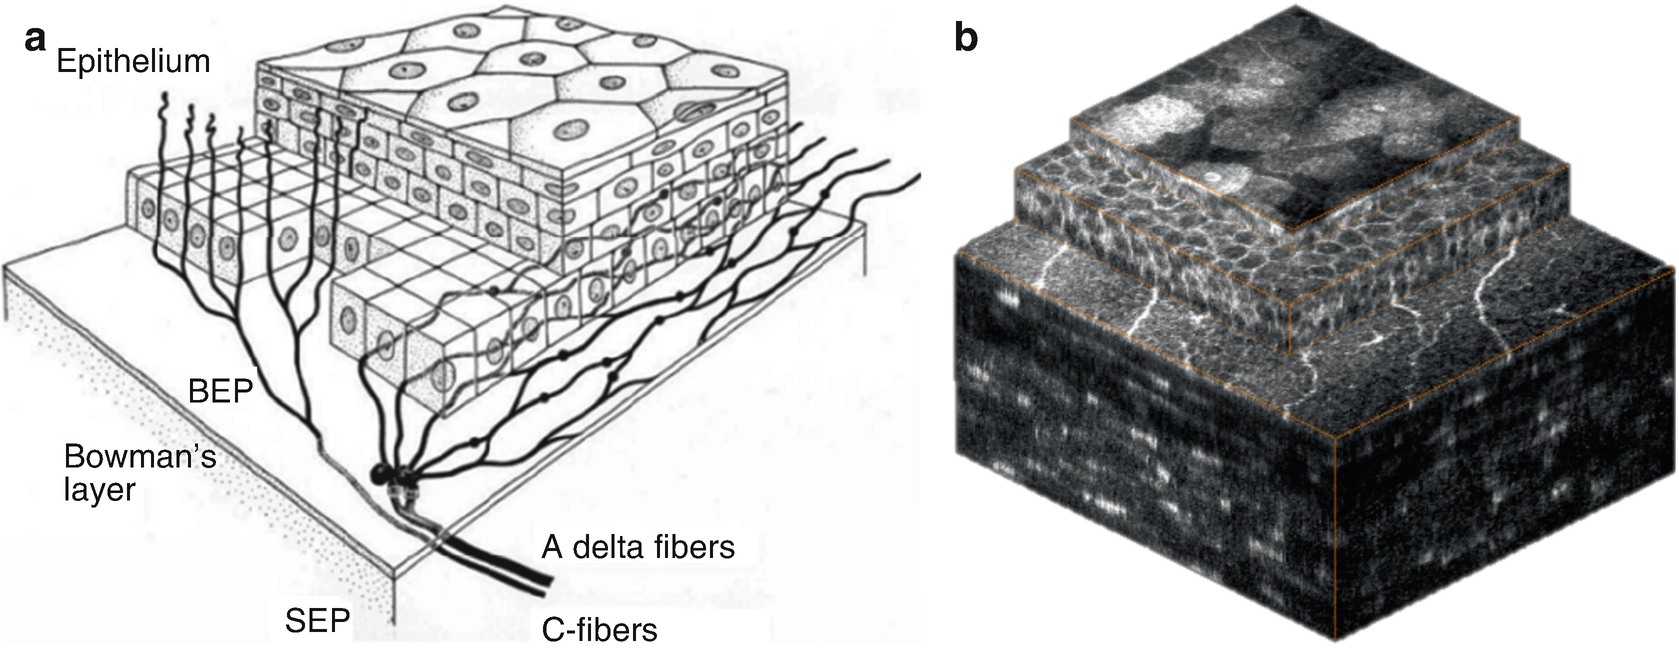
Corneal epithelium is comprised of superficial cells, wing cells and basal cells. The epithelial cells have bright cell boundaries and the size varies from about 40 μm for the superficial cells to 8–10 μm in the basal epithelium.
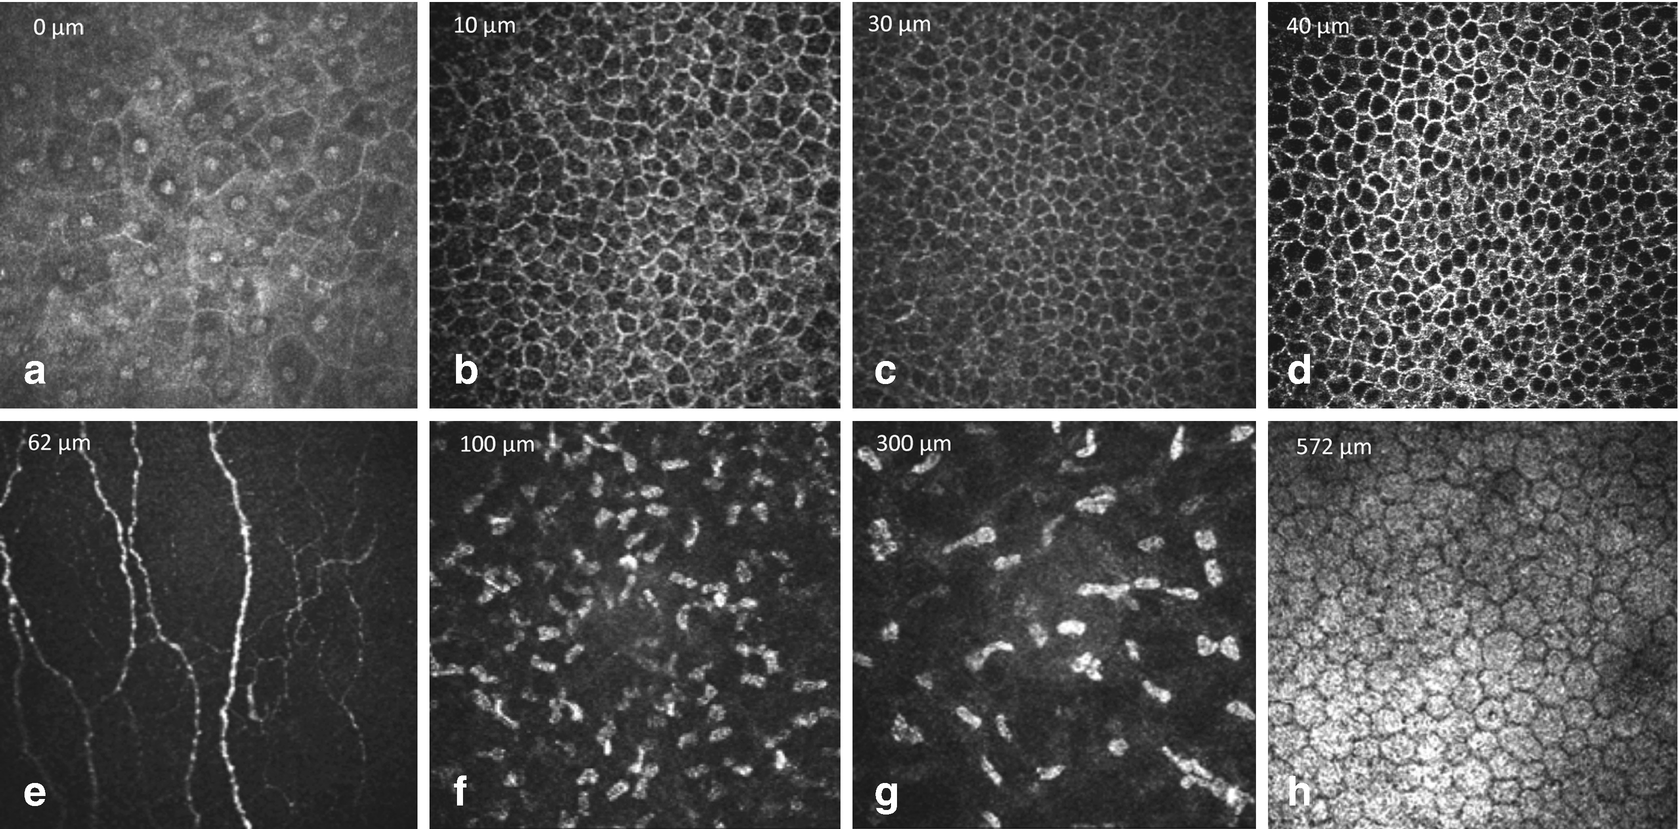
Normal findings in ocular surface tissues: (a) superficial cells, (b) upper wing cells, (c) lower wing cells, (d) basal cells, (e) subepithelial nerve plexus, (f) anterior stroma, (g) posterior stroma and (h) endothelium
Immediately posterior to the basal epithelium an amorphous membrane is located, called Bowman’s layer (e). Bowman’s layer is made of collagen fibers and contains unmyelinated c-nerve fibers. It is about 10 μm thick and the confocal images appear featureless and grey, with discrete beaded nerve bundles running parallel to the corneal surface.
The keratocyte nuclei of the stroma (f, g) are 5–30 μm in diameter and are hyperreflective. In normal tissue, the collagen fibers and the interstitium appear as gray amorphous background. In the anterior stroma myelinated nerve fibers can be occasionally visualized at lower density and higher thickness. Between the posterior stroma and the endothelium Descemet’s membrane appears as an acellular layer. It has a hazy appearance and becomes more visible with increasing age.
The cornea endothelium (h) is a single layer of hexagonal or polygonal shaped cells, about 4–6 μm thick and 20 μm in diameter, appearing with bright cell bodies and hypo-reflective cell boundaries . The cell nuclei are rather difficult to recognize. With increasing age endothelial cell density reduces and polymegathism increases.
12.4 Ophthalmological Applications
For conventional microscopic evaluation of biological tissues usually thin slices with 2–5 μm thickness were cut, stained with various chemicals (dyes) and examined by light transmission microscopic techniques at high magnification (400–1000-fold).
For in vivo examination of semitransparent tissues slit lamp biomicroscopy is the standard technique since over a century. The inventor Allvar Gullstrand a Norwegian physicist and ophthalmologist was awarded the Noble price mainly for this breakthrough invention 1911. In this technique , optically cut planes are orientated sagittally and observed by a binocular microscope with the magnification up to 50-fold. With this magnification single cell resolution is impossible. Nevertheless, the majority of corneal diseases could be diagnosed that way and treatment follow up was easily possible in most of the patients.
- (1)
with a magnification of approximately 800-fold which clearly allows single cell evaluation and
- (2)
the optical section directed parallel to the corneal surface which means perpendicular to the slit lamp image.
Both phenomena made it necessary to create new standards for the interpretation of images obtained by in vivo confocal microscopy of the cornea. In the meantime, this is documented in various textbook chapters and atlases, e.g. [28].
Corneal nerve degeneration and regeneration
- Chirurgical interventions
Corneal grafting
Refractive surgery
Contact lenses
Diabetes mellitus
Keratoconus
Ocular surface disease
In the following, three examples will be given to underline the clinical benefit of in vivo corneal confocal microscopy. Then, short overviews of cSLM in animal and interdisciplinary research are given respectively.
12.4.1 Diagnoses of Keratomycosis
Fungal keratitis plays a major role in many developing countries, where early diagnoses and treatment are often not easily available. Even in relatively infrequent infections in industrialized countries proper management of fungal keratitis due to prolonged diagnostic procedures ends up with devastating results [29].
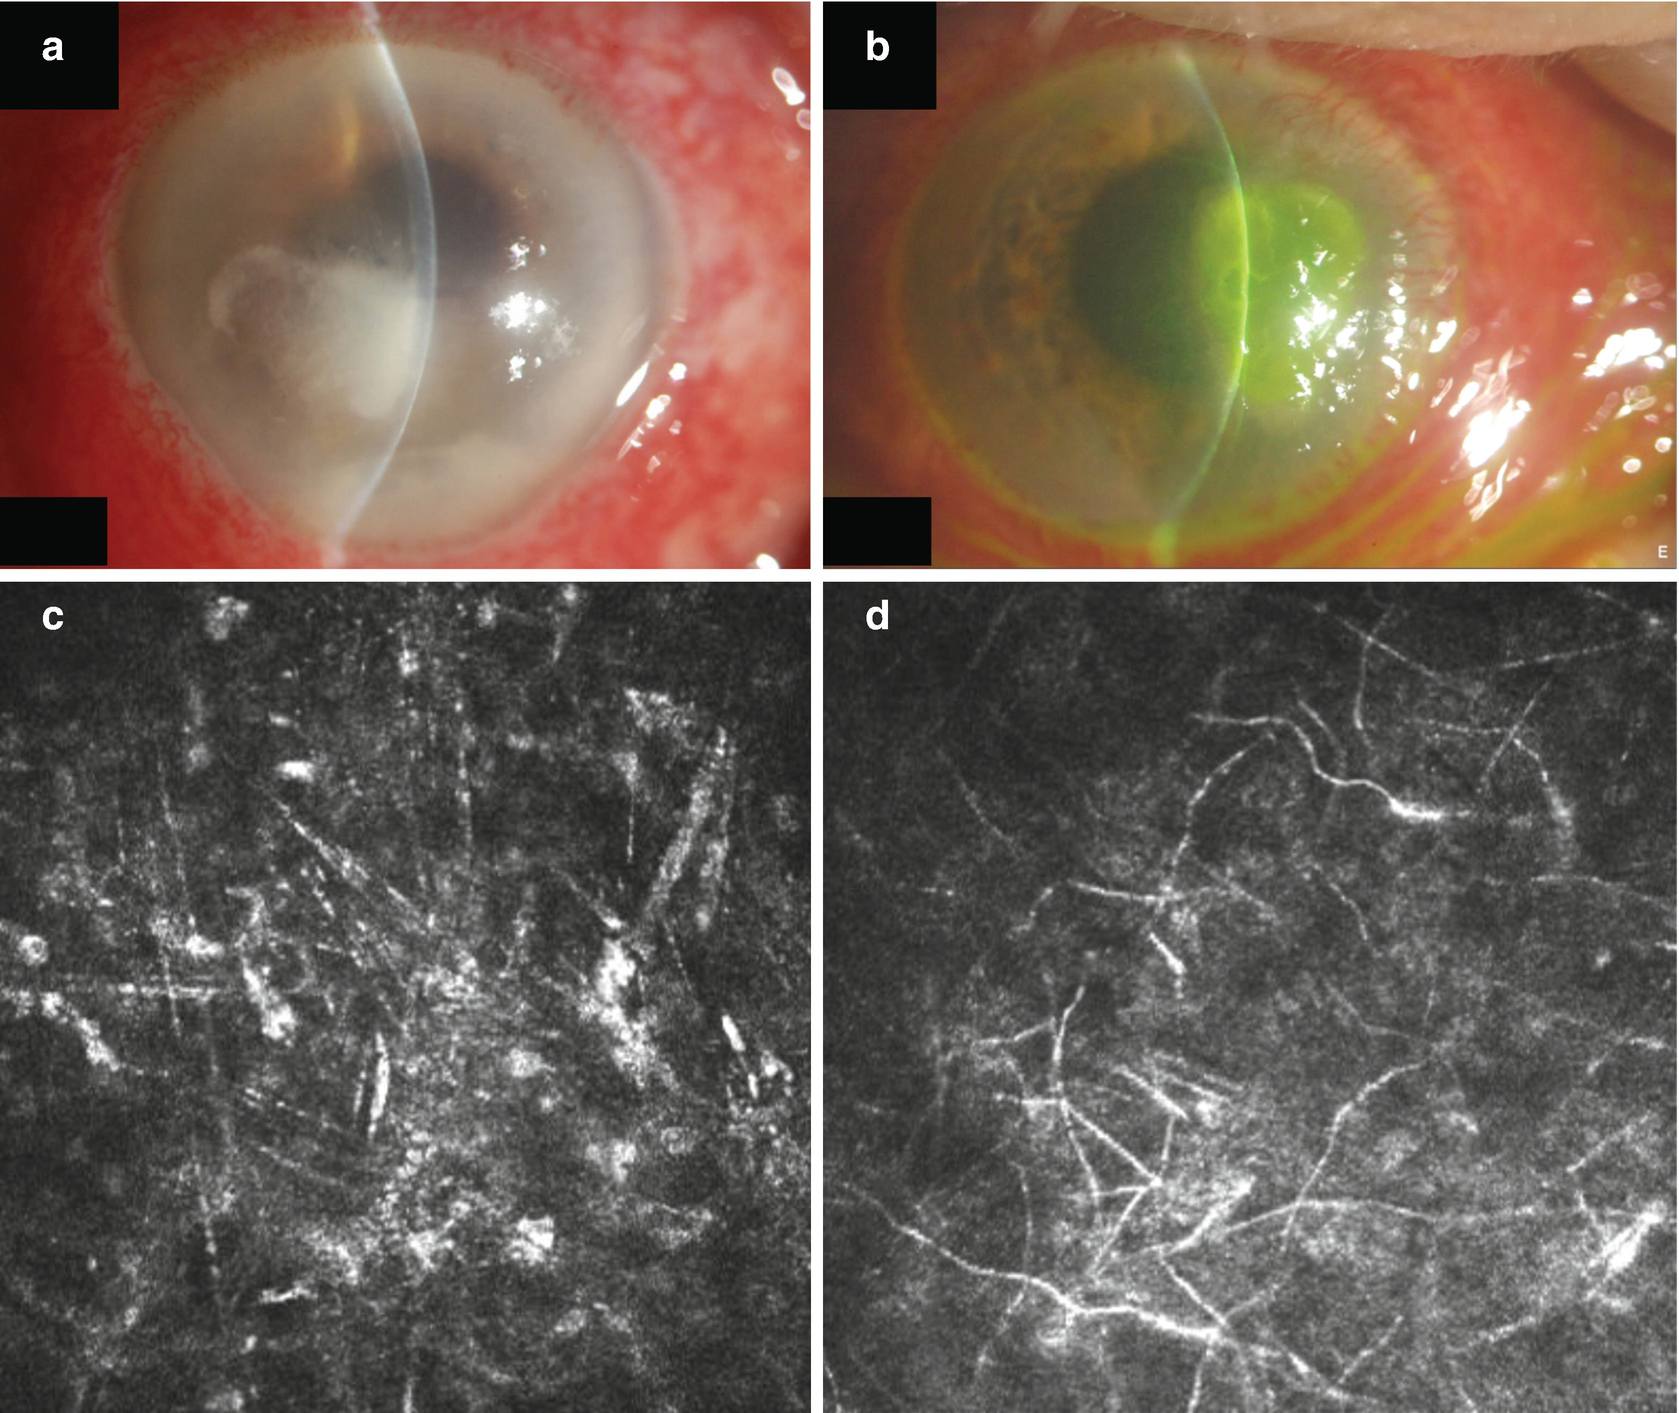
Slit lamp photograph of corneal ulcers of unknown aetiology (a, b) and confocal images of these lesions showing spindle shaped activated keratocytes, (c) corresponding to (a) and typical fungal elements (d) corresponding to (b)
12.4.2 Subbasal Nerve Plexus
The ophthalmological evaluation of the subbasal nerve plexus of the cornea might add value to the diagnosis of a variety of diseases.
limbal stem cell deficiency
infection
corneal surgery
keratoconus
diabetes
lysosomal storage diseases
keratitis.
Especially, small fiber neuropathy in diabetic patients is a main cause for limb amputation both in the industrialized and in the developing countries [30]. Clinical quantification of the disease with widely accepted methods like neuropathy symptoms score (NSS) and neuropathy deficit score (NDS) as well as skin sensitivity measurements with a so-called monofilament delivers positive results only in patients where a considerable nerve fiber damage has already taken place [12, 31].

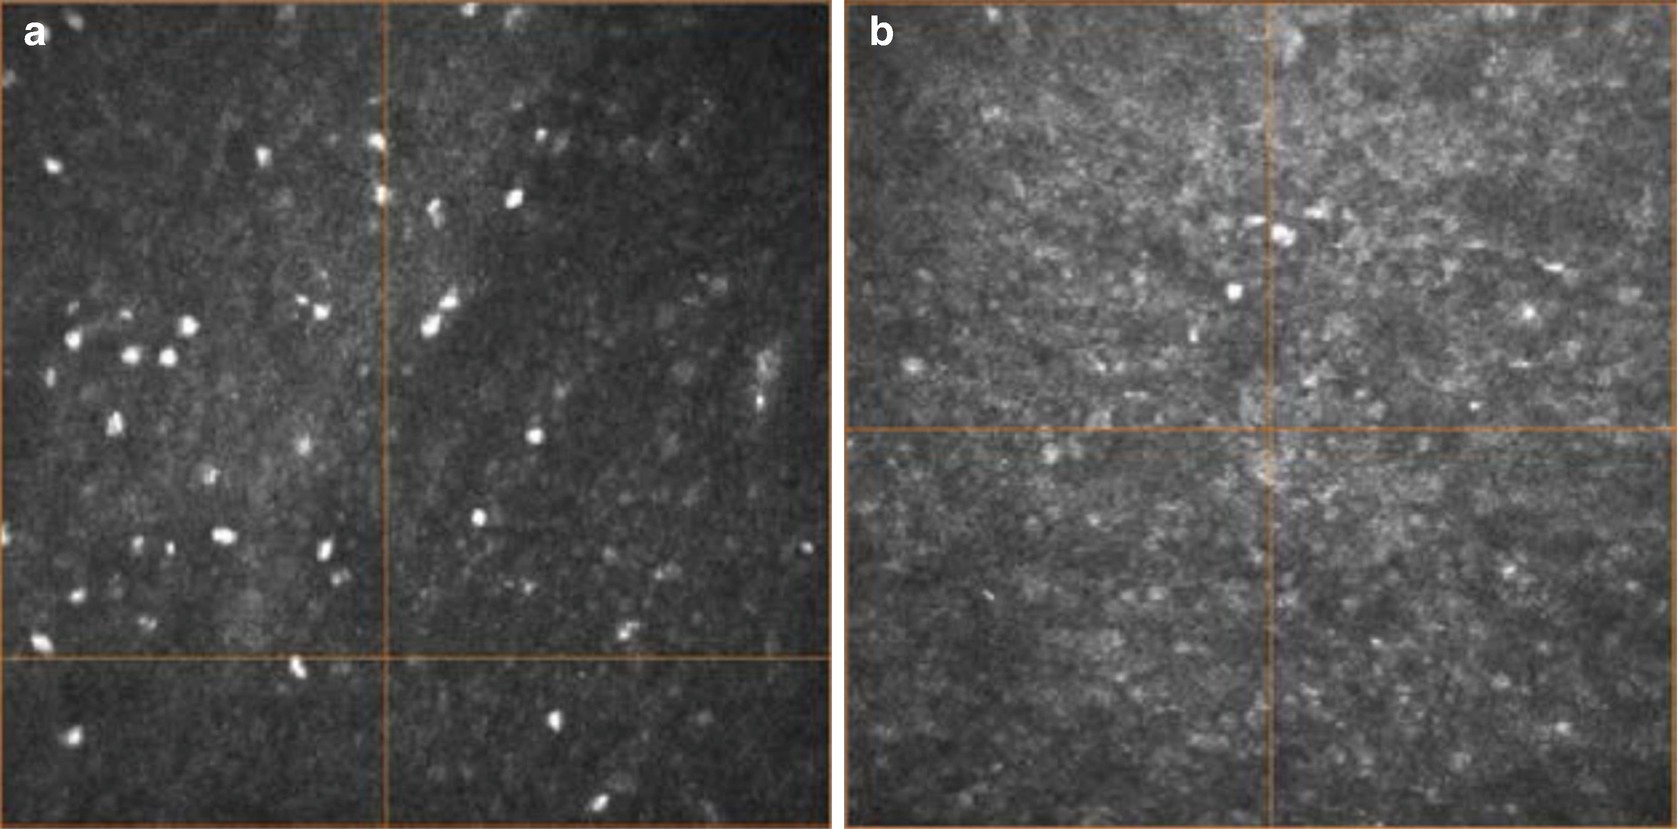
Single image from the subbasal nerve plexus of the cornea in an individual without diabetes (a) and in an individual showing a decrease in the nerve density and nerve length (b)
Imaging of the subbasal nerve plexus might pave the way for new treatment strategies and more effective prevention of this serious disease. Diabetes-induced complications could thereby reduced.
12.4.3 Corneal Keratocyte: A Neglected Entity of Cells
Keratocytes are specialized fibroblasts representing about 10% of the volume of the corneal stroma. Their cytoplasm with a total diameter of up to 100 μm is highly transparent whereas nuclei with a diameter of about approximately 10 μm are the main light scattering elements of the cornea.
Vogt described them as “corpusculi cornea” in his fundamental textbook on slit lamp biomicroscopy in 1930. Keratocytes are placed in a network of highly organized and different shaded collagen lamellas which are also invisible even for confocal microscopy due to their complex 3D arrangement avoiding any light scattering or reflectance.
In vivo confocal microscopy easily displays keratocyte nuclei. The following mean cell densities were found: in the basal epithelium 6000 ± 1080 cells/mm2, anterior stroma 765 ± 262 cells/mm2, mid stroma 347 ± 64.4 cells/mm2, posterior stroma 315 ± 57.2 cells/mm2, and endothelium 2720 ± 367 cells/mm2 [32].
There is still no theory why the density of keratocytes varies according to their localization and whether there are clear keratocyte subtypes in different layers of the cornea [33].

Volumetric cSLM representation in an individual after x-linking showing alterations in the anterior part of the cornea (a–c) and a normal appearance in the posterior part (d–f)
12.4.4 cSLM for Animal Studies

Mosaicking cSLM in animal research showing the rabbit endothelium (2.5 mm × 2.5 mm)
There are a large number of publications covering the full range of corneal research. In vivo cSLM was used for animal studies to assess the corneal surface after the application of topical drugs or preservatives [41] to analyze corneal response after refractive surgery [42, 43] and alterations after contact lens wearing [44, 45]. Furthermore, a number of studies deal with mice models to investigate diabetes-induced small fiber neuropathy [46, 47]. Hovakimyan et al. have investigated matrix-based regenerating agent for corneal wound healing after collagen cross-linking [34].
12.4.5 Interdisciplinary Research
The ability of cSLM to generate high-resolution in vivo images of the highly innervated cornea has drawn pronounced interest as it allows for using this innovative technology as a biomarker for disease staging in humans.
For instance, cSLM has visualized and highlighted significant morphological alterations of the subbasal nerve plexus in diverse diseases such as Parkinson’s disease and progressive supranuclear palsy [48], amyotrophic lateral sclerosis, chronic migraine [49], multiple sclerosis [50, 51] and amyloid neuropathy [52]. But diabetic peripheral neuropathy , in particular, has been the main focus of various studies [12] because characteristic morphological alterations of the subbasal nerve plexus already occur at an early stage of diabetic peripheral neuropathy [53, 54]. In conclusion, cSLM has the potential to reveal reliably the biomarkers for the early assessment of diabetic peripheral neuropathy (DPN) .
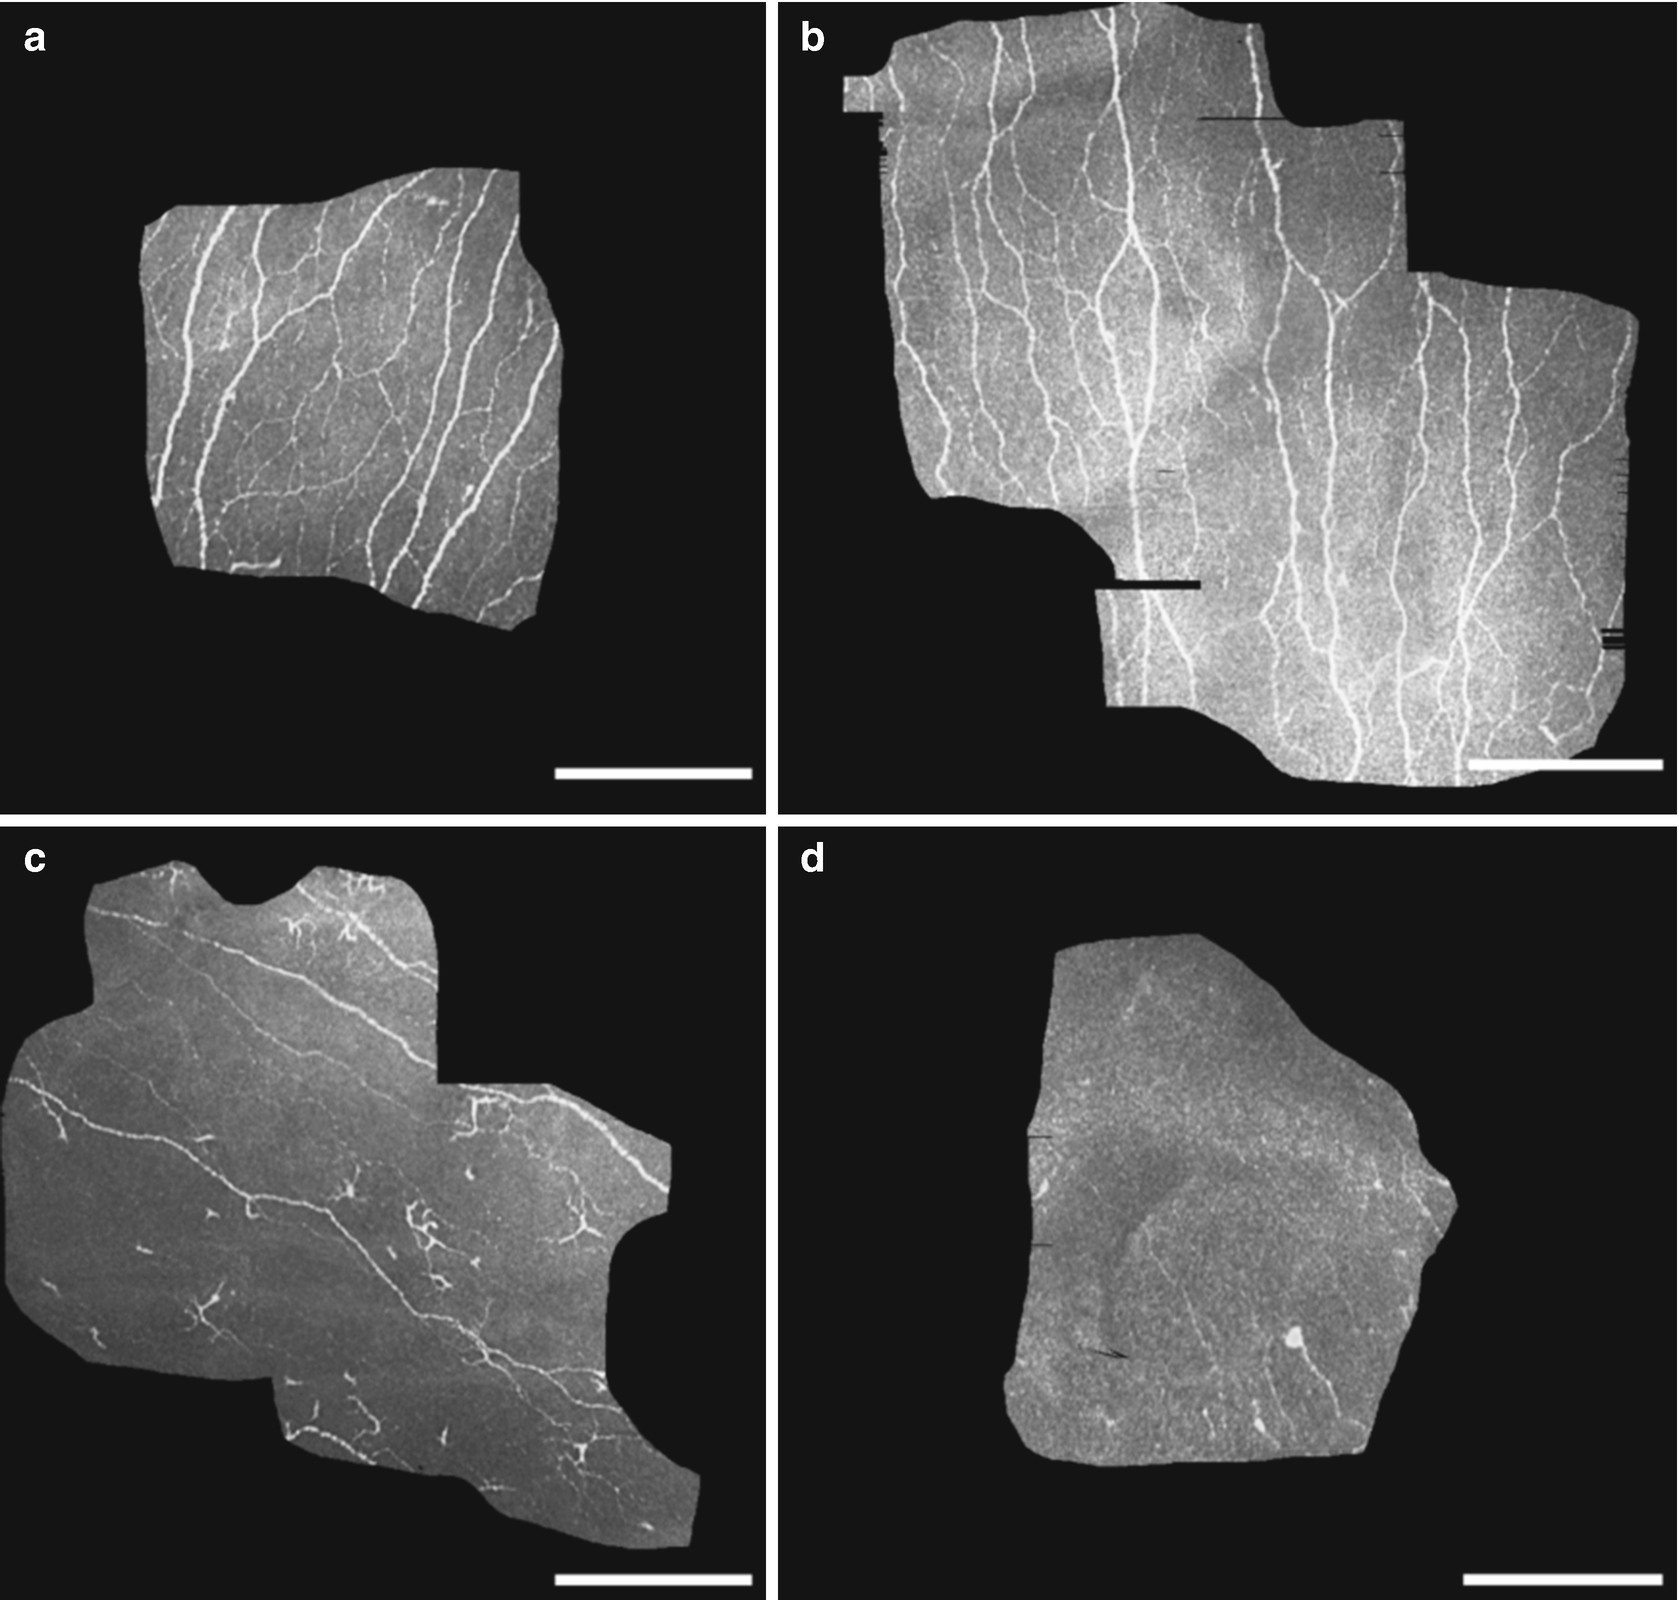
Confocal images demonstrating the morphology of SNP from two control subjects (a, b) and two Charcot subjects (c, d). c and d exhibited readily visible changes with decrease in nerve fibers, decrease in nerve branches and connectivity, and presence of widely scattered dendritic cells (c). Each scale bar represents 200 μm. (In cooperation with Herlyn & Mittlmeier (University of Rostock) as well as Köhler & Allgeier (Karlsruhe Institute of Technology))
In summary, there is a high evidence of cSLM in general clinical practice as a noninvasive method of assessing peripheral neuropathies , monitoring inflammatory states and clinical therapeutic response. The current research discusses the contribution of cSLM in the diagnosis and assessment of diabetes, neurodegenerative diseases, rheumatology, immunology, and chemotherapy. Indeed, further work is needed to evaluate its potential use in the diagnosis and management of the systemic disease.
12.5 Non-ophthalmological Applications
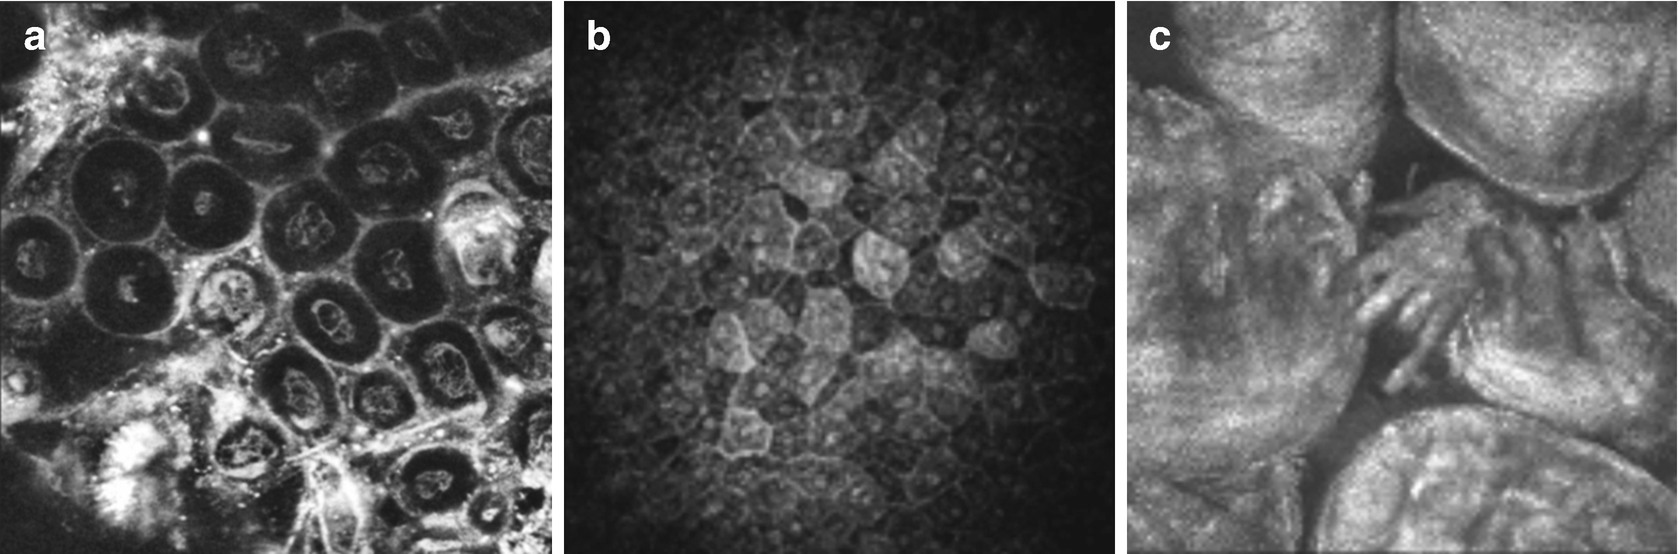
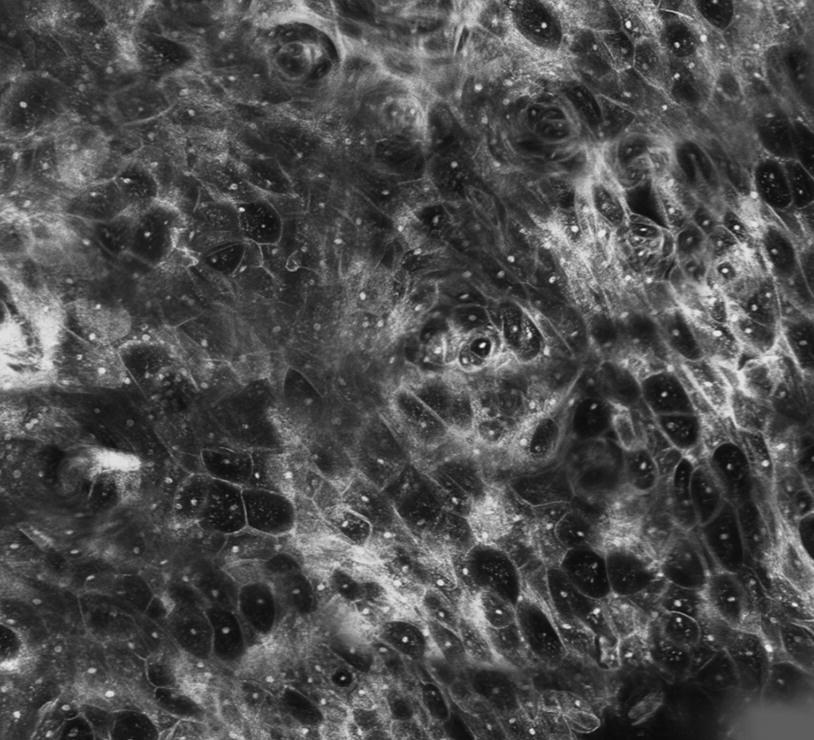
cSLM in Gynaecology (a, vulva dysplasia, in vitro), in dermatology (b, skin epithelium, in vivo) and in Otorhinolaryngology (c, taste buds, in vivo)
Several studies have been performed to assess the ability to image the characteristics of special tissue properties . Very interestingly, cSLM has been used to describe the cellular morphology and pathological alterations of the oral cavity, cervix, and esophagus [55–57]. Reflectance imaging of human skin can provide insights of cell morphology and tissue architecture of the epithelium [58, 59].
Mosaicking cSLM in Otorhinolaryngology showing cellular structure of the mucous membrane (in vivo, 2.5 mm × 2.5 mm)
Upper (a) and deeper (b) part of the cylindric epithelium of nasal polyps. The almost nucleus free cell bodies show a homogenous appearance (a), whereas the nuclei are densely packed and homogenously organized near the basal membrane (b)
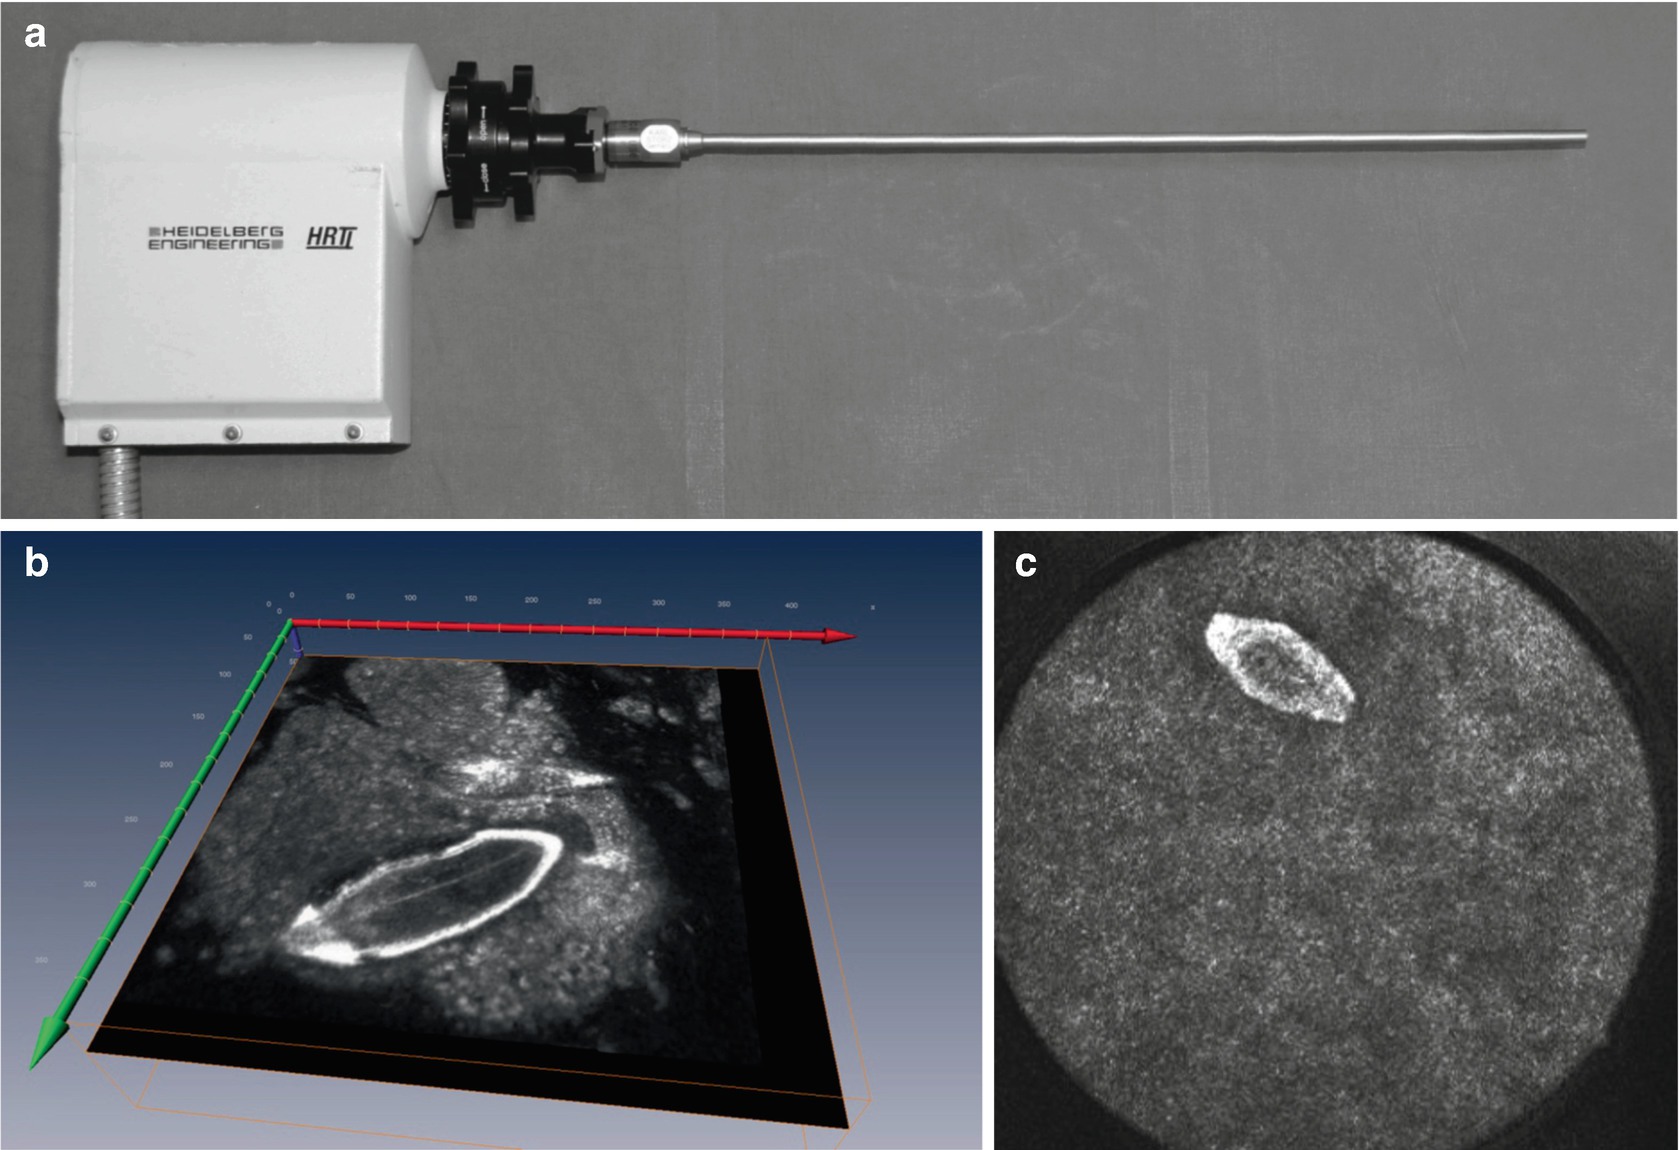
Endoscopic image modality based on the Heidelberg Retina Tomograph (HRTII) (a), eggs of Schistosoma mansoni visualized within the mucosal tissue of the large intestine (b) and cSLM of the bladder showing eggs of Schistosoma haematobium (c) (in cooperation with Holtfretter, Fritsche und Reisinger, University of Rostock)
12.6 Current and Future Developments
Nowadays, in vivo corneal confocal microscopy has received a high level of scientific and clinical attention in ophthalmology. The ability to acquire high-resolution images of various cellular structures inside the living cornea non-invasively has inspired the idea of using this technology for diagnostic purposes. A number of innovations are under development in order to assess their diagnostic potential and the usability of the technology.
12.6.1 Subbasal Nerve Plexus Mosaicking
A special focus has been given on the assessment of corneal nerves and their involvement in ocular and systemic diseases, especially for non-invasive and repeatable techniques which can quantify ocular neurodegenerative changes in individuals with diabetes [12].
Results of older studies in this context were always based on morphometric parameter values derived from single cSLM image with a field of view in the order of 400 × 400 μm2 each. Recent examinations suggest that a robust morphometric assessment requires the analysis of larger areas of the central cornea in order to compensate for a locally inhomogeneous arrangement of the SNP [66, 67].
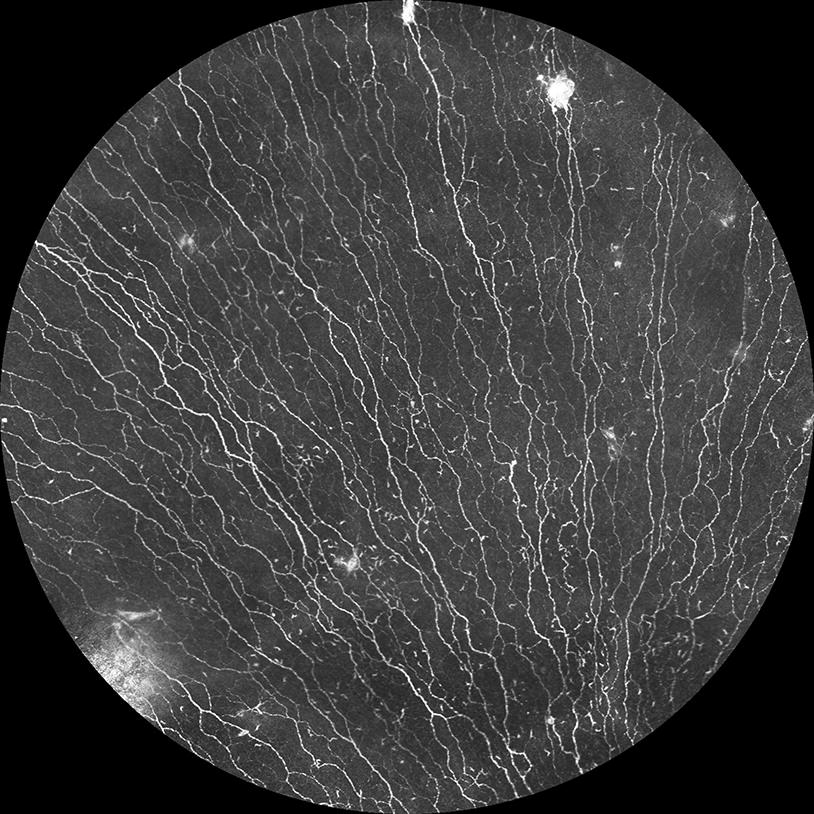
Large scale SNP mosaicking of a healthy human subject
12.6.2 Slit Lamp Microscopy on a Cellular Level Using In Vivo Confocal Laser Scanning Microscopy
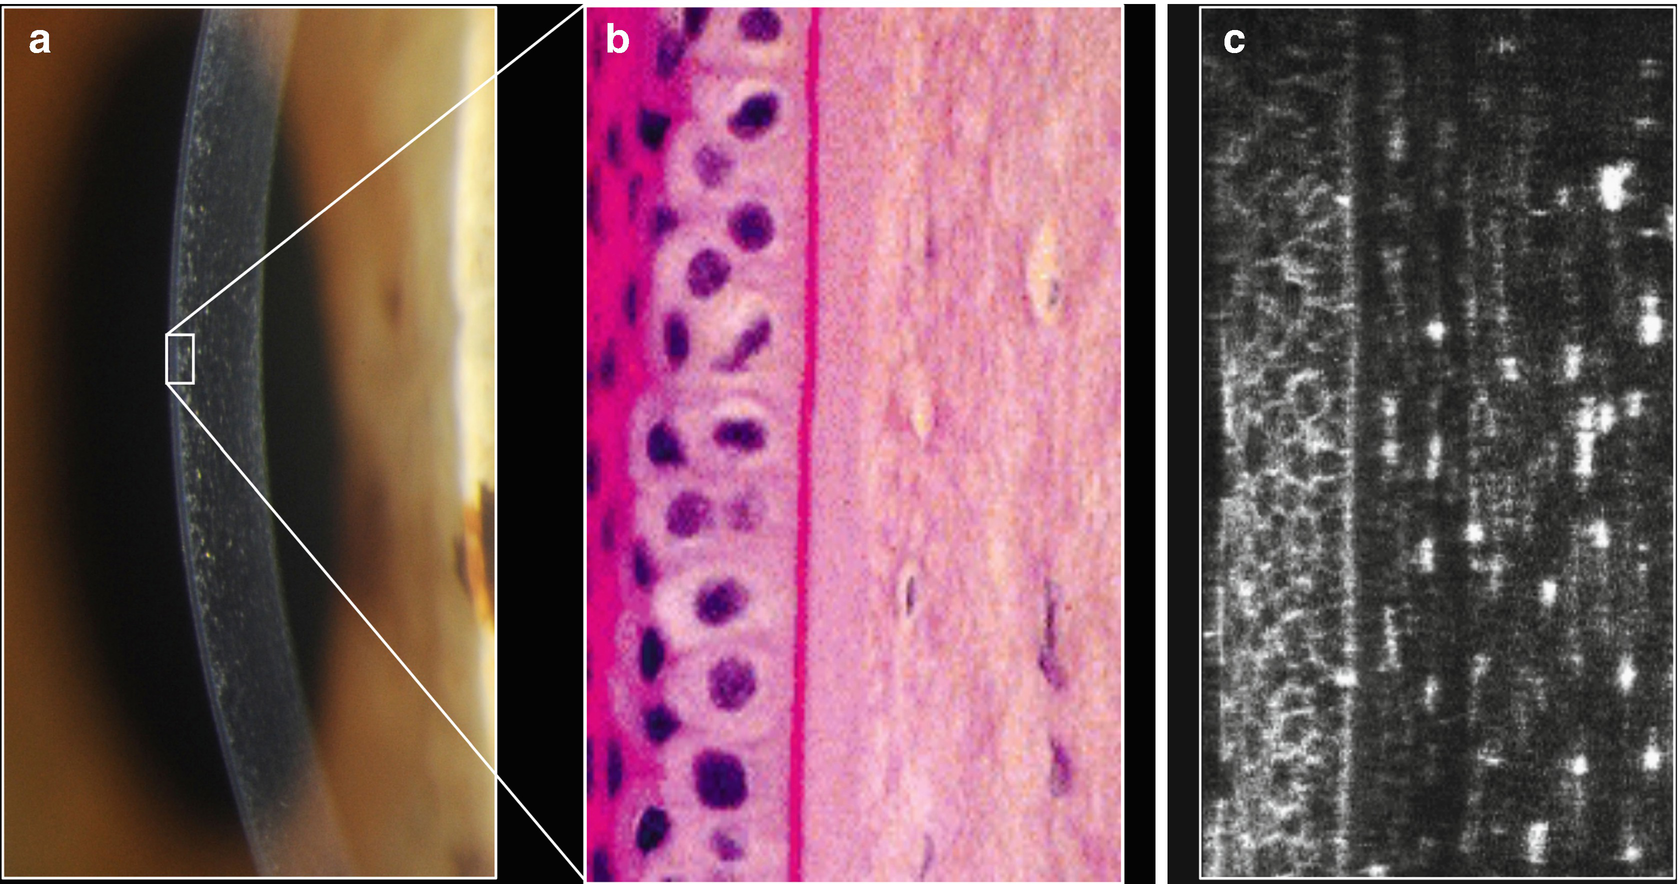
Conventional slit lamp (a), histology (b) and cross-section after 3D-reconstruction (c) exemplifying the potential of the laser based slit lamp
12.6.3 OCT-Guided In Vivo Confocal Laser Scanning Microscopy

Example for OCT guided cSLM: confocal image (left) and cross-sectional OCT image (right). The bright reflection within the OCT image reveals the position of the confocal en-face image with respect to the cornea’s anterior and posterior interface
The piezo actuator can shift the cSLM focal plane up to 600 μm whereas the image position and orientation can be tracked in real-time. Compared to the conventional state of the art, the OCT-guided cSLM concept significantly improved the usability. Real-time assessment of the cSLM image plane location and orientation inside the cornea by means of the OCT cross-section enables an improved location-based diagnosis. For the first time, it is possible to specify the angle between the corneal surface and the cSLM image. Further effort is necessary for optimizing the system design and OCT scan patterns.
12.6.4 Multiphoton Microscopy
Corneal cell differentiation in vivo can be performed only on a morphological basis, and in the majority of cases, this is not sufficient using cSLM. This window could be opened by multiphoton microscopy . The non-linear interaction mechanisms, such as multiphoton absorption or frequency conversion, can be induced by using a highly focused pulsed laser. Using this advanced technology, induced autofluorescence, second-harmonic generation or fluorescence lifetime measurements can be used to produce cell-specific information with subcellular resolution [71–73].
12.7 Summary
In summary, state-of-the-art cSLM allows to evaluate the ocular surface at a cellular level with subsequent 2D mosaicking or 3D reconstruction. But only a close and straightforward cooperation between basic as well as clinical science and industry partners may bring about the fulfillment of the great promise offered by this technology.

Open Access This chapter is licensed under the terms of the Creative Commons Attribution 4.0 International License (http://creativecommons.org/licenses/by/4.0/), which permits use, sharing, adaptation, distribution and reproduction in any medium or format, as long as you give appropriate credit to the original author(s) and the source, provide a link to the Creative Commons license and indicate if changes were made.
The images or other third party material in this chapter are included in the chapter's Creative Commons license, unless indicated otherwise in a credit line to the material. If material is not included in the chapter's Creative Commons license and your intended use is not permitted by statutory regulation or exceeds the permitted use, you will need to obtain permission directly from the copyright holder.