15.1 Introduction
Patient satisfaction is a constant pursuit in cataract surgery. In order to enhance the chance of each patient’s postoperative satisfaction, cataract surgeons measure the refraction of the eye preoperatively and attempt to select the appropriate IOL for the patient, based on not only those measurements but also on the patient’s needs and expectations. The overall number of implanted premium IOLs is still small compared to the overall number of implanted IOLs. Some surgeons avoid implanting premium IOLs because of their cost, possible limitations or side effects and therefore the possibility of an up unhappy patient [1].
A multifocal or toric IOL is more sensitive to decentration or tilt compared to a standard IOL. Postoperatively the IOL will settle in place and during this process the lens can still move. Current adjustable technologies only allow the adjustment of an implanted IOL if that IOL model was selected prior to cataract surgery and therefore prior to possible complications. After the first, desired adjustment is finalized the IOL is locked in and the IOL is no longer adjustable [2]. For standard, hydrophobic and hydrophilic IOLs the options for an undesired refractive outcome are ranging from spectacles, refractive surgery to lens explantation.
Studies suggest that a significant number of patients will require spectacle prescriptions after cataract surgery. For example, a clinical study found that 37.8% of cataract patients had preoperative astigmatism of more than 1.00 D [3]. Furthermore, it was reported that postoperative astigmatism of greater than 0.75 D has an adverse effect on the performance of a monofocal IOL [4]. Further, about 25.7% of patients who undergo conventional phacoemulsification and about 28% who undergo laser-assisted cataract surgery have a postoperative spherical error of more than 0.50 D, which is enough to adversely affect their distance vision [5].
Additionally, cataract surgery is generally performed in the elderly population, so most patients who do not choose multifocal IOL implantation will require reading correction postoperatively. Market Scope estimates that more than 90% of post-cataract patients are presbyopic. Taken together, all of these factors indicate that more than 50% of patients would benefit from a distance correction after cataract surgery, and another 40% might take advantage of multifocal optics.
Unfortunately, current premium IOLs cannot reliably solve these problems because there is a possibility for the IOL to move postoperatively. Further, the effects of wound healing are difficult to predict and add an additional complication.
The refractive index shaping (RIS) technology in development by Perfect Lens, which can theoretically alter an IOL after it has been implanted and has settled in the eye. Preclinical studies have shown that a short (<30 s) in-office procedure can adjust acrylic IOL materials such that spherical, toric, and multifocal issues can be resolved permanently. The use of the femtosecond laser to create refractive index change in various materials has been studied for years. Ohmachi and Igo [6] showed a refractive index change of 0.056 in glass using a femtosecond laser. Ding et al. [7] used a femtosecond laser to obtain a refractive index change of up to 0.06 in hydrogel polymers.
Different theories regarding femtosecond laser material interactions which affect the refractive index change have been presented. The Rochester Group hypothesized that the light from the femtosecond laser induced crosslinking within a hydrophilic material and thus created an increase in the refractive index [8]. Takeshima et al. [9] believed the refractive index change in glass was caused by local heat effects from phase separation, while Katayama and Horiike [10] proposed that all changes resulted from either: (1) crosslinking, (2) phase separation, or (3) decomposition.
Recently a new process was discovered wherein existing molecules within a polymeric material become hydrophilic inside an intraocular lens (IOL) [11]. This change in hydrophilicity occurs when the polymeric material is immersed in an aqueous medium, while it is exposed to femtosecond laser radiation. The aqueous medium and the femtosecond laser radiation provide the chemical basis for the hydrophilicity-based refractive index change. After the exposure of the polymeric material to femtosecond laser radiation, water slowly diffuses to the sites with increased hydrophilicity forming hydrogen bonds, typically over a 24–72 h period of time, to create a refractive index change in the polymeric material.
15.2 Technology Background
15.2.1 Femtosecond Laser-Induced Refractive Index Change (RIS)

(a) Refractive Index Shaping (RIS), Femtosecond (FS) laser, refractive index of IOL (n1) and refractive index of RIS lens (n2). (b) Phase Wrapping. (c) Multifocal IOL to Monofocal, before (left) and after (right) RIS-modification. (d) Hydrophilicity based Δn change (adapted with permission from Ref. 12, The Optical Society)
High repetition rate femtosecond laser pulses are directed to a designated area to create a “lens” inside an IOL. RIS changes the refractive characteristics of the polymeric material without cutting the material. The RIS-lens is a gradient lens, with the related refractive index change generated by the instantaneous energy of the laser pulse, which is regulated by an acousto-optical modulator (AOM) at approx. 1 MHz speed. The physical parameters of the procedure, like scan speed, wavelength, pulse rate, energy per pulse, etc., are provided in [13], as well as data on the homogeneity of refractive index change. In preparation of a RIS lens, the femtosecond laser is directed to a small area within the polymeric IOL. The laser light has several effects on the acrylic material: (1) the most recognized is that the laser light heats the material and causes a change in the material as a result of the heat , and (2) if the proper wavelength is utilized, the exposure to the laser light will alter the polarity of certain molecules within the polymeric material and change the hydrophilicity of the polymeric material. The change in hydrophilicity drives a large, repeatable and homogeneous change in refractive characteristics, which does not depend on the accumulation of heat and therefore can be used with a fast scan speed, allowing for in vivo application.
15.2.2 Phase Wrapping
In a traditional convex lens, one would be limited to a height of 200 μm (central slab area) in order to adjust the optical power of the IOL. The power for a 6 mm lens with a height of 200 μm would be 0.44 dpt (Δn = 0.01). Phase wrapping is a process which is used to create a RIS “lens” with enhanced diopter change, without increasing the height of the “lens”. Thus, a convex lens is reduced to a thin layer of approx. 50 μm thicknesses, creating multiple refractive zones. The different phase levels are created by controlling the energy per pulse and focal spot. For a “lens” with a diameter of 6 mm, one zone corresponds to 0.1 diopter (Fig. 15.1b).
15.2.3 Example of RIS-Procedure: Change of Diffractive Hydrophilic IOL into a Monofocal IOL
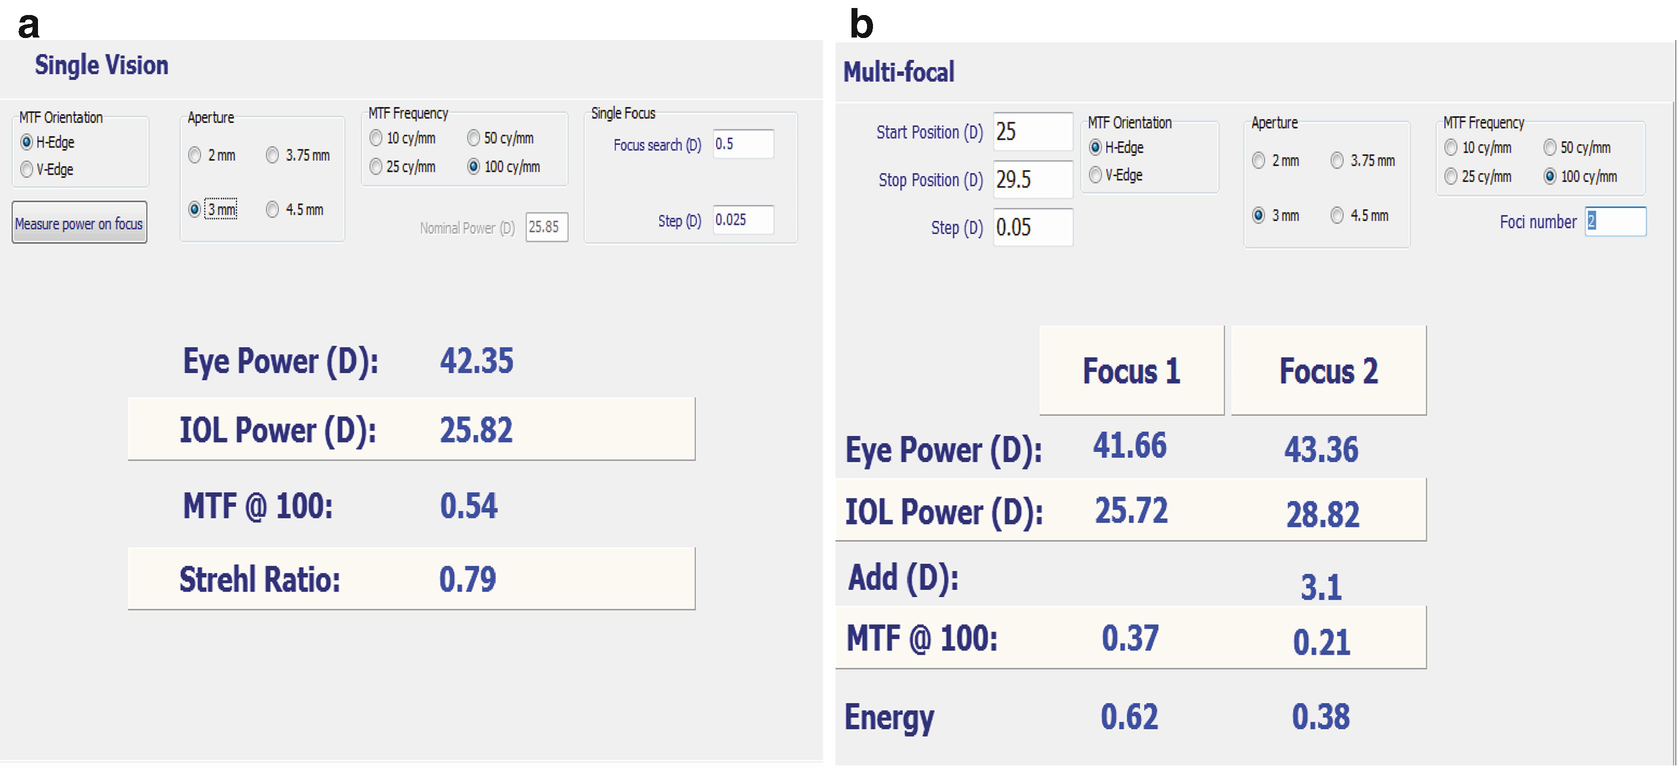
The possibility of changing a diffractive multifocal IOL into a monofocal IOL was evaluated. A suitable lens design was created to match the diffractive power and energy split of the diffractive multifocal IOL, as depicted in Fig. 15.1c. The original IOL measured 20.85 D with an add power of 3.58 D and a modulation transfer function (MTF) of 0.37 and 0.26. After RIS shaping, the IOL measured as a monofocal IOL at 21.04 D with an MTF of 0.57. The IOL shown in Fig. 15.1c, before (left), was a commercial diffractive multifocal IOL. The RIS-process was imposed to change the lens from multifocal to monofocal. The inverse process, i.e. creation of multifocality in a monofocal hydrophobic IOL is shown also in [14]. A RIS-lens can be ‘erased’, sub-sequentially, by e.g. creating a RIS-lens with opposite refraction in an adjacent layer.
15.2.4 Hydrophilicity-Based Δn Change
To demonstrate that the hydrophilicity of the polymeric material has been changed, two areas of polymeric material were compared. One area of the material had not been treated, and the adjacent area was treated with the femtosecond laser. To test whether the treatment created a hydrophilic area, the wetting angle measurement technique was employed [15]. The treated and untreated sections of an acrylic hydrophobic material were exposed to a drop of water. Figure 15.1d (left) shows the drop of water on a treated area, while Fig. 15.1d (right) displays a water drop placed on an untreated area of the lens. The angle of the drop, on top of the treated material, in Fig. 15.1d (left), is ~64°, which indicates that it is in contact with a hydrophilic surface. The angle of the drop, on top of the untreated material , in Fig. 15.1d (right), is ~87°, which indicates that the drop is in contact with a hydrophobic surface. The change in hydrophilicity demonstrates that the treatment with a femtosecond laser created a hydrophilic area.
15.3 Microscope Study: Methods and Materials
Two different microscope setups have been used for the study: Laser Induced Fluorescence (LIF) microscopy (Sect. 15.3.1) [16] and Raman microscopy (Sect. 15.3.2) [17]. Various hydrophilic and hydrophobic intraocular lens materials were studied (Sect. 15.3.3). Each microscope is being used to identify exactly what molecular changes occur upon exposure of the polymeric material to the light of the femtosecond laser.
15.3.1 Laser-Induced Fluorescence (LIF) Microscopy , STED Contrast
The STED (Stimulated Emission Depletion ) microscope uses a low power pulsed supercontinuum laser source (WhiteLase SC450-PP-HE, Fianium, Southampton, UK) for excitation at virtually any optical wavelength. After removal of the IR part of the supercontinuum spectrum using a 760 nm short pass filter, the desired excitation wavelength is selected using an acousto-optical tunable filter (AOTF, PCAOM-VIS, Crystal Technologies, Palo Alto, USA). The beam passes the AOTF three times in order to suppress the undesired wavelength range of the supercontinuum spectrum; the triple pass suppresses 1000 times better than a regular single pass. The STED laser is a frequency-doubled pulsed fiber laser (Katana-08 HPKA/40/07750/600/1600/FS) providing 600 ps pulses of up to 40 nJ pulse energy at a wavelength of 775 nm. The STED laser can be triggered electronically over a wide frequency range (25/40 MHz) which greatly simplifies the synchronization of the excitation and STED pulses. The STED laser is triggered by the pulsed supercontinuum laser operating at 38.6 MHz.
15.3.2 Raman Microscopy
Raman spectra were recorded on a commercial HORIBA XploRA PLUS Raman Microscope (HORIBA Jobin Yvon GmbH, Bensheim, Germany). All spectra were measured with a 10× objective with a 600 g/mm grating. The wavelength of the continuous wave excitation laser source was 785 nm (with a laser output of approximately 100 mW). Raman spectra were acquired both in the fingerprint (200–1800 cm−1) and high-wavenumber (2400–3800 cm−1) regions.
15.3.3 Materials
The microscopic study was performed on three different IOL materials . The following samples were studied: (1) hydrophilic acrylic material without yellow dye [18]: (1a) Hydrophilic acrylic intraocular lens (see e.g. Sect. 15.4.2.1) and (1b) Hydrophilic acrylic strip, cut from a hydrophilic acrylic button (see e.g. Sect. 15.4.2.2); (2) hydrophobic acrylic strip with yellow dye (blue blocking), cut from a hydrophobic acrylic button [19], and (3) hydrophobic acrylic strip without yellow dye, cut from a hydrophobic acrylic button [20]. The hydrophilic acrylic intraocular lens had a refractive power of five diopters, the strips were cubes of approximately 10 mm × 2 mm × 2 mm dimension and exhibited no refractive power. All strips are made from buttons, with the material specified in [18–20]. The acrylic buttons were disc shaped, 10 mm in diameter and 2 mm thick.
The chosen microscopic techniques provide information on the chemical nature of the process, on the electronic (fluorescence) as well as the molecular (Raman) level. CARS-microscopy is sensitive to refractive index changes, due to the four-wave mixing feature. In case of the clear hydrophilic acrylic material , LIF microscopy, STED microscopy and Raman microscopy were applied. The yellow hydrophobic material as well as the clear hydrophobic material was studied with LIF microscopy and STED microscopy.
15.4 Chemical Basis for RIS
15.4.1 Enhancement of Hydrophilicity by Femtosecond Laser Excitation
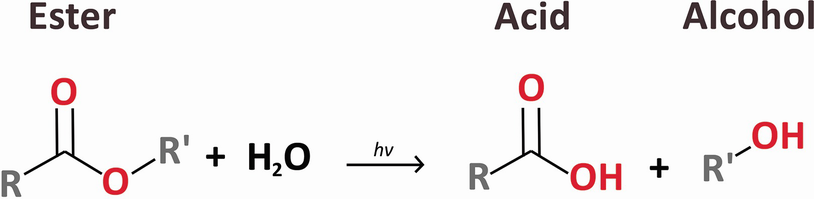
Photo-induced hydrolysis (adapted with permission from Ref. 12, The Optical Society)
Another possible mechanism for enhancement of hydrophilicity is two-photon depolymerization [23]. Zhou et al. [24] use a random copolymer of tetrahydropyranyl metacrylate (THPMA) and methyl methacrylate (MMA) polymer doped with BSB-S2 as the UV photoacid generators (PAG) for microfabrication. At the laser focal spot, the THPMA groups were converted to carboxylic acid groups due to photo-generated acid-induced ester cleavage reactions, and were therefore rendered soluble in aqueous base developer. This process may essentially contribute to the increase of hydrophilicity in laser treated areas in hydrophobic lens materials.
15.4.2 Femtosecond Laser Excited Fluorescence in a Hydrophilic Intraocular Lens
15.4.2.1 Section of a Hydrophilic Intraocular Lens
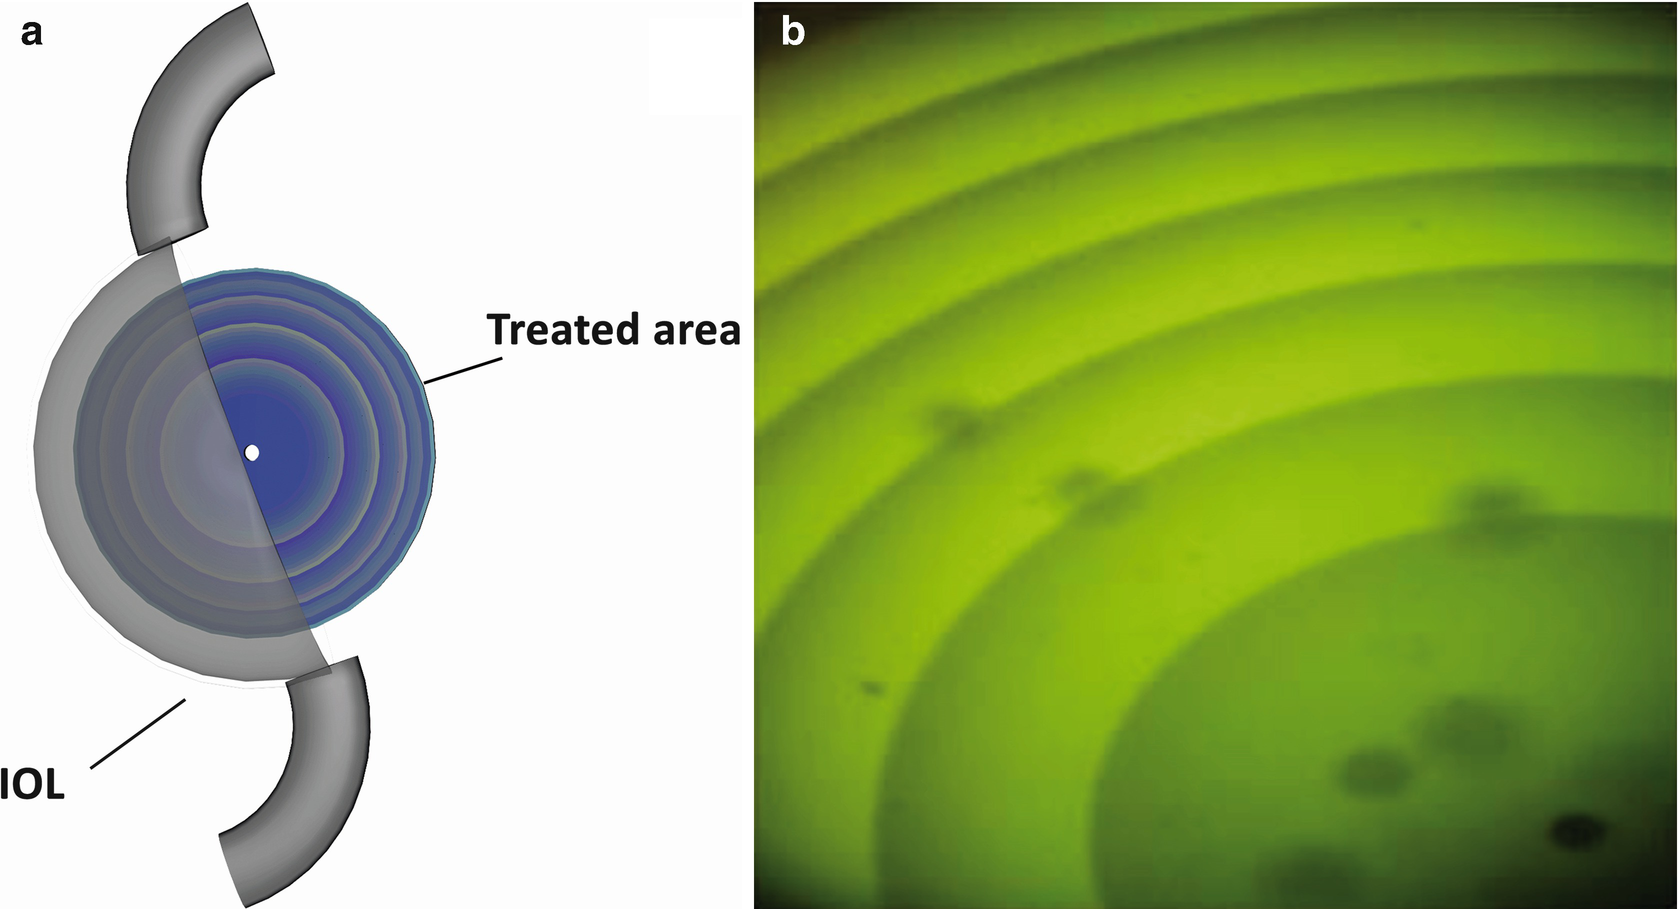
(a) Schematic sketch of hydrophilic acrylic lens (five diopters), RIS-treated area 4 mm circle in the center of the intraocular lens. (b) Fluorescence image of a RIS-lens, inscribed in the hydrophilic acrylic lens, sketched in this figure (a) (adapted with permission from Ref. 12, The Optical Society)
15.4.2.2 Fluorescent Light, Originating From Newly Created Fluorophores (Simultaneous Scans)

Simultaneous scans at 600 and 650 nm. Left image—fluorescence detection at 628 nm, right image—fluorescence detection at 708 nm. In the upper middle part, two instantaneous images were overlaid, labeling the left image in red color and right image in green color. The imaged regions were approx. 10 μm in size, and were selected in fully treated areas, resulting in homogeneous appearances (adapted with permission from Ref. 12, The Optical Society)
15.4.2.3 Femtosecond Laser Excited Fluorescence in a Hydrophobic Intraocular Lens
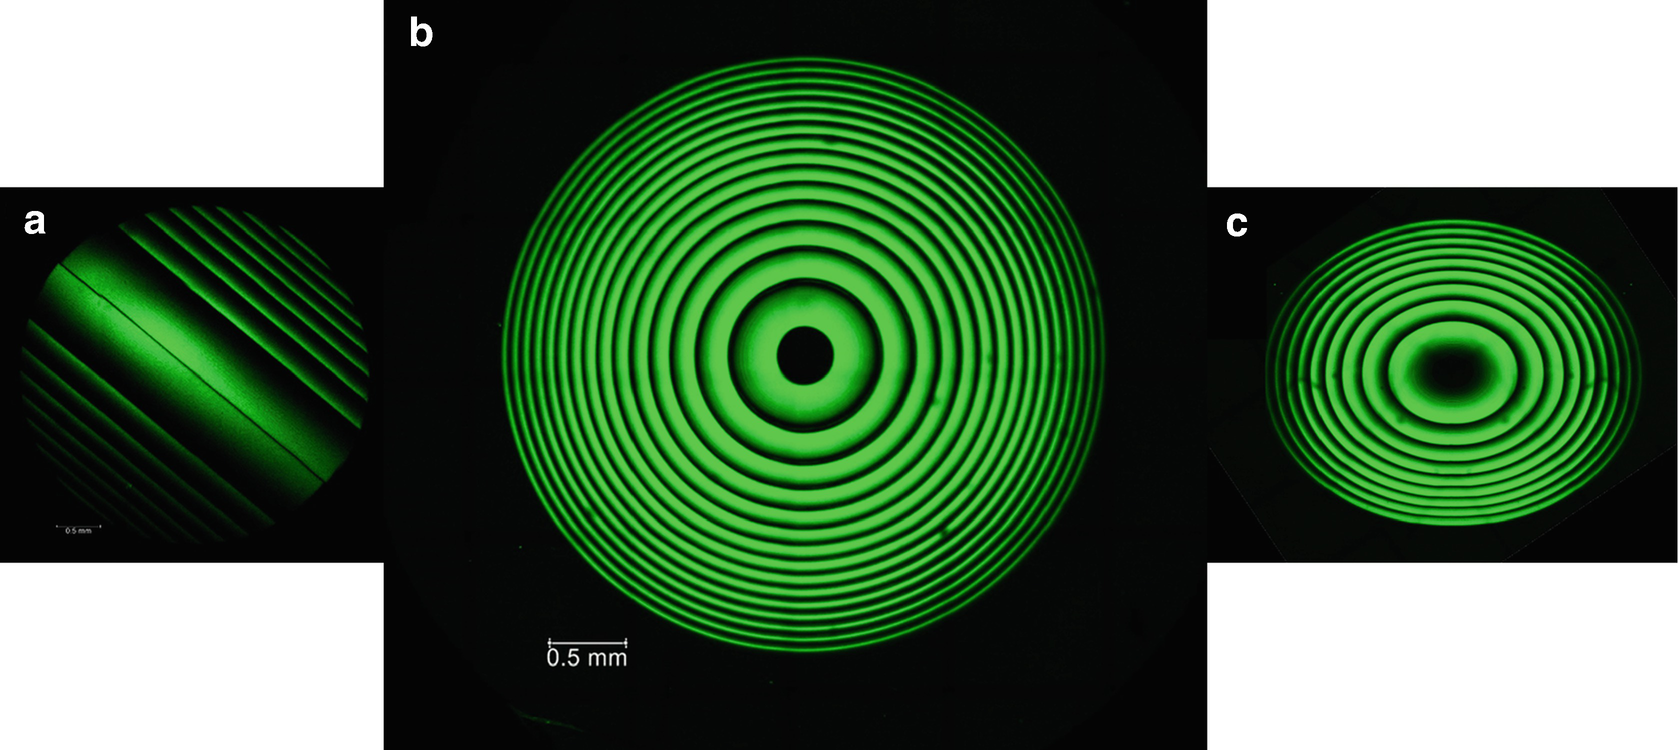
Fluorescence images of hydrophobic, RIS lenses, (a) cylindrical, (b) spherical and (c) spherocylindrical RIS lens

(a) Hydrophobic clear strip (birdview): transmission image (top), fluorescence image (bottom) and the RIS patterns indicated by arrows. (b) Hydrophobic clear strip (sideview): transmission image (top), fluorescence image (bottom). (c) Fluorescence spectra, excitation at 405 nm and emission max. at 500 nm (top), excitation at 488 nm and emission max. at 535 nm (bottom) (sample: Clear hydrophobic strip [20]). (d) Left: Magnified a few μm sized confocal xz-slice (side view) across a bright part of the Fresnel pattern. Right: Magnified confocal xy-slice (top view, at the samples surface) at a bright part of the Fresnel pattern. The fluorescence images were taken simultaneously at 470 nm, resp. 605 nm, resp. 650 nm excitation. (e) High resolution fluorescence xy-images (top view) of clear hydrophobic strip. Left: The darker squared field shows an area which was previously scanned and gradually bleached. Right: The bright band indicates an area where the STED beam was switched off temporarily while the full image was scanned. Thus, the newly created fluorophores show analogous behavior (bleaching and stimulated emission) like regular fluorescent dyes (adapted with permission from Ref. 12, The Optical Society)
In Fig. 15.6c, fluorescence spectra from the RIS-pattern of clear hydrophobic material [20] are shown, with excitation/emission at 405/500 nm, and 488/535 nm, respectively. The spectra closely resemble the spectra of the RIS pattern of yellow hydrophobic material [19], as well as the spectra from the hydrophilic material [18], reaffirming the fact that similar fluorescent molecules are generated in hydrophilic and hydrophobic materials.
Figure 15.6d (left) displays simultaneous xz-scans at three excitation wavelengths (exc 470 nm, em 525/50 nm (upper left); exc 605 nm, em 628/32 nm (upper right); exc 650 nm, em 708/75 nm (lower left)). The bright spot marks the surface of the clear hydrophobic material.
The fluorescence appeared strongest at 605 nm excitation while it was very weak at blue light excitation. Inside the bulk material the intensity drops after a few microns. This is probably caused by a mismatch of the refractive index between the immersion oil and the bulk material. The lower narrow line marks the coverslip glass surface on top of which the sample was mounted.
The clear hydrophobic material was imaged at two fluorescence bands simultaneously (see Fig. 15.6d (right)) (exc 605 nm, em 628/32 nm (upper left) and exc 650 nm, em 708/75 nm (upper right). The fluorescence emissions appear homogeneous in both wavelength bands at a diffraction limited resolution level of 230 nm. The regions imaged in Fig. 15.6d are only approx. 10 μm in size, and are selected in fully treated areas, resulting in homogeneous appearances.
The fluorescent molecules in the clear hydrophobic material bleach [20], i.e. photo-convert into a non-fluorescent species, upon excitation, similar to common organic fluorescent molecules. Figure 15.6e (left) shows a darker square region in the center, which was previously scanned several times. The regions imaged in Fig. 15.6d and e are only approx. 10 μm in size, and are selected in fully treated areas, resulting in homogeneous appearances.
The fluorescent species in the clear hydrophobic material can be stimulated from the excited to the ground state similar to common organic fluorescent molecules. Figure 15.6e (right) shows the fluorescence intensity measured in a STED microscope (see [16]), with excitation laser and STED laser simultaneously switched on. The brighter band shows a region where the STED laser was temporarily switched off. No finer structures could be found with STED imaging contrast. The noise is shot noise from a photon count per pixel of 17 in the bright region and a count of 6 in the regions where the STED laser was on.
15.4.2.4 Identification of Fluorescent Molecules as Benzenamines
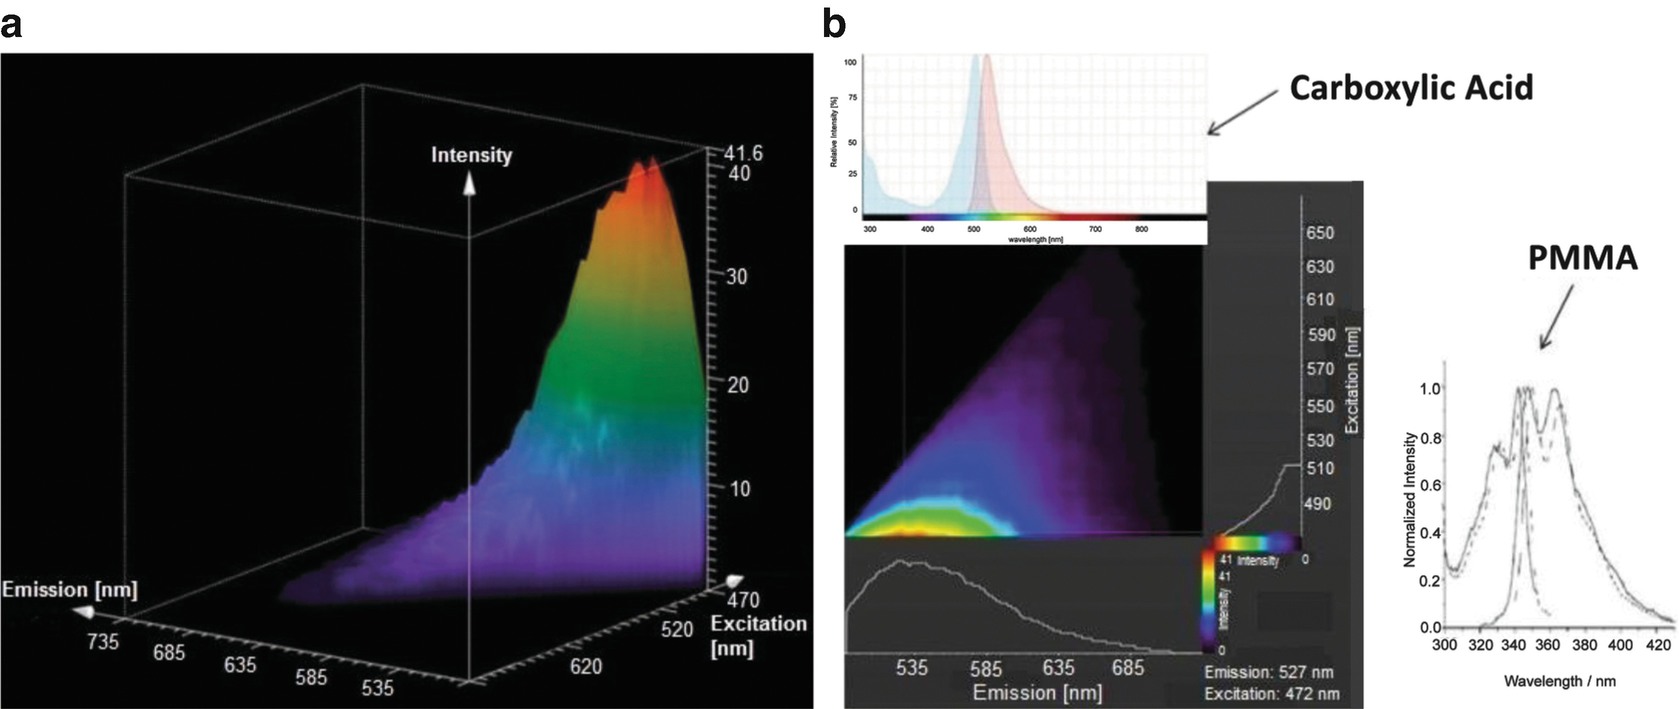
(a) Excitation/Emission Spectra of fluorescent molecule. (b) Identification of fluorescent molecule (adapted with permission from Ref. 12, The Optical Society)
With an excitation wavelength of 472 nm, the emission spectrum of the fluorophore is centered at 527 nm, as depicted in the lower left of Fig. 15.7b (TCS SP8 X (Leica Microsystems GmbH)). In the upper left of Fig. 15.7b, a typical excitation/emission spectrum of an aromatic carboxylic acid Rhodamine Green Carboxylic Acid is plotted for comparison, with excitation at 480 nm and emission centered at 525 nm. Thus, the spectral signature of the femtosecond laser generated polar molecule is similar to the characteristics of an aromatic carboxylic acid. Based on the chemical composition of the acrylic material with UV-dopant copolymer, the spectral signature of the femtosecond laser generated polar molecules points to the class of benzenamines, like N-phenyl-4-(phenylazo)-benzenamine (C18H15N3). For comparison, the excitation/emission spectra of a pure acrylic material, e.g. PMMA, are shown on the lower right side, which are positioned in the deep UV, indicating that the UV-absorber molecules, which get excited by two-photon absorption, are essential to initiate the observed molecular changes.
15.4.2.5 Raman Spectra of Hydrophilic Material
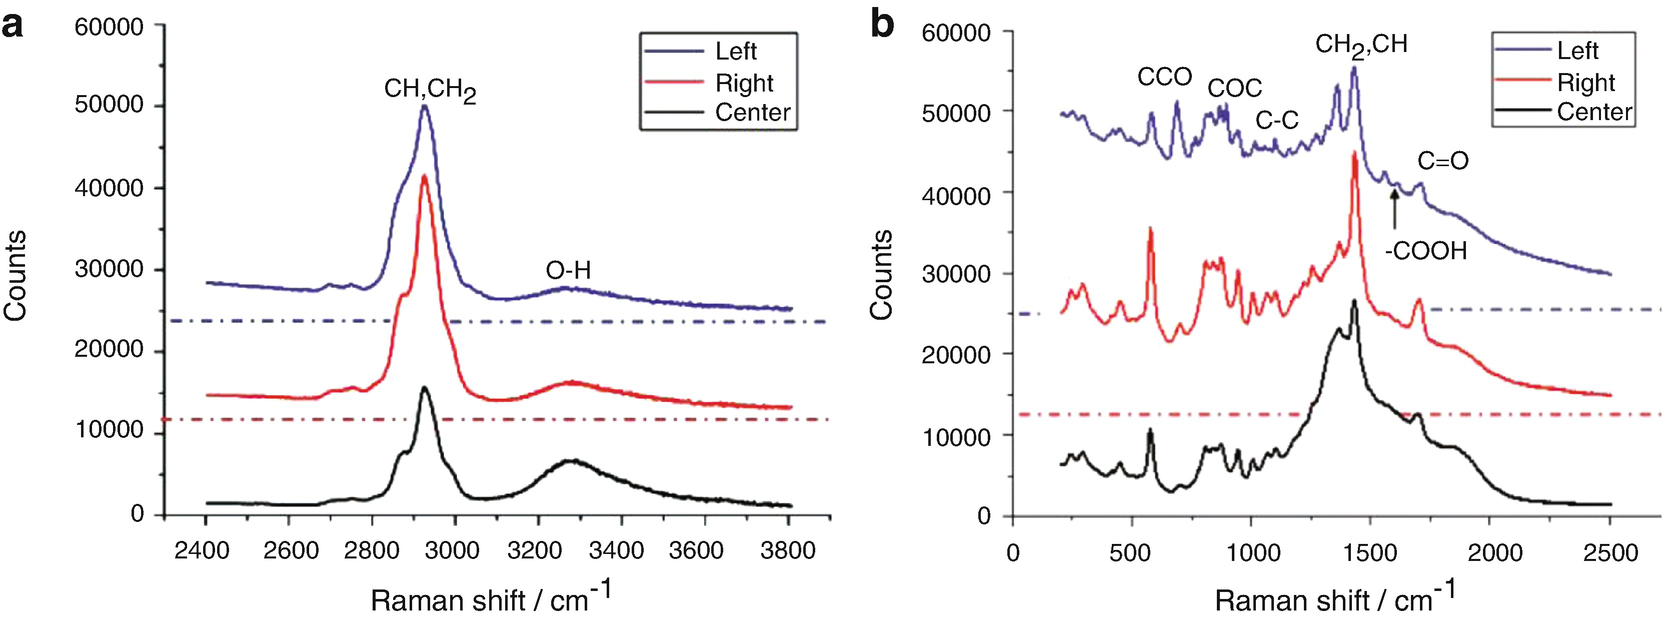
Raman spectra of a hydrophilic material : (a) High-frequency part, (b) Low-frequency part. Dashed dotted horizontal lines represent the zero signal base lines of the respective Raman spectra, which were shifted vertically for the sake of clarity (adapted with permission from Ref. 12, The Optical Society)
Spectral band assignments
Frequency in cm−1 | Possible assignments |
|---|---|
550–610 | CCO stretch |
890–900 | COC stretch |
1080–1120 | C-C stretch |
1340–1375 | CH2 twist and rock |
1400–1460 | CH2 in-plane bending, CH deformation |
1600–1620 | COOH stretch |
1650–1750 | C=O stretch |
2800–3000 | C–H stretch (of CH, CH2 groups) |
3100–3600 | O–H stretch |
15.5 In Vivo Lens Shaping Proof of Concept
15.5.1 Concept and Repeatability
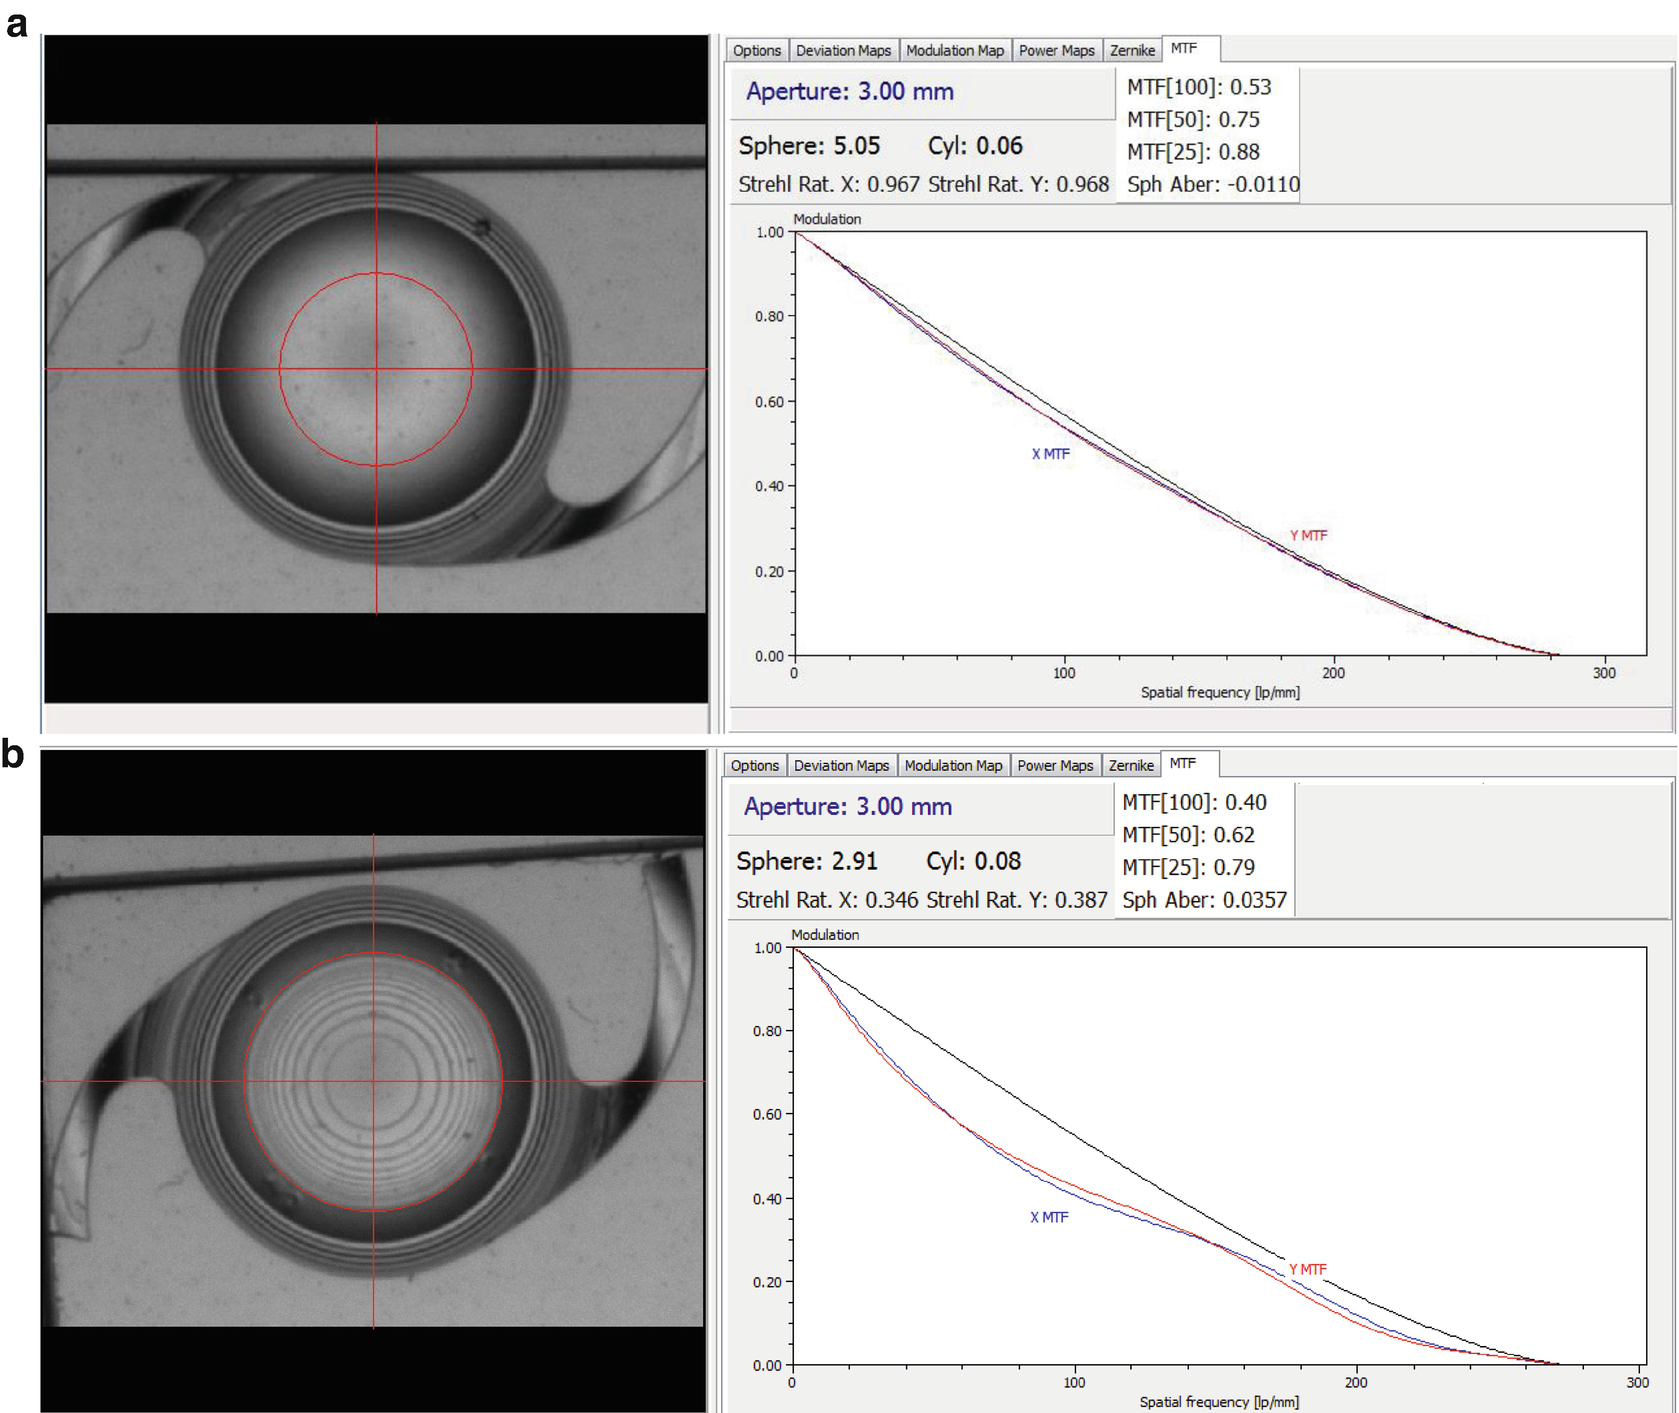
Creation of a −2D RIS change inside one IOL. Diopter readings and MTF before (a) and after (b) RIS treatment

Creation of a −2 D and +2 D RIS change inside one IOL. Modulation map and diopter power map readings before (a) and after (b) RIS treatment
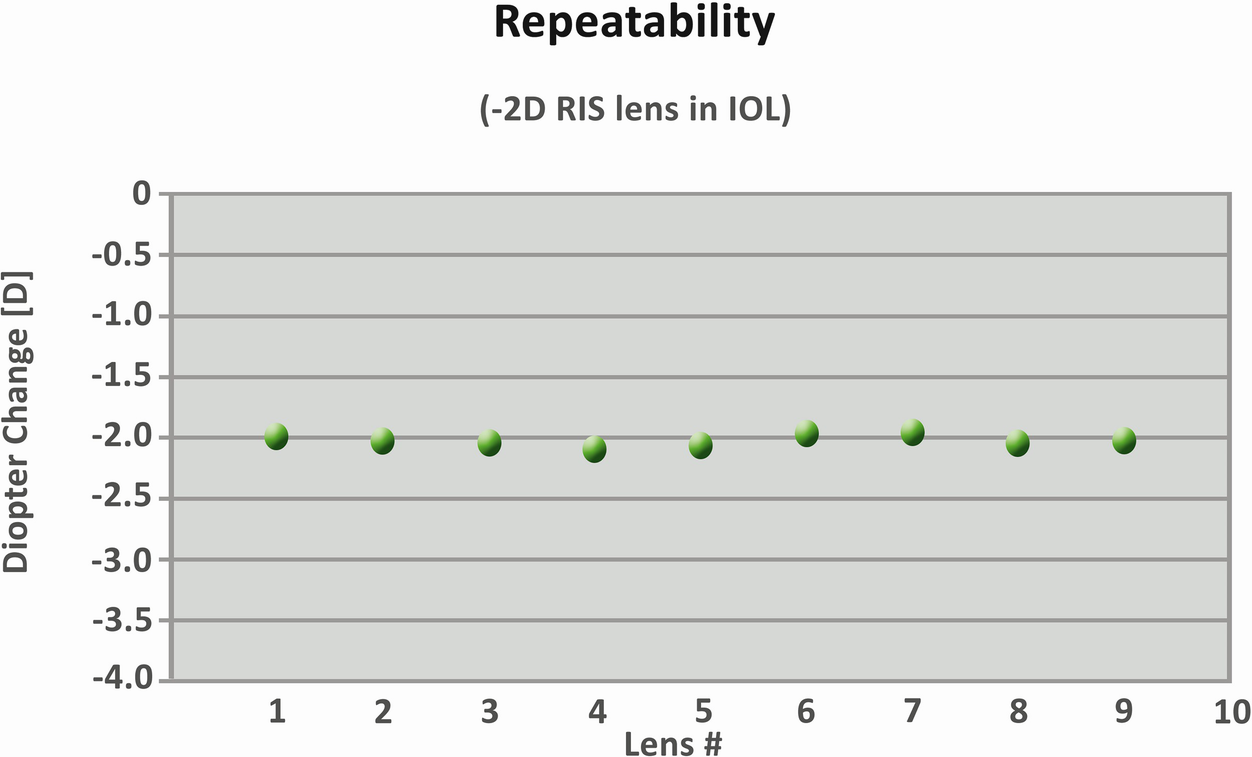
Repeatability of a −2 D refractive index shaping lens
15.5.2 Adjustment of Sphere
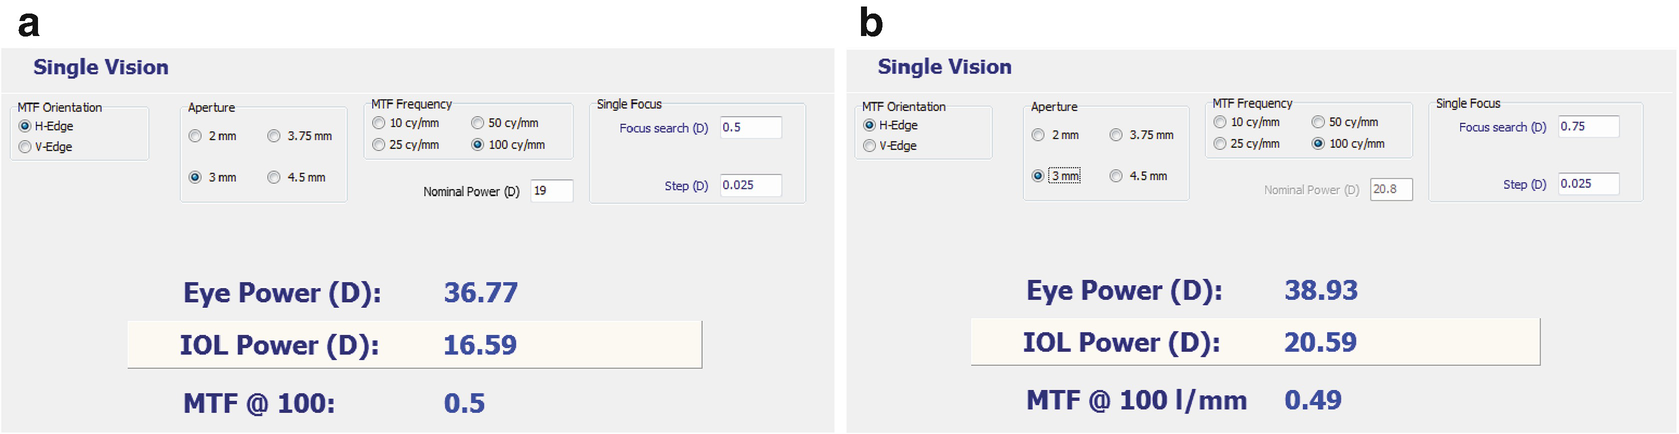
Diopter readings and MTF before (a) and after (b) RIS treatment
15.5.3 Conversion from Monofocal to a Toric IOL

Converting monofocal IOL into a toric IOL ; schematic view (a), before and after RIS (b)
15.5.4 Conversion from Monofocal to Multifocal
Conversion of a monofocal IOL to multifocal IOL , before (a) and after (b) RIS
15.6 Biocompatibility of Intraocular Lens Power Adjustment
An in vivo study on rabbit eyes confirmed that postoperative outcomes in terms of uveal and capsular biocompatibility were similar for treated lenses and untreated lenses. The laser power adjustment procedure did not induce inflammatory reactions in the eye or damage to the IOL optic.
Overall, all implantation procedures were uneventful and the IOLs could be fully injected within the capsular bag. At the 1-week examination, nearly all operated eyes had a mild inflammatory reaction with fibrin in front of the lens or at the level of the capsulorhexis edge. Fibrin formation had completely resolved by the 2-week examination, when a mild amount of PCO started to be observed in nearly all eyes. Most eyes at this time point also had proliferative lens cortical material or pearl formation in front of the IOL.
All laser power adjustment procedures were also uneventful, and the duration of the laser treatment per se was fast (23 s). Under slit lamp examination, the phase-wrapped structure created by the laser could be observed within the optic substance of all treated IOLs. The examination also showed the formation of gas bubbles between the posterior surface of the IOL and the posterior capsule, which disappeared within 5 h. Other observations included mild corneal edema and conjunctival infection, which could be related to the eye remaining open during the alignment step of the procedure. No aqueous flare, cells, iris hyperemia, or fibrin formations were observed at any of the post-laser slit lamp examinations, and the process did not create glistening’s in the IOLs [34, 35].
The consistency and precision of the power changes induced by the laser have been shown in vitro. Another recent study [13] found that the refractive-index change altered the dioptric power of commercially available yellow hydrophobic acrylic IOLs to within ±0.1 D of the targeted change without a significant reduction in the MTF. A more recent study performed in our laboratory also showed the consistency and precision of the power change by this technology in commercially available hydrophobic acrylic lenses with and without a blue-light filter, without inducing significant changes in IOL light transmission.
Power of the IOLs implanted in the rabbit eyes , measured with a PMTF device after explantation of the lenses 4 weeks postoperatively after full hydration
IOL power (D) | |||
|---|---|---|---|
Rabbit | Treated | Contralateral untreated | Change |
1 | +26.5 | +23.2 | +3.3 |
2 | +26.9 | +23.2 | +3.7 |
3 | +27.0 | +23.7 | +3.3 |
4 | +26.7 | +23.1 | +3.6 |
5 | +27.0 | +23.0 | +4.0 |
6 | +26.8 | +23.2 | +3.6 |
The most likely cause of postoperative refractive errors after IOL implantation is incorrect IOL calculation resulting from incorrect measurements of the eye [36]. Also, current standards regarding IOL power labeling allow a tolerance of ±0.30 D for IOLs of 0.00 D to 15.00 D or less. The tolerance increases to ±0.40 D for IOLs with a power from greater than 15.00 D to 25.00 D or less, which means that an IOL of 22.61 D and another of 23.39 D could be labeled with a dioptric power of 23.00 D or the IOL of 23.39 D could be labeled as both 23.0 D and 23.5 D [37]. All these factors make postoperative IOL adjustment technologies particularly interesting.
15.7 Discussion and Conclusion
The RIS treatment (see e.g. Fig. 15.1a) uses a femtosecond laser to change the hydrophilicity of the targeted area, which allows for a change in the refractive index. This effect in combination with a two dimensional scan pattern allows for the creation of a refractive or diffractive lens inside the material.
A photochemical process was identified, wherein hydrophilic polar functional groups are generated by photo-induced hydrolysis of polymeric material, in areas which are exposed to a femtosecond laser, thus providing the chemical basis for a hydrophilicity based refractive index change, facilitating the creation of a RIS-lens. The newly formed functional groups, e.g. amines and carboxylic acids, are strongly hydrophilic. The molecules are monomers or dimers, embedded in the original polymer and the UV-absorber co-polymer. These molecules remain in their existing place and are modified by the exposure to the laser light. In three different polymeric materials, fluorophores with identical spectral signatures were detected. Thus, photo-induced hydrolysis results in rearrangements of chemical bonds, essentially within the UV-absorber molecule, preserving the integrity of the polymeric material. Based on fluorescence microscopy, STED microscopy and Raman microscopy, no leachables are generated. Also, standard leachable tests have been performed on RIS-modified IOLs, and no leachables were found.
The results of the first in vivo study evaluating the biocompatibility of this new application of the femtosecond laser are reported. Refractive Index Shaping (RIS) can be applied to any commercially available hydrophobic or hydrophilic acrylic IOL because the process does not depend on a special IOL material. Power adjustment is noninvasive and fast and can be performed under topical anesthesia. The dioptric power of the IOL can be increased or decreased to account for surgical errors, IOL tilt, IOL decentration, or a change in the physical characteristics of the eye. Multiple adjustments to the same IOL can be performed because each adjustment only changes a very thin layer within the IOL optic substance. Premium functions can be added to the IOL and removed later, if necessary. An added multifocal pattern can, for example, be canceled by application of a pattern with opposite characteristics. The use of special protective spectacles is not necessary after treatment and the process works with standard hydrophilic and hydrophobic available intraocular lenses.
Refractive Index Shaping (RIS) is an exciting technology with the ability to precisely change the power of an intraocular lens. The RIS process is not based on a lens but on a device, which is currently not yet approved. This technology has the potential to change the course of ophthalmic cataract surgery and lens accuracy in the future. It is hopeful that this technology will allow a minimally invasive treatment for the management of refractive surprises after cataract surgery. It is exciting to imagine treatments to improve residual refractive errors will minimally invasive office procedure. To remove the surgical risks and move the treatment from the operating room to an in-office procedure.
In conclusion, postoperative lens customization utilizes femtosecond laser technology to adjust the power of an implanted IOL. A minimally invasive laser treatment provides a customized vision correction of a patient, who has had previous cataract surgery, to optimize the patient’s vision. This new technology gives the surgeon an additional opportunity to improve a patient’s sight. It separates the customization of the lens from the original cataract surgery giving both the patient and the doctor time to discuss and consider this treatment.

Open Access This chapter is licensed under the terms of the Creative Commons Attribution 4.0 International License (http://creativecommons.org/licenses/by/4.0/), which permits use, sharing, adaptation, distribution and reproduction in any medium or format, as long as you give appropriate credit to the original author(s) and the source, provide a link to the Creative Commons license and indicate if changes were made.
The images or other third party material in this chapter are included in the chapter's Creative Commons license, unless indicated otherwise in a credit line to the material. If material is not included in the chapter's Creative Commons license and your intended use is not permitted by statutory regulation or exceeds the permitted use, you will need to obtain permission directly from the copyright holder.