5.1 Introduction
The detection and monitoring of glaucoma customarily involves several processes that include diagnostic modalities such as subjective evaluation of the optic nerve head (ONH), visual field testing , and intraocular pressure measurements . These traditional methods of assessing glaucoma have several key limitations that dictate the need for supplementary approaches. The diagnostic assessment of the ONH in glaucoma by ophthalmoscopic examination or serial stereoscopic photographs is highly dependent on observer skills, inducing high inter-observer and intra-observer variation that affects its utility [1–3]. Visual field analysis through automated perimetry is a widely used technique that is considered an established clinical endpoint and is arguably the gold-standard for evaluation of glaucoma and for monitoring of disease progression. Although it is sensitive and specific at detecting glaucomatous functional loss, automated perimetry has several significant limitations [4–7]. The test requires the subjective input of the tested individual, making it prone to high short- and long-term fluctuation. The high fluctuation of the test, induced by its subjective nature, necessitates multiple tests to improve the reliability of the technique, delaying the recognition of glaucomatous damage [8]. Several studies have shown that detectable glaucomatous field abnormalities may be preceded by structural changes of the ONH and nerve fiber layer [9–18] Furthermore, intraocular pressure (IOP) is the major identified risk factor for the development of glaucomatous damage and is the only modifiable risk factor to date. Although lowering IOP serves to impede the progression of retinal ganglion cell degenerative change [19–21], the high inter-individual variability and the diurnal variation in the intraocular pressure have limited the use of this parameter for the detection of the disease. Moreover, intraocular pressure values do not indicate whether damage has occurred, or to what extent. In addition, elevated IOP (i.e. ocular hypertension ) does not necessarily result in glaucomatous damage [14].
While detection of glaucomatous structural damage to the eye during the earliest stage and precise assessment of this change are critical aspects of managing the disease, both feats are challenging. Glaucomatous damage is largely irreversible and, therefore, eyes with structural damage must be identified as early and as accurately as possible because they are at risk for continued injury. It has been suggested that the earlier glaucoma is detected and treated, the greater the likelihood that medical or surgical intervention will delay or prevent the progression of glaucomatous neuropathy and subsequent functional impairment [22–24]. Furthermore, because glaucoma progresses slowly, it is important to detect real change due to disease that is beyond normal age-related loss and short-term and long-term fluctuations. This assumption underscores the need for an accurate and reproducible quantitative evaluation of the eye.
During the past three decades, there has been significant development and implementation of several imaging technologies designed to objectively and quantitatively detect glaucomatous neuropathy at early stages of disease. Beyond early detection, quantitative and objective imaging devices offer a more sensitive way to detect glaucomatous progression when compared with clinical qualitative assessments. One of the earliest imaging devices introduced to the ophthalmic field was a confocal scanning laser ophthalmoscope (cSLO) , a device developed to assess optic disc topography in the late 1980s (Laser Tomographic Scanner, Heidelberg Instruments). With reductions in cost and the advent of improved hardware, the introduction of the first practical commercial cSLO device was introduced in 1991 [Heidelberg Retina Tomograph (HRT); Heidelberg Engineering, Heidelberg, Germany].
Imaging instruments provide objective, quantitative measures of neuroretinal rim thinning , RNFL atrophy , and excavation of the optic cup, and are increasingly utilized in the clinical management of glaucoma patients. This is due in part to the availability of summary information that can easily be used in clinical management decisions. For example, most instruments now include a reference database for making statistical indications of whether a patient measurement is “Within Normal Limits,” “Borderline,” or “Outside Normal Limits.” In addition, each device provides a measure of image quality so that the clinician can determine whether the image is of sufficient quality to be utilized in clinical management decisions. With continuous developments in imaging technology like spectral domain OCT (SD-OCT) and advancements in research applications of such technologies, the value of these devices in glaucoma management is likely to continue growing.
Although in vivo imaging with cSLO, time-domain OCT (TD-OCT) , and spectral-domain OCT (SD-OCT) have been commercially available for the management of glaucoma for over 10 years, interpretation and utilization of such results remains a challenge. However, clinical research continues to significantly advance the relevance and utility of diagnostic imaging devices by enabling visualization of high-resolution and detailed images and to provide sophisticated data analysis strategies. Such improvements increase efficiency while providing precise, accurate analysis of the retinal data produced by each device [25–27]. This chapter will review diagnostic imaging techniques that have advanced and continue to advance diagnosis and management of glaucoma.
5.2 The Heidelberg Retina Tomograph: Confocal Scanning Laser Ophthalmoscope (cSLO)
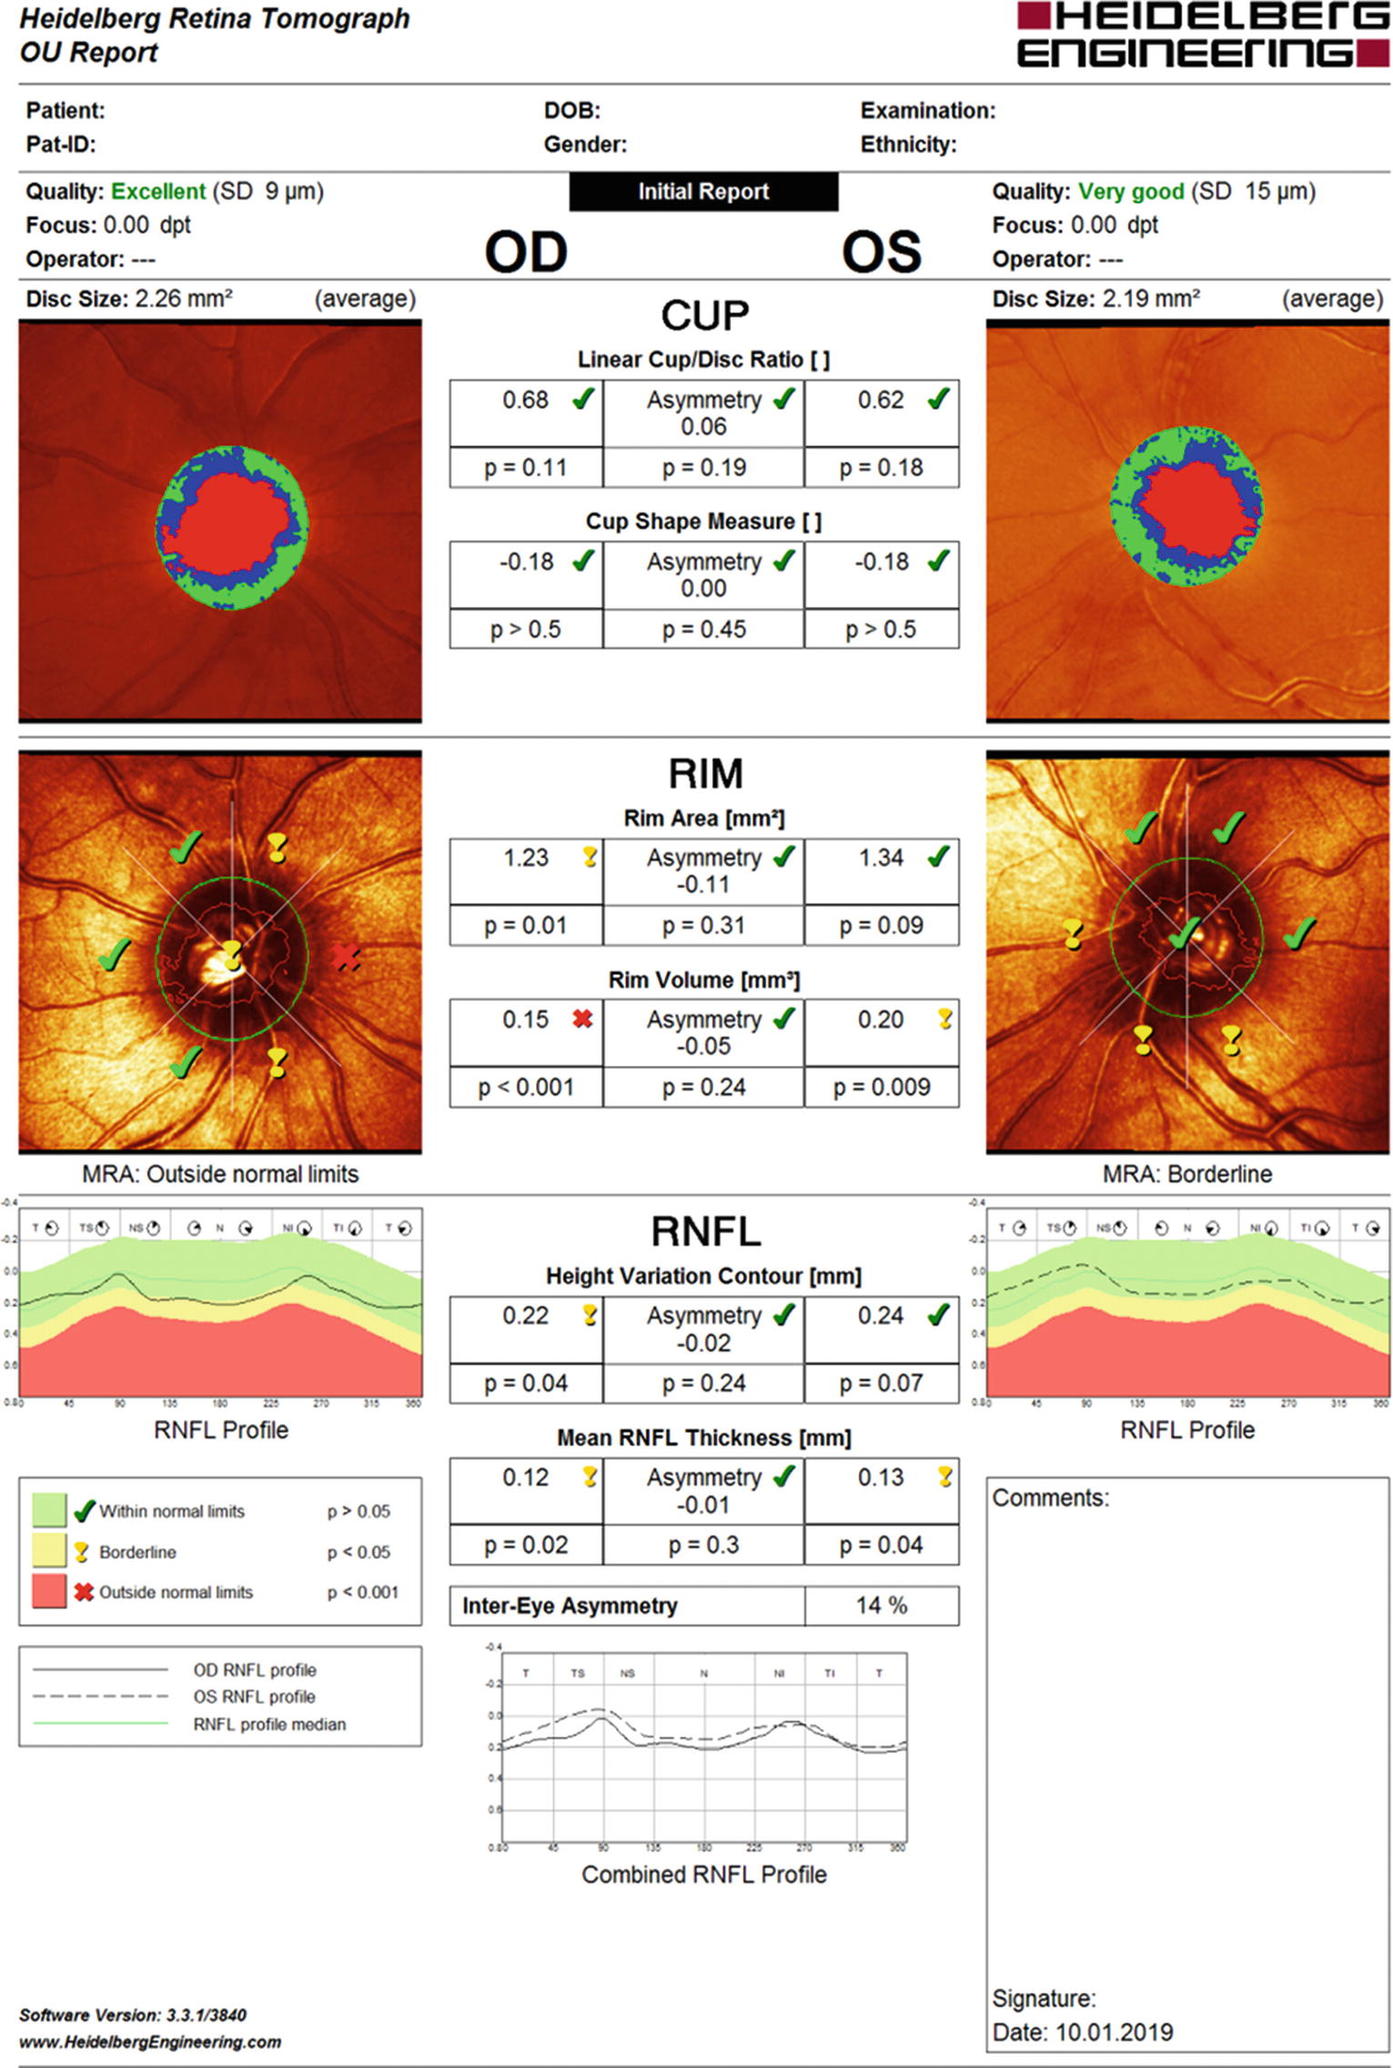
After manually delineating the optic disc margin by placing a contour line along the inner edge of the scleral ring at the baseline exam, stereometric parameters are provided to describe the retinal topography of each image. Stereometric parameters include: disc area (area within contour), rim area (area within contour and above reference plane), cup area (area within contour and below reference plane), rim volume, cup volume, mean cup depth, mean height of contour, an indirect measure of retinal nerve fiber layer (RNFL) thickness, and cup shape
5.2.1 Clinical Development
Several key clinical research studies contributed to the advancement and development of the cSLO technology for assessment of the optic nerve head. In 1993, Weinreb et al. recommended acquiring multiple images at each visit , and showed that with three images one could obtain excellent reproducibility within a short time for a reasonable cost [28]. This study led to the implementation of software that automatically acquires three sets of three-dimensional images each time. If the quality of images in at least one of the series is not good enough (for reasons such as fixation loss), the acquisition is automatically continued until three useful series are obtained . The same group also showed the SLO imaging is highly reproducible in patients with [29] or without undilated pupils [30]. There was no significant difference between the standard deviation of a single height measurement in normal and glaucomatous eyes. No correlation was found between standard deviation of the measurements and pupil size or age of the subject [29]. Zangwill et al. demonstrated a moderate agreement between clinicians and a HRT in estimating cup/disc ratios with the highest disagreements in discs with gradual slopes and pallor. New quantitative criteria then were established for characterizing a disc as glaucomatous using HRT [31]. A quantitative method was then developed for analysis of the topographic relationship between structural and functional damage in patients with glaucoma [32].
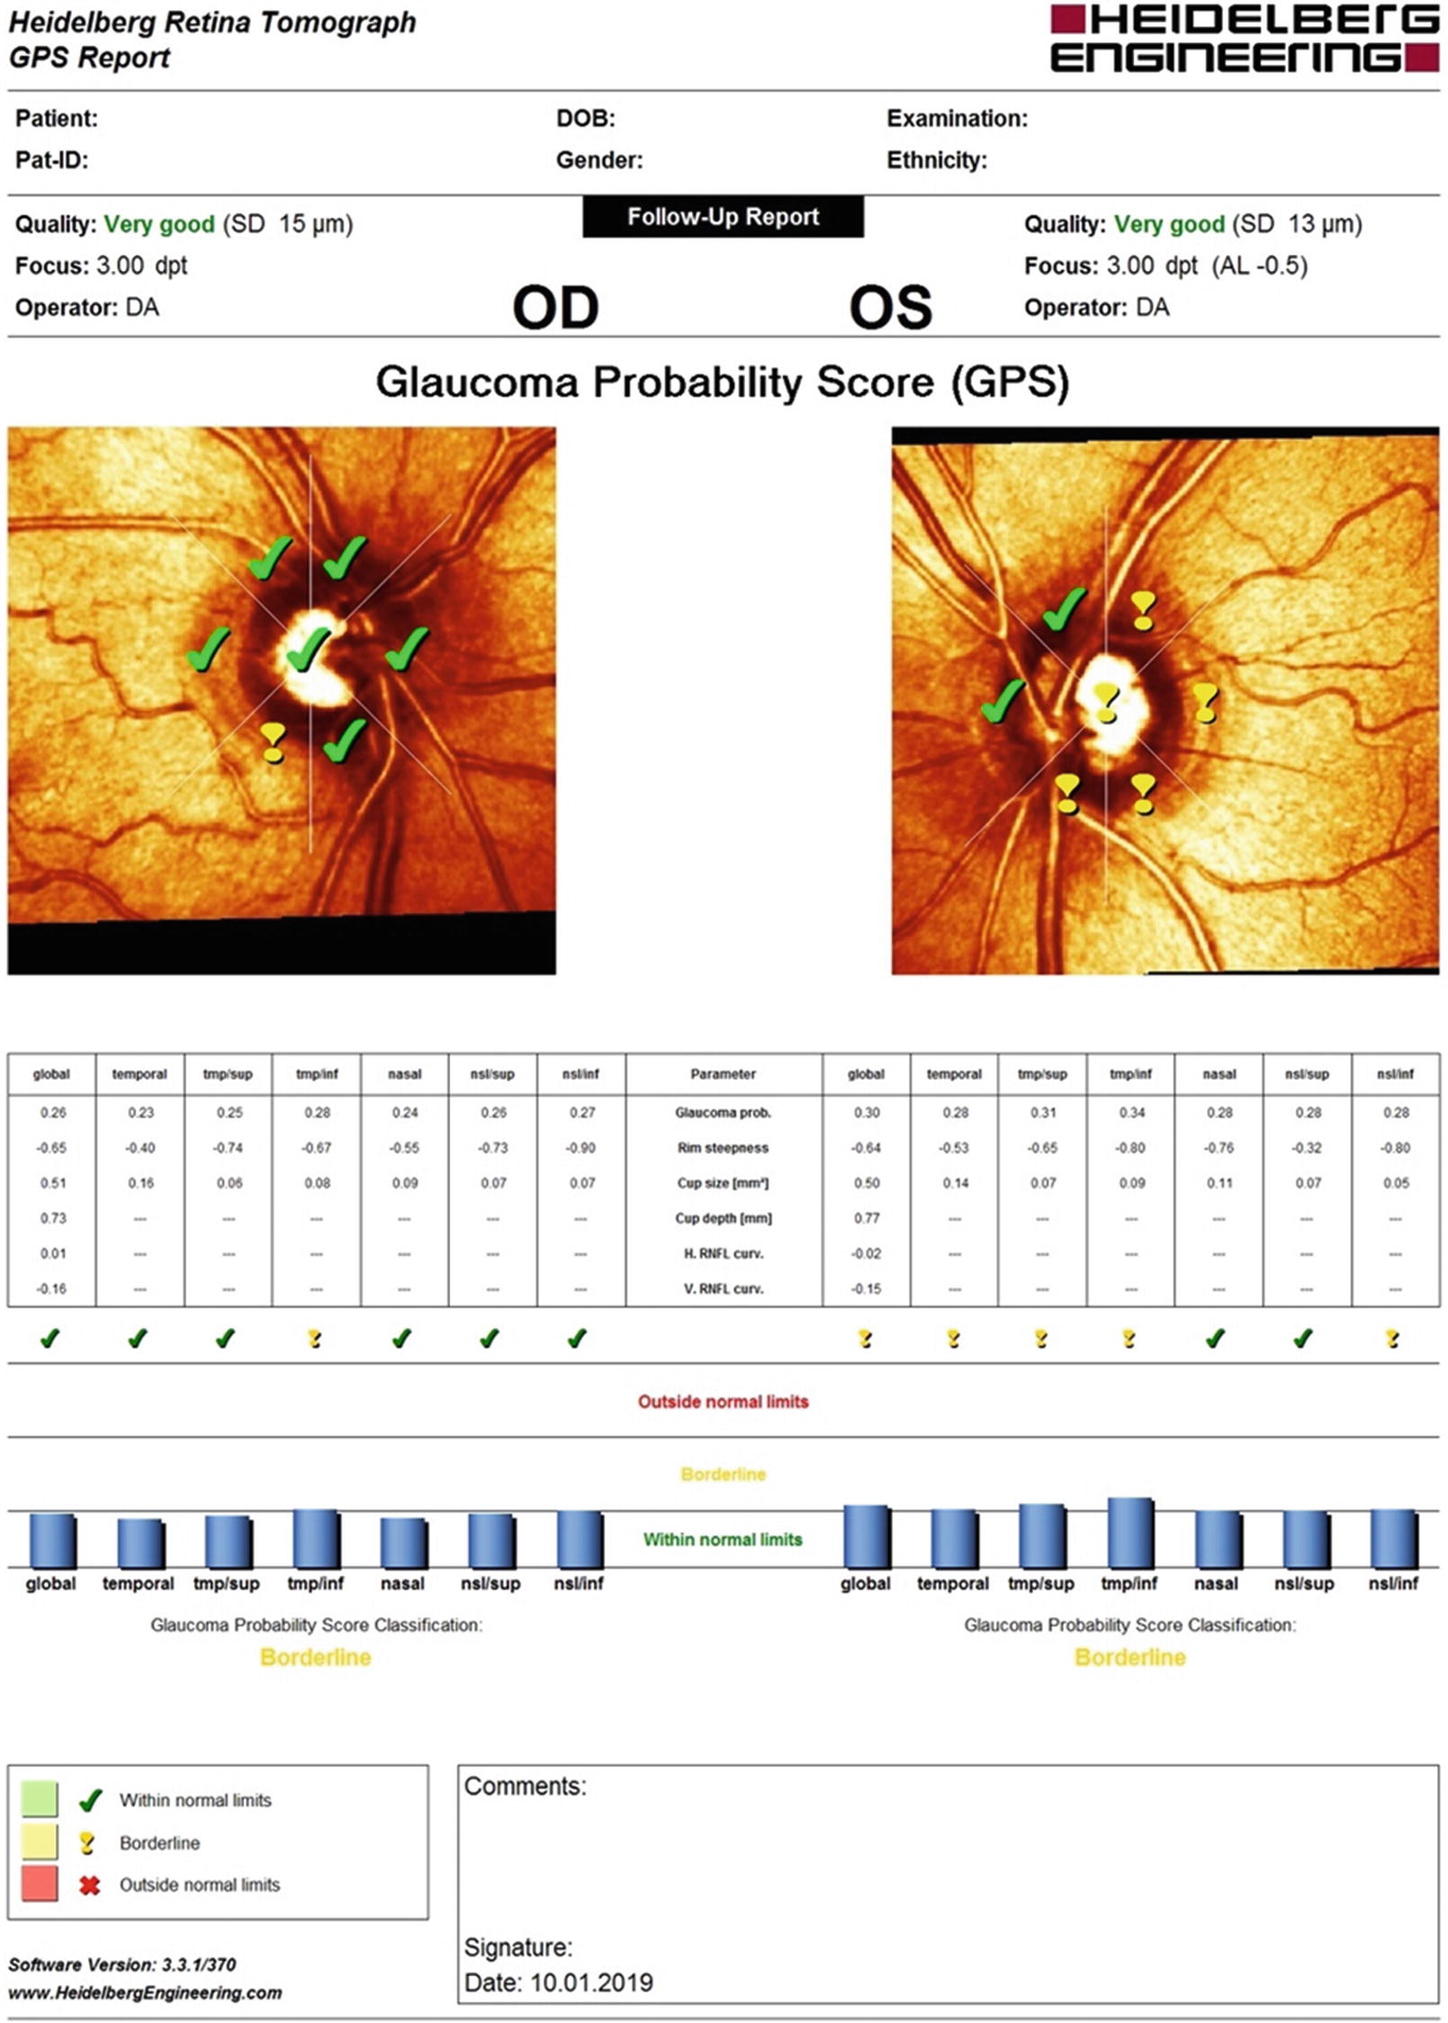
The Glaucoma Probability Score (GPS) uses a geometric model to describe the shape of the optic disc/parapapillary retina (globally and locally) based on five parameters. The resulting output describes the probability that the eye is glaucomatous. This technique does not depend on an operator drawn contour line or a reference plane and is therefore operator independent. Results are reported as ‘within normal limits’, ‘borderline’ or ‘outside normal limits’ globally, and for each of six disc sectors relative to the normative data
In 2000, Chauhan et al. [36] introduced Topographic Change Analysis (TCA) , a progression analysis tool that became a gold-standard in the assessment of glaucomatous ONH changes. The TCA quantifies the change in the topography of the ONH using the first image as the baseline and the subsequent images as follow-up examinations. The TCA does not require a defined contour line to determine areas of significant change as it assesses the height of the optic disc and retinal surface at each follow-up measurement and compares these to the baseline measurement. The images are further analyzed using an array of 4 × 4 pixels, called super-pixels. Superpixels allow for pooling over a larger area and yield more repeated measures for analysis. In steep areas like the edge of the cup, the variability is greater than that in flat areas. The topographic measurement of a superpixel (4 × 4 pixels) and an analysis of variance model for each superpixel is then calculated.
5.2.2 Clinical Validation
The combination of these HRT (cSLO) diagnostic tools became the gold standard for imaging and monitoring of the optic nerve head in glaucoma, in the early- to mid-2000s. Several large and seminal studies contributed to the validation of the diagnostic parameters offered by the HRT.
Bowd et al. validated the clinical utility of this tool by showing that TCA parameters can discriminate between progressing glaucoma eyes and longitudinally observed healthy eyes, suggestive of the ability of the HRT with TCA to detect early ONH changes due to glaucoma [37]. The Ocular Hypertension Treatment Study (OHTS) , sponsored by the National Institutes of Health/National Eye Institute, is a multicenter randomized clinical trial designed to evaluate the safety and efficacy of topical glaucoma medication in delaying or preventing the onset of glaucomatous VF loss or optic nerve deterioration in participants with ocular hypertension [14, 38]. In OHTS , the presence of clinically significant disc changes during follow-up was determined by evaluation of serial stereoscopic optic disc photographs.
The Confocal Scanning Laser Ophthalmoscopy Ancillary Study to the Ocular Hypertension Treatment Study was the first multicenter clinical trial to use cSLO imaging to monitor changes in the optic disc [39]. This study evaluated the effectiveness of various HRT parameters in detecting the presence and progression of glaucomatous optic disc damage and determined whether optic disc topographic measurements are an accurate predictor of visual field loss. The 451 participants in the OHTS CSLO ancillary study were recruited from seven of the 22 OHTS centers and the HRT examinations were obtained annually after pupillary dilation at the time of scheduled OHTS fundus examination and optic disc photography.
The baseline data from OHTS indicated that cSLO measurements correlated well with expert evaluation of stereoscopic photography and that differences in topographic optic disc parameters between African Americans with ocular hypertension and other racial groups are largely explained by the larger optic disc area in the African Americans [38–40]. This latter result highlighted the need to consider race and optic disc size when evaluating the appearance of the optic disc in glaucoma. Therefore, several of the parameters implemented in the HRT are reported and compared to a race specific normative database.
5.2.3 Surrogate Endpoints and Progression
The HRT neuroretinal rim parameters have been shown to be predictive of functional loss and to serve as suitable surrogate endpoints in glaucoma clinical trials [15, 41–44]. The OHTS data also showed that baseline topographic optic disc measurements can predict the onset of primary open angle glaucoma in patients with ocular hypertension [15]. OHTS results suggest that baseline GPS, MRA, and stereometric parameters alone or when combined with baseline clinical and demographic factors can be used to predict the development of POAG endpoints in OHTS participants and are as effective as stereophotographs for estimating the risk of developing POAG in ocular hypertensive subjects [15, 41]. In 2008, Alencar et al. assessed whether baseline GPS results are predictive of progression in patients suspected of having glaucoma . Their study results showed that baseline GPS are in fact predictive and that they perform as well as subjective but expert assessment of the optic disc. They further suggested that the HRT GPS could potentially replace stereophotographs as a tool for estimating the likelihood of conversion to glaucoma [42]. In 2009, Chauhan et al. concluded that patients that presented with glaucomatous visual field progression were up to three times more likely to have prior disc changes as measured on TCA [43]. Medeiros et al., showed that progressive rim area loss, as defined by the HRT parameters, was highly predictive of the development of visual field loss in glaucoma and explained a significant proportion of the effect of treatment on the clinically relevant outcome [44]. They suggested that rim area measurements may be suitable surrogate endpoints in glaucoma clinical trials [44].
The Diagnostic Innovations in Glaucoma Study (DIGS) and the African Descent and Glaucoma Evaluation Study (ADAGES) are large multi-center ongoing studies that include normal subjects, patients with glaucoma, and glaucoma suspects , who are semi-annually evaluated clinically and with several functional and optical imaging tests including HRT and SD-OCT. The 3-site collaboration includes the Hamilton Glaucoma Center at the Veterbi Family Department of Ophthalmology (RN Weinreb), University of California, San Diego (UCSD) (Data Coordinating Center) (L Zangwill), Columbia University and the New York Eye and Ear Infirmary (J Liebmann), and the Department of Ophthalmology, University of Alabama, Birmingham (C Girkin and M Fazio) [45, 46].
Results from DIGS confirmed earlier reports of the comparability of stereophotograph based cup-to-disc ratio measurements and HRT measures in predictive models [47]. The same group also concluded that the presence of optic disc damage on stereophotographs is highly predictive of future development of functional loss [48]. They later showed that the rate of rim area loss measured using HRT is approximately 5 times faster in eyes in which POAG developed compared with eyes in which it did not. The results of this study, suggest that measuring the rate of structural ONH change using cSLO-based parameters can provide important information for the clinical management of ocular hypertensive patients [49].
The ADAGES group characterized the rate and pattern of age-related and glaucomatous neuroretinal rim area changes in subjects of African and European descent, using HRT parameters. They showed that compared with healthy eyes, the mean rate of global rim area loss was 3.7 times faster and the mean rate of global percentage rim area loss was 5.4 times faster in progressing glaucoma eyes [50].
5.2.4 Summary
Heidelberg Retina Tomograph cSLO technology introduced the ability to objectively quantify various diagnostic parameters for the assessment and management of glaucoma. The technology’s diagnostic parameters offer clinicians with an objective and precise method to aid their decision in the diagnosis and management of the disease, while also serving as potential surrogate endpoints in clinical trials. A more recent imaging technology, spectral domain optical coherence tomography (SD-OCT), which also enables to objectively image and assess the optic nerve head as well as the retinal nerve fiber layer and macula, has been established as the most current commonly used diagnostic imaging aid for glaucoma.
5.3 SPECTRALIS SD-OCT
With the introduction of SD-OCT, it has become possible to image ocular structures in three dimensions with high axial resolution, fast scan rates, and high contrast. These advances have improved visualization of small details and provided a platform for precise analytics. The benefits of SD-OCT technology, combined with eye-tracking algorithms that enable precise scan registration from session to session allow for reliable removal of errors induced by eye movements. The resulting scans offer detailed visualization of retinal structures and provide accurate segmentation of the anatomical boundaries used in advanced analytics.

A core technology of the SPECTRALIS is TruTrack (a), a dual-beam tracking system which provides very important clinical benefits such as retinal recognition, follow-up scanning, precise co-localization of fundus images with depth-resolved information in OCT-scans. This system also enables the Automatic Real-time Tracking (ART) technique for image averaging to improve image quality by reducing noise (b)
The standard SPECTRALIS SD-OCT glaucoma software includes RNFL thickness measurements derived from a 12° circle scan, manually centered by the operator on the optic disc. The RNFL thickness analysis then provides sectorial and global measurements that are compared with a reference database of healthy controls. The RNFL thickness values for a scan are classified using a 6-sector analysis , and sectors can be flagged green (“Within Normal Limits”), yellow (“Borderline”), and red (“Outside Normal Limits”). RNFL parameters of the SPECTRALIS have been evaluated relative to other commercially available SD-OCT devices and shown to be as specific, sensitive, and repeatable [51, 52].
While several SD-OCT devices are commercially available, Heidelberg Engineering has included several unique features and functionalities with the intent to account for relevant factors that may influence the resulting diagnostic parameters. The Glaucoma Module Premium Edition (GMPE) offers new scan patterns and an updated reference database that was acquired using these new features and functionalities, designed to enhance and support the clinical assessment of glaucoma by accounting for anatomic variability of each eye to improve classifications.
5.3.1 Clinical Assessment of Optic Nerve Head Parameters
The retinal ganglion cell (RGC) axons comprise the RNFL with axons exiting the eye via the optic nerve head. The health of the optic nerve head can be assessed based on the amount of neuroretinal rim tissue present . Because the axons exiting the eye make up a significant portion of the neuroretinal rim, its loss is associated with RGC and axonal degeneration, both of which are characteristic of glaucomatous damage. The optic disc constitutes the clinically visible surface of the neural and connective tissues of the ONH. The health of the neuroretinal rim is defined using two landmarks: the optic disc margin and the optic cup margin. These two landmarks define the outer edge (clinical disc margin) and inner edge (optic cup margin) of the neuroretinal rim. The amount of rim tissue then is estimated within the apparent plane of the disc margin as either the ratio of the size of the cup to the size of the disc [53] or the rim area [54]. An eye that exhibits a large CDR is indicative of potential glaucomatous damage as axonal loss results in expansion of the optic disc cup. However, both the optic disc and cup margin are defined subjectively and are difficult to delineate consistently [55]. Therefore, the resultant CDR and clinical neuroretinal rim quantification are variable. Furthermore, these concepts are applied whether the examination is performed with direct ophthalmoscopy, slit-lamp biomicroscopy, optic disc photography, or a number of quantitative imaging methods.
The more recent SPECTRALIS SD-OCT with OCT2 Module technology provides a new level of high-resolution imaging of ONH anatomic features that are affected in glaucoma. Clinicians can now visualize optic nerve structures such as the anterior and posterior lamina cribrosa surfaces, Bruch’s membrane-retinal pigment epithelium complex and its termination within the ONH border, tissue of Elschnig, and the scleral canal opening [55–65]. Studies show that accurate co-localization of fundus photographs to SD-OCT image data allows clinicians to identify structures that correspond to common clinical landmarks such as the optic disc margin [56, 66]. SPECTRALIS imaging and measurement of the ONH landmarks support interpretation of fundus images and can objectively assist in clinical assessment of the nerve in three dimensions.
5.3.2 Bruch’s Membrane Opening (BMO) in SD-OCT-Based Neuroretinal Rim Measurements
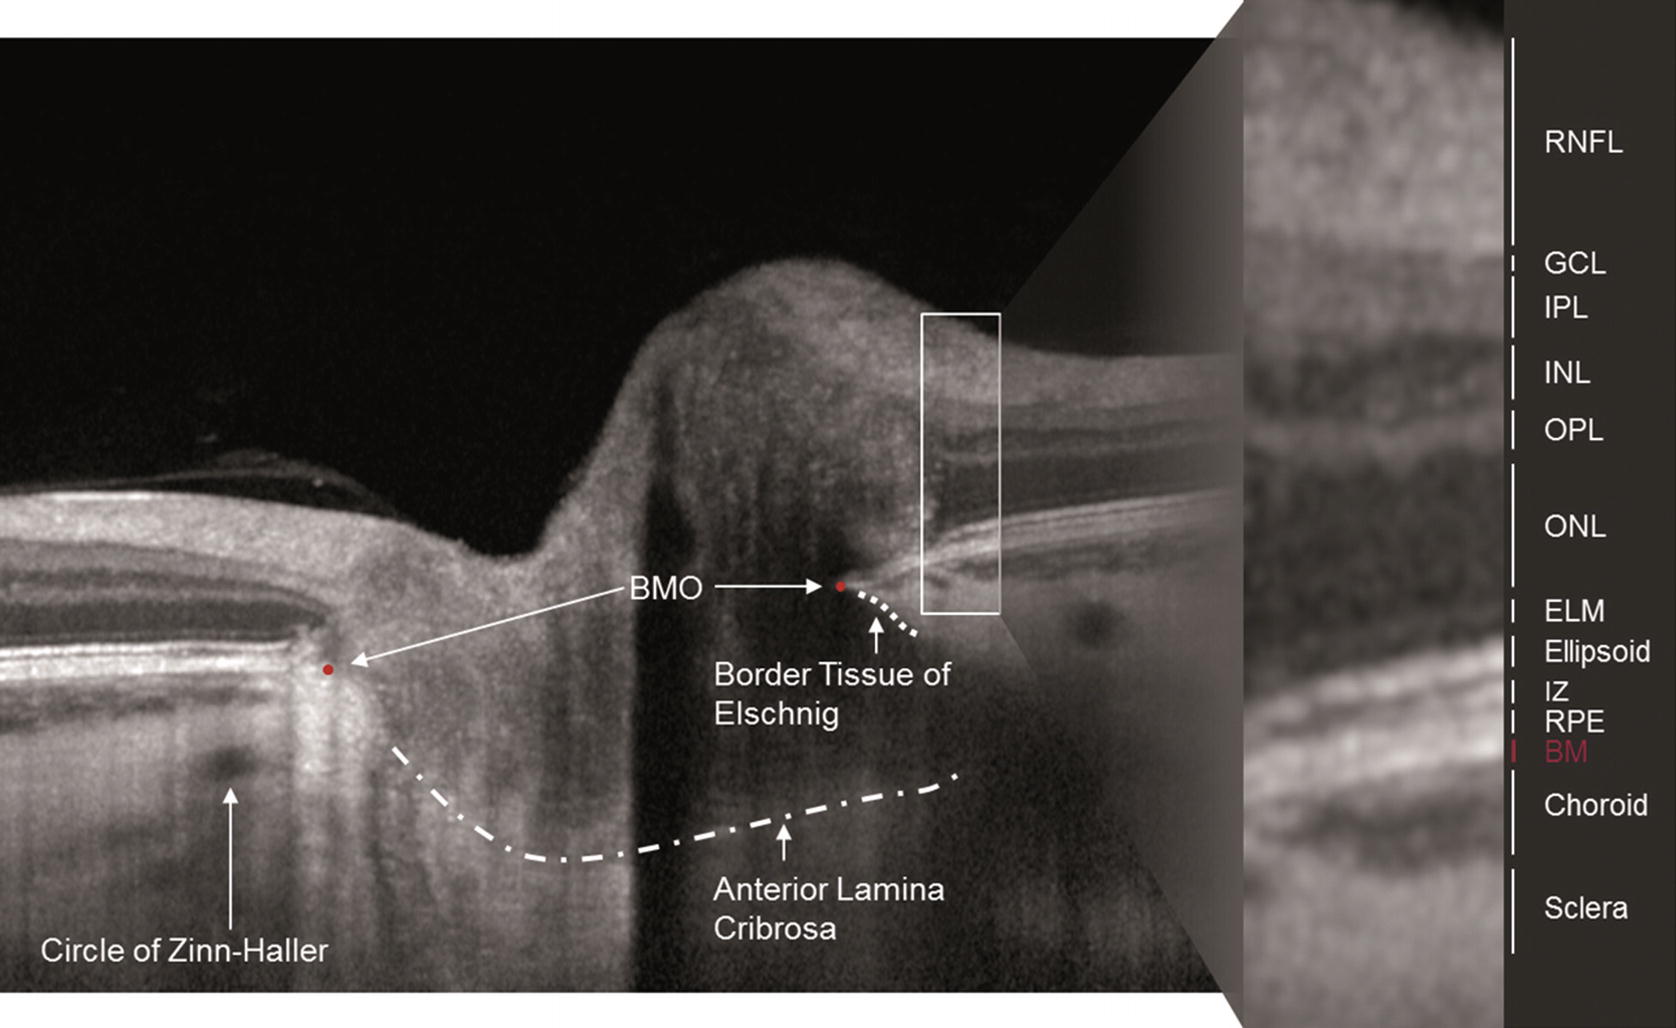
The BMO represents a stable structure through which all axons exit the eye. Because blood vessels and axons cannot pass through Bruch’s membrane, it is considered an appropriate anatomical boundary of the optic disc
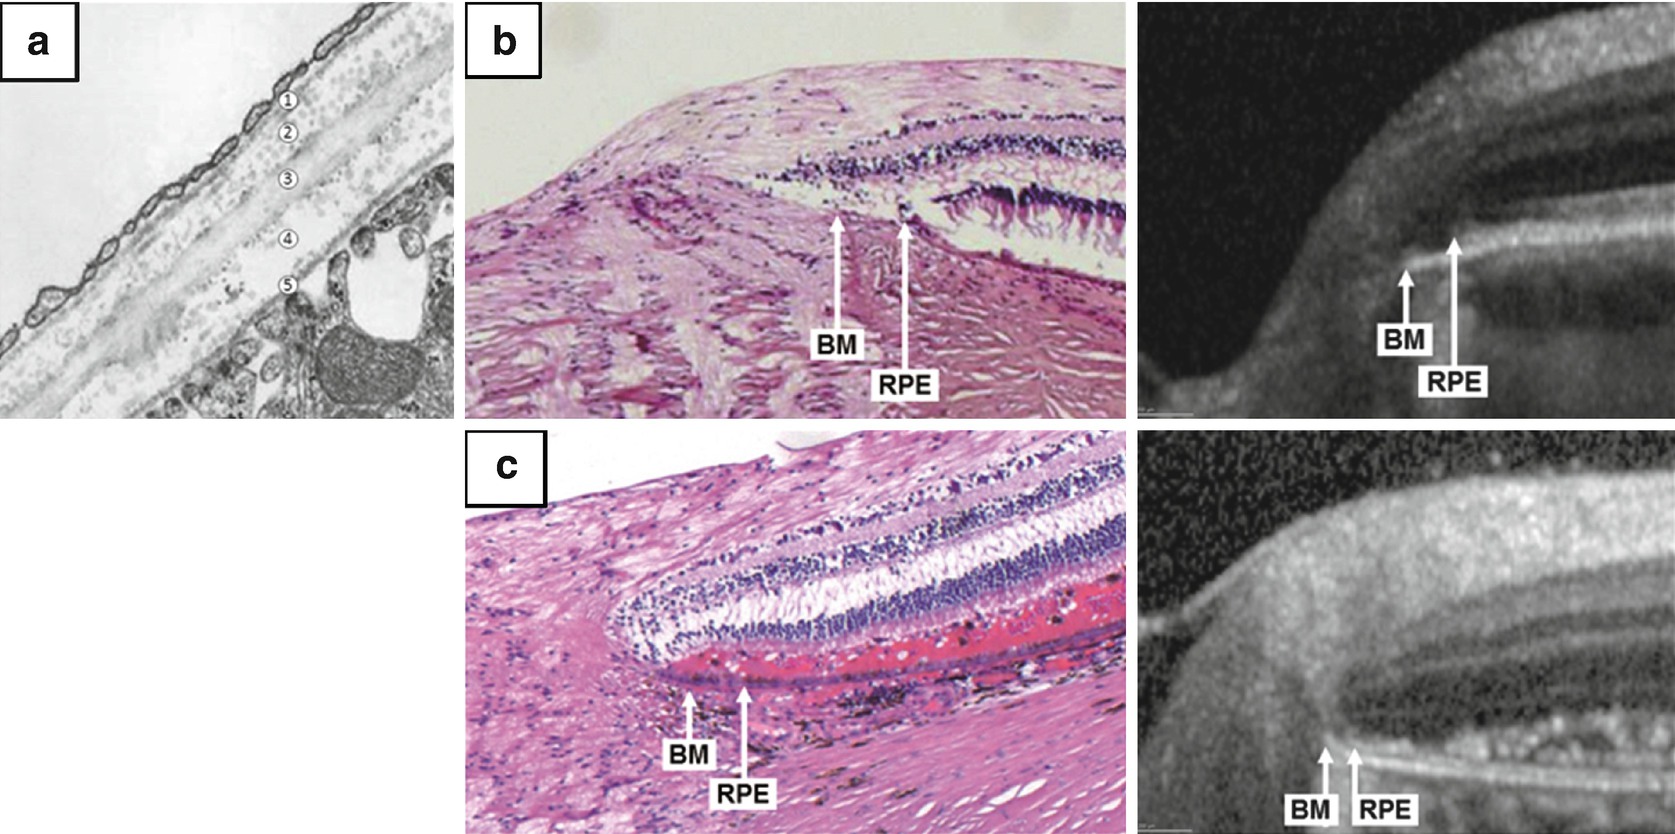
(a) Electron microscopy of Bruch’s membrane shows the basal membrane of the choriocapillaris, collagen layers, elastic layer, and basal membrane of the RPE. Panels (b) and (c) show ONH histology of Bruch’s membrane , along with its corresponding appearance on SD-OCT. Images courtesy Christian Mardin, MD
The orientation of the neuroretinal rim relative to the BMO varies around the ONH because axons can exit the eye along varying paths, ranging from parallel to the visual axis to perpendicular to it [73]. In order to correctly account for these variations, studies have demonstrated that the minimum distance from BMO to the internal limiting membrane represents the most geometrically accurate measurement of neuroretinal rim width [66–68]. This neuroretinal rim measurement has been termed Bruch’s Membrane Opening—Minimum Rim Width (BMO-MRW) . Studies have demonstrated the usefulness of BMO-MRW in the detection of progressive ONH change in experimental animal models of glaucoma and in human eyes [69, 74]. The BMO-MRW is diagnostically specific and sensitive for detecting glaucoma, and it enhances the clinical assessment of the optic disc [75]. The BMO-MRW parameter provides better diagnostic performance than the original gold-standard HRT analyses [76]. Ultimately, the BMO-MRW and RNFLT measurements have been shown to complement each other in the assessment and monitoring of glaucoma [77].

The ONH-RC scan pattern produces 24 line scans and 48 BMO endpoints, shown in (a). The three concentric circumpapillary scans have a diameter of 3.5 mm (b), 4.1 mm (c), and 4.7 mm (d). The three scans often offer complementary information and can confirm the presence of focal RNFL wedge defects that broaden away from the ONH (white arrows). Images courtesy Maria Pilar Bambó, MD, PhD
5.3.3 Anatomic Variation: Position of the Fovea Relative to the Center of the ONH
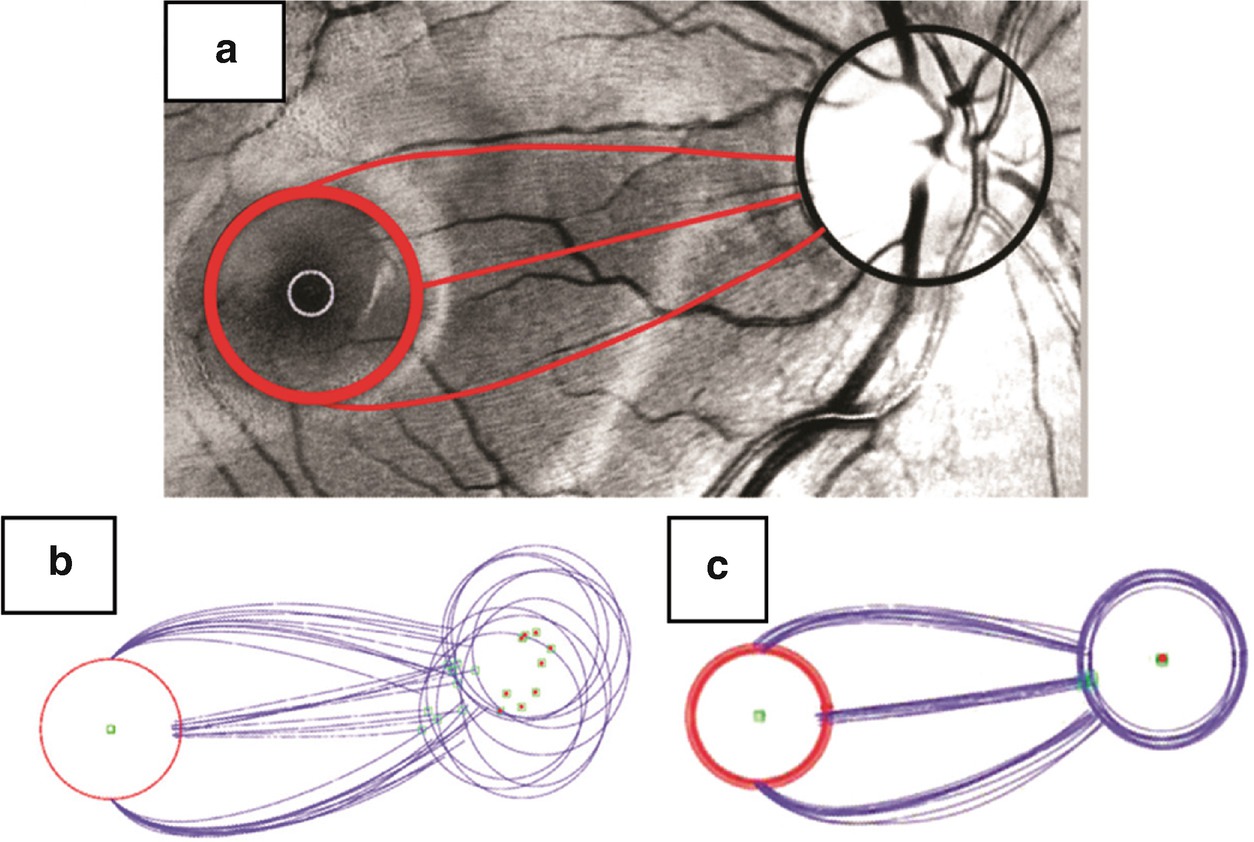
Even as the angle of the fovea to the center of the ONH changes due to cyclotorsion or anatomical differences, the arcuate path of the RNFL bundles remains constant to this axis. This can be seen from the tracing of the RNFL fibers from the nerve to the fovea in (a). For 11 different eyes, the optic nerve position varies relative to the fovea as shown in (b), but alignment of the images in (c) illustrates the consistent path of the RNFL bundles. Figure 15 of [81], reprinted with permission
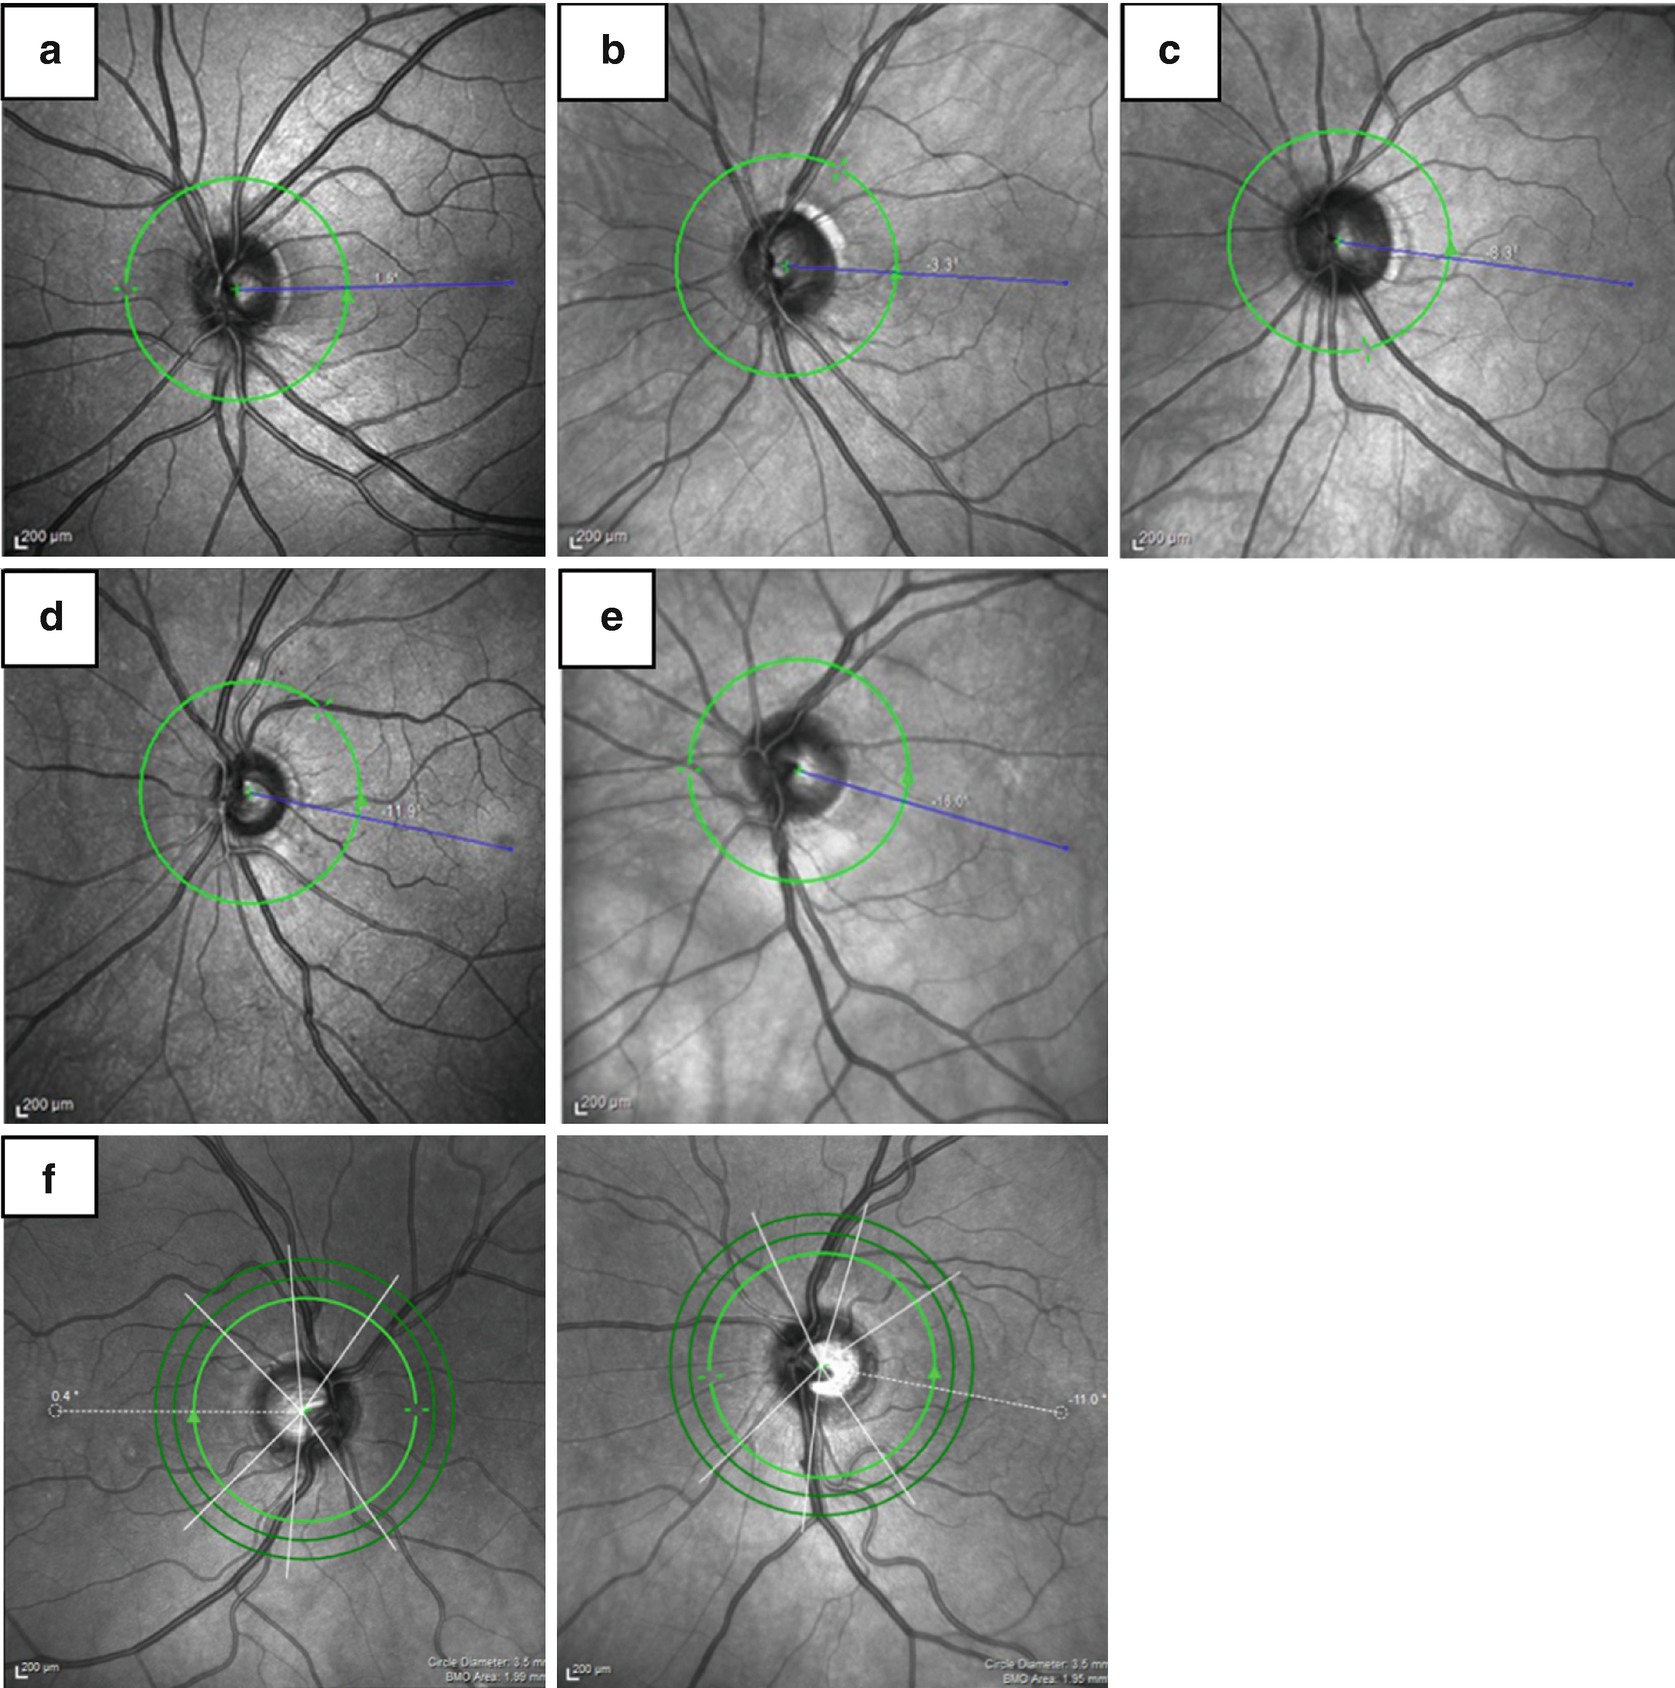
The range of angles for the fovea to center of ONH axis is large across a population. In these five examples, the fovea is +1.5° in (a), −3.3° in (b), −8.3° in (c), −11.9° in (d), and −16.0° in (e). Variability can also occur between the two eyes of a single patient, as seen in (f) with an angle of +0.4° OD and −11.0° OS. The three white lines through the ONH in (f) represent the 6-sector Garway-Heath classification regions and are shifted according to the angle
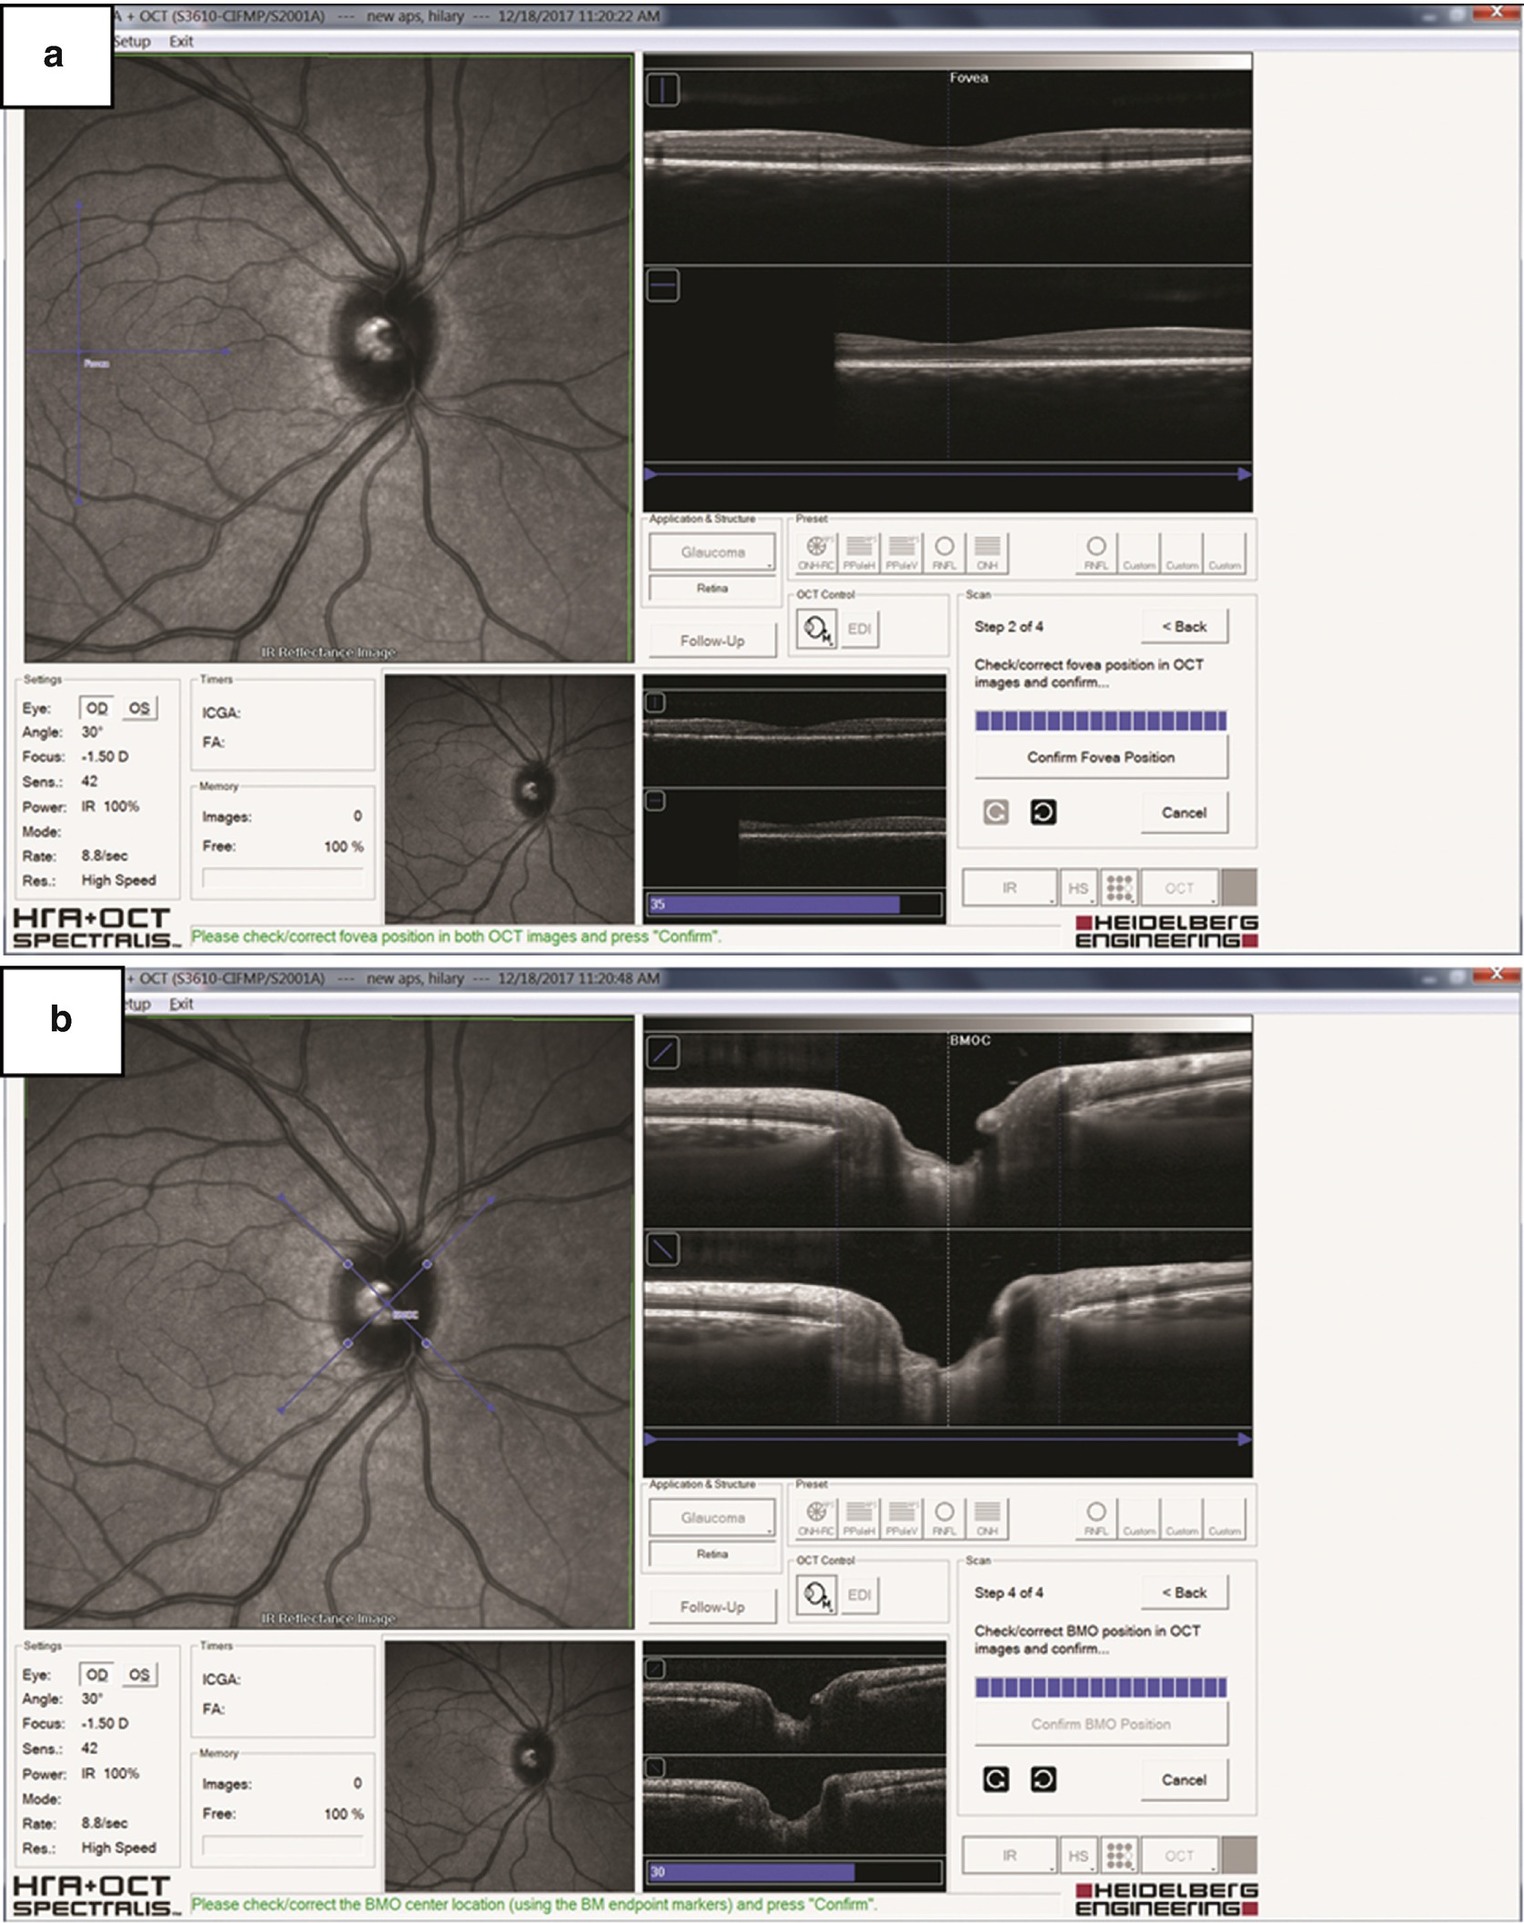
The operator confirms the automated detection of both the fovea (a) and the BMO (b) positioning within the acquisition window. These anatomic positioning system (APS) landmarks serve as the placement points for the ONH-RC scan
While the APS landmarks serve as the basis for accurate baseline measures of each individual eye, the previously mentioned TruTrack eye-tracking feature accounts for changes in head position and ensures precise placement of follow up scans, both important for maintaining accurate comparison to the reference database and when assessing progression [85].
5.3.4 Anatomic Variation: ONH size and Ocular Magnification Impact RNFL Measurements
In 1996, Schuman et al. reported that a circle diameter of 3.4 mm was the most accurate and reproducible scan size for RNFL thickness measurements [86]. Since then, most OCT instruments and studies have used circular scans with a diameter very close to 3.4 mm, independent of ONH size. However, it is now generally recognized that the optic disc size shows a high inter-individual variability, with areas ranging between 0.8 and 6.00 mm2 in normal eyes [87]. Histological studies have shown that RNFL thickness decreases with increasing distance from the optic disc margin [88]. Because of this, RNFL thickness is increased in larger optic discs when measured with a fixed scan size [89–91]. These studies indicate that using a fixed scan diameter without adjusting for ONH size introduces inconsistencies and reduces measurement accuracy. Scaling scan diameter according to the ONH margin may provide a more accurate diagnostic RNFL thickness measurement. For this reason, the SPECTRALIS GMPE results account for the size of the ONH (defined as BMO area) when comparing each eye’s RNFL thickness and BMO-MRW values with the respective reference database.
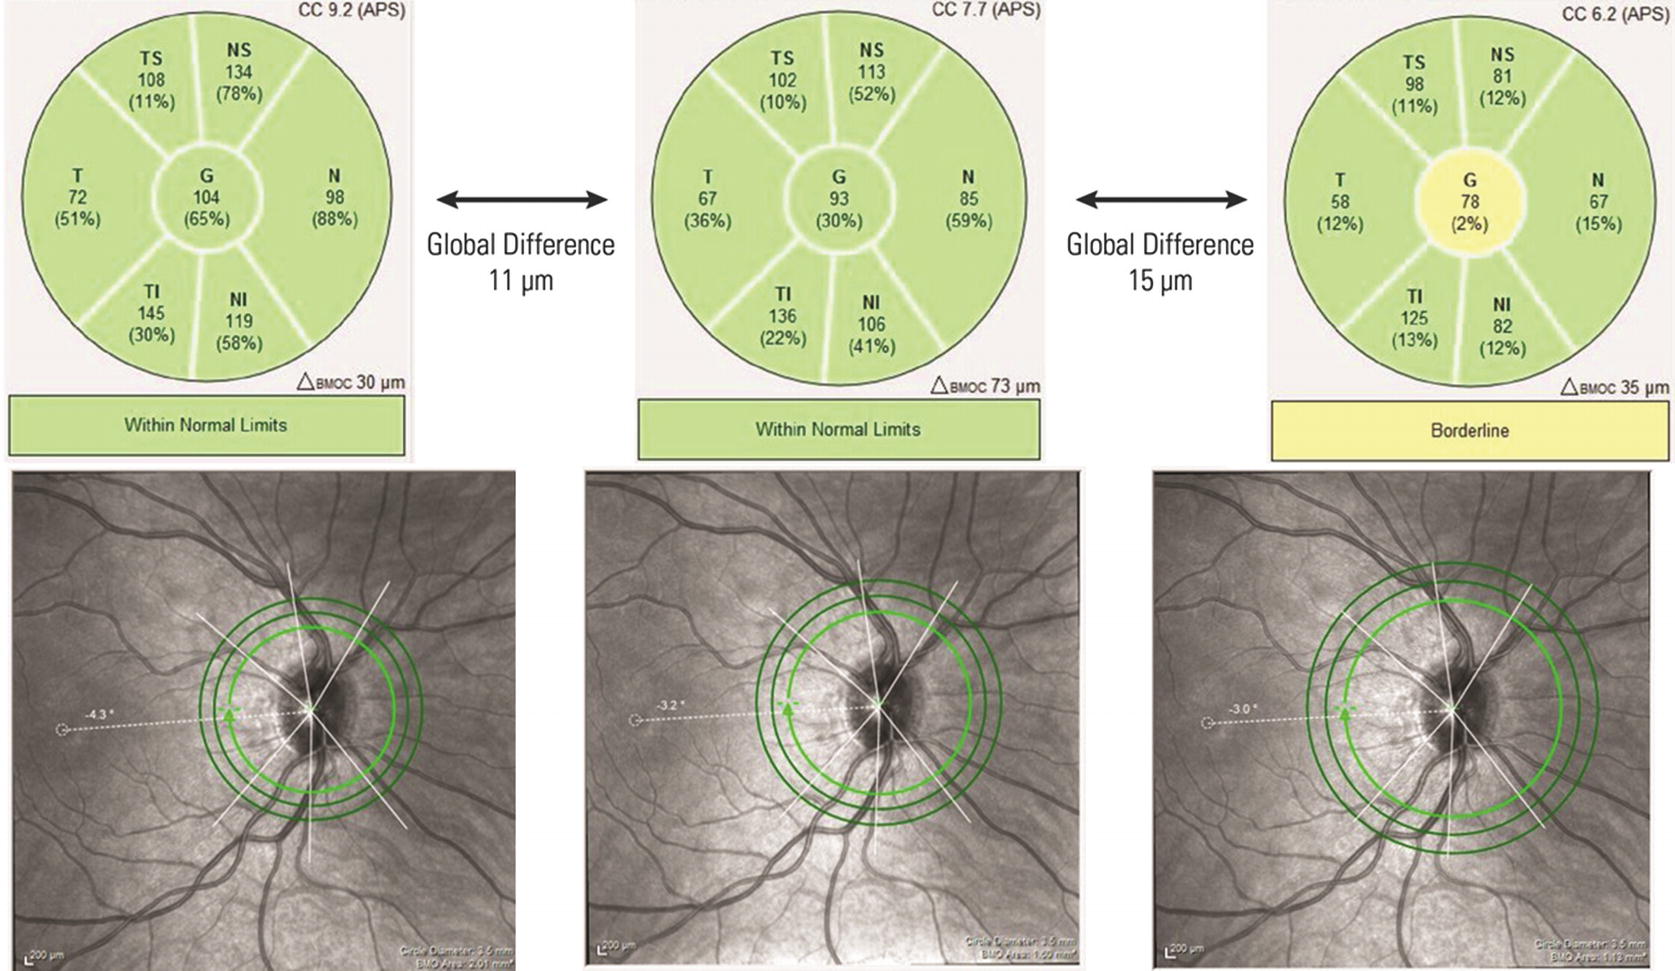
The operator can input the corneal curvature value for each eye so that the fixed-millimeter circle scans are correctly scaled relative to the fundus cSLO image and corresponding ONH size. This figure shows the range that the circle scans cover across the minimum and maximum corneal curvature values. This eye has a measured corneal curvature (CC) of 7.7 mm. Note that with a high CC value, the circle scans are closer to the disc margin than they should be. With lower CC values, the scans are farther from the disc margin than they should be. Because the RNFL is thinner with increasing distance from the disc margin, the sectorial and global results compared with the reference database are considerably different due to changes in scaling and magnification that are caused by the disparate corneal curvature values
5.3.5 Factors that May Confound Measurements and Classifications: Age, Axial length, and Tilted Discs
There is a negative association between RNFL thickness and age that may explain the higher rate of glaucoma detection in older individuals [97]. The GMPE reference database accounts for this known decline in RNFL thickness due to age . The values collected for the reference database also show a statistically significant negative correlation between age and BMO-MRW, and the software RBD comparisons take into consideration this relationship. The reference database also shows a negative correlation between BMO area and MRW (larger BMO area associated with thinner MRW) and a positive correlation between BMO area and circumpapillary RNFL thickness (larger BMO area associated with thicker cpRNFL measurements), so the reference database comparisons also are scaled by the BMO area.
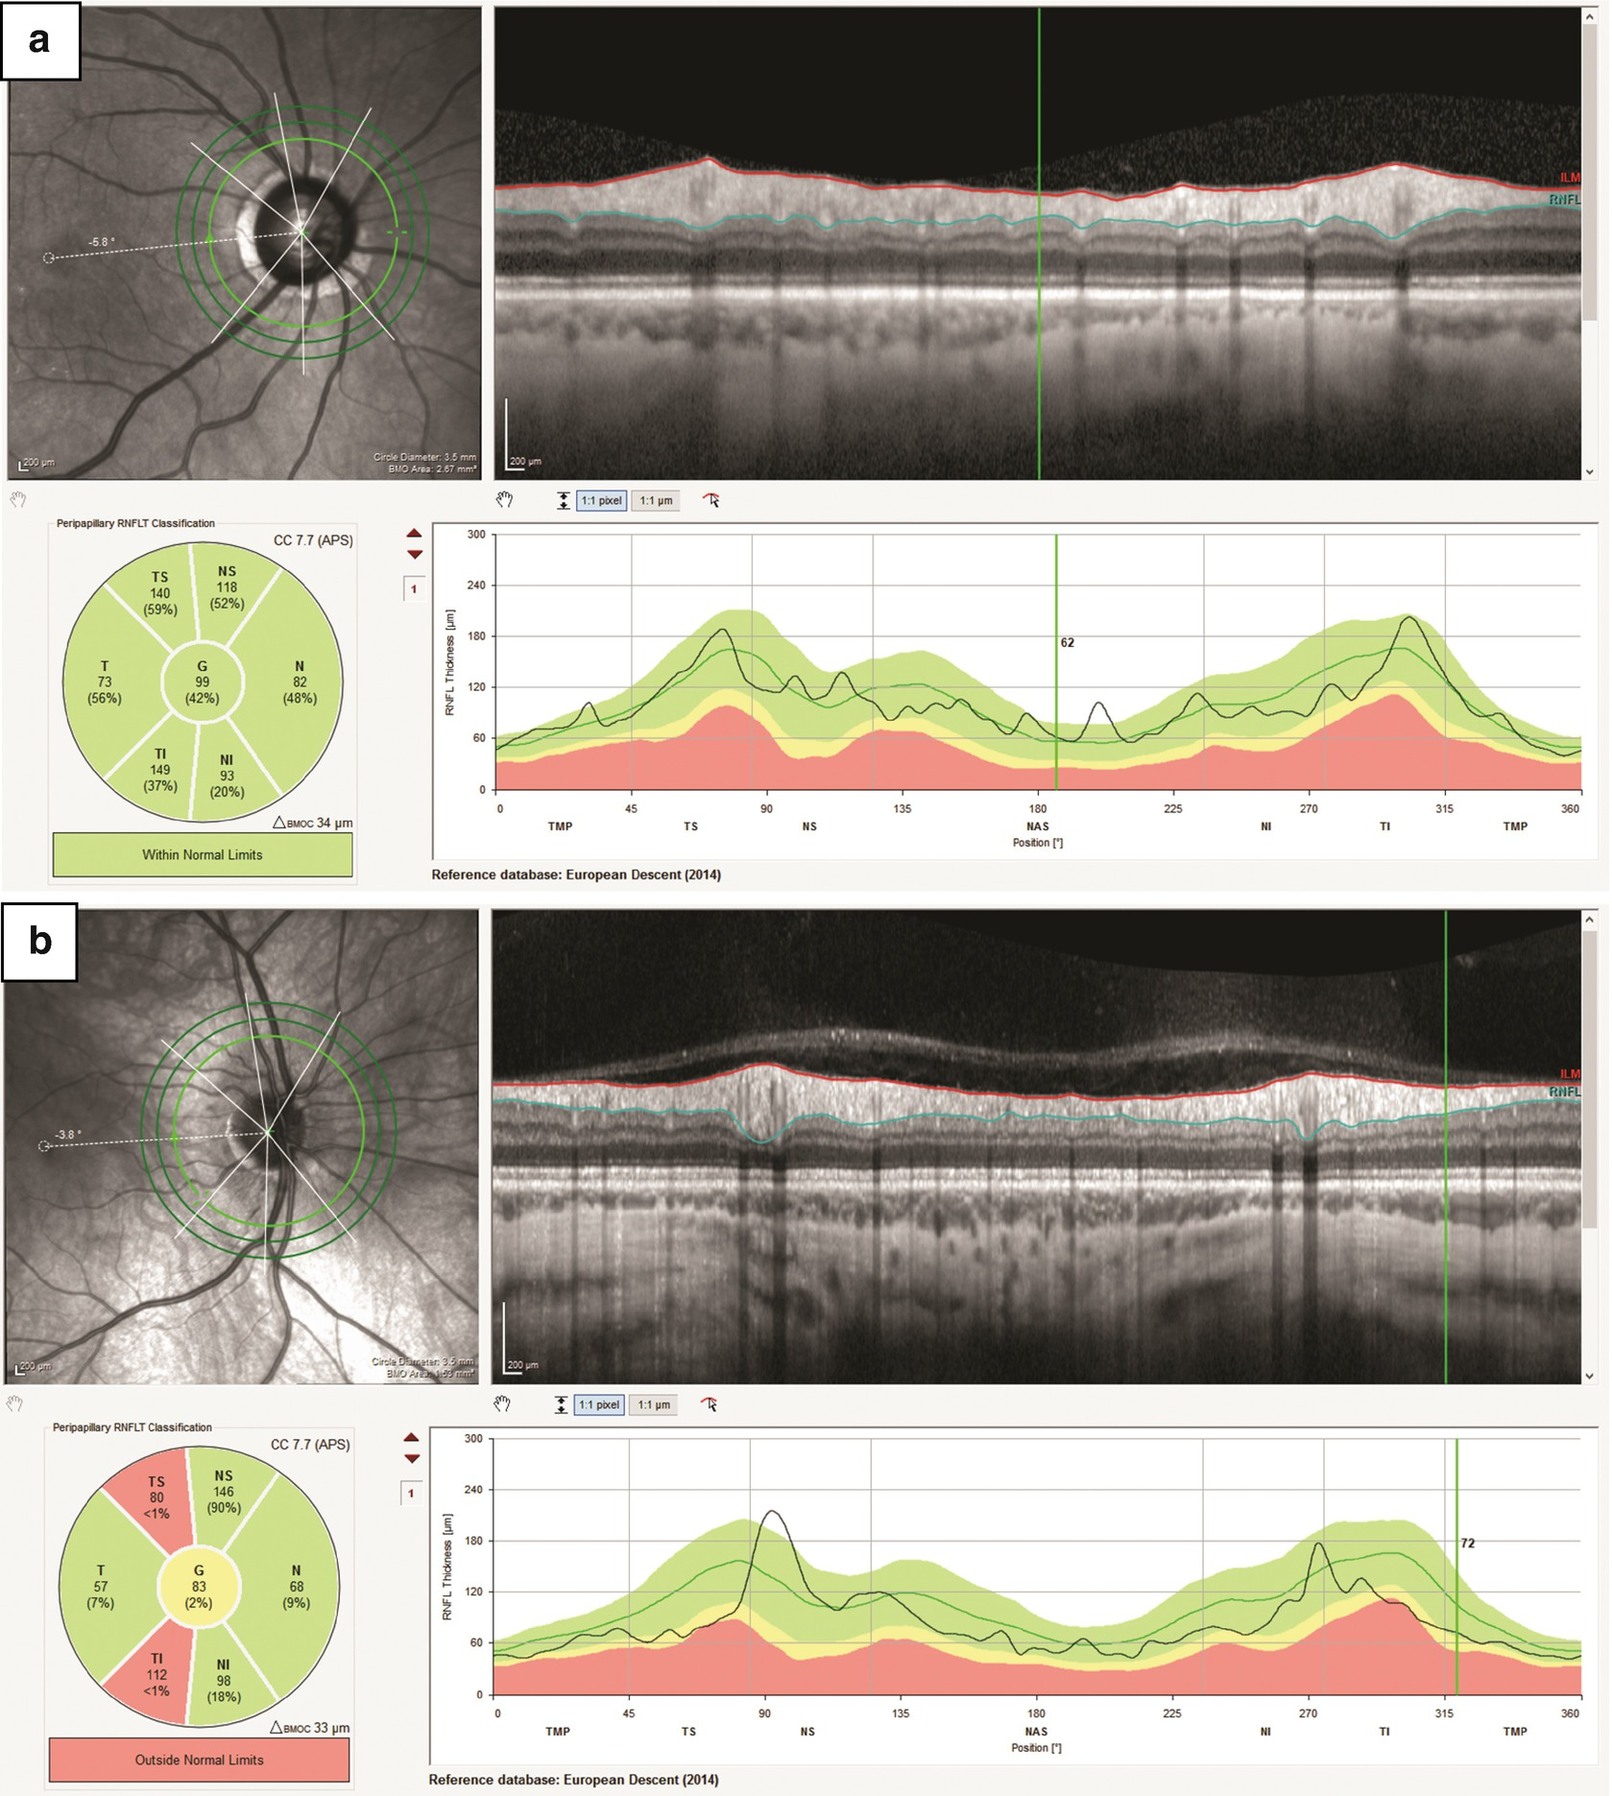
In cases of increased axial length, the RNFL thickness values in the superior and inferior regions may be shifted towards the nasal or temporal sectors. In (a), the normal TSNIT profile has peaks that correspond to the age and BMO-adjusted reference database mean (green shading, solid green line). In a case of myopia (b), the increased axial length causes a shift of the superior and inferior RNFL thickness peaks. This causes the 6-sector Garway-Heath analysis to flag the sectors “Outside Normal Limits,” but visual inspection of the SD-OCT B-Scans shows a normal, healthy RNFL. Images courtesy Daniel Fuller, OD, Michael Gerstner, OD, and Christopher Lievens, OD, MS
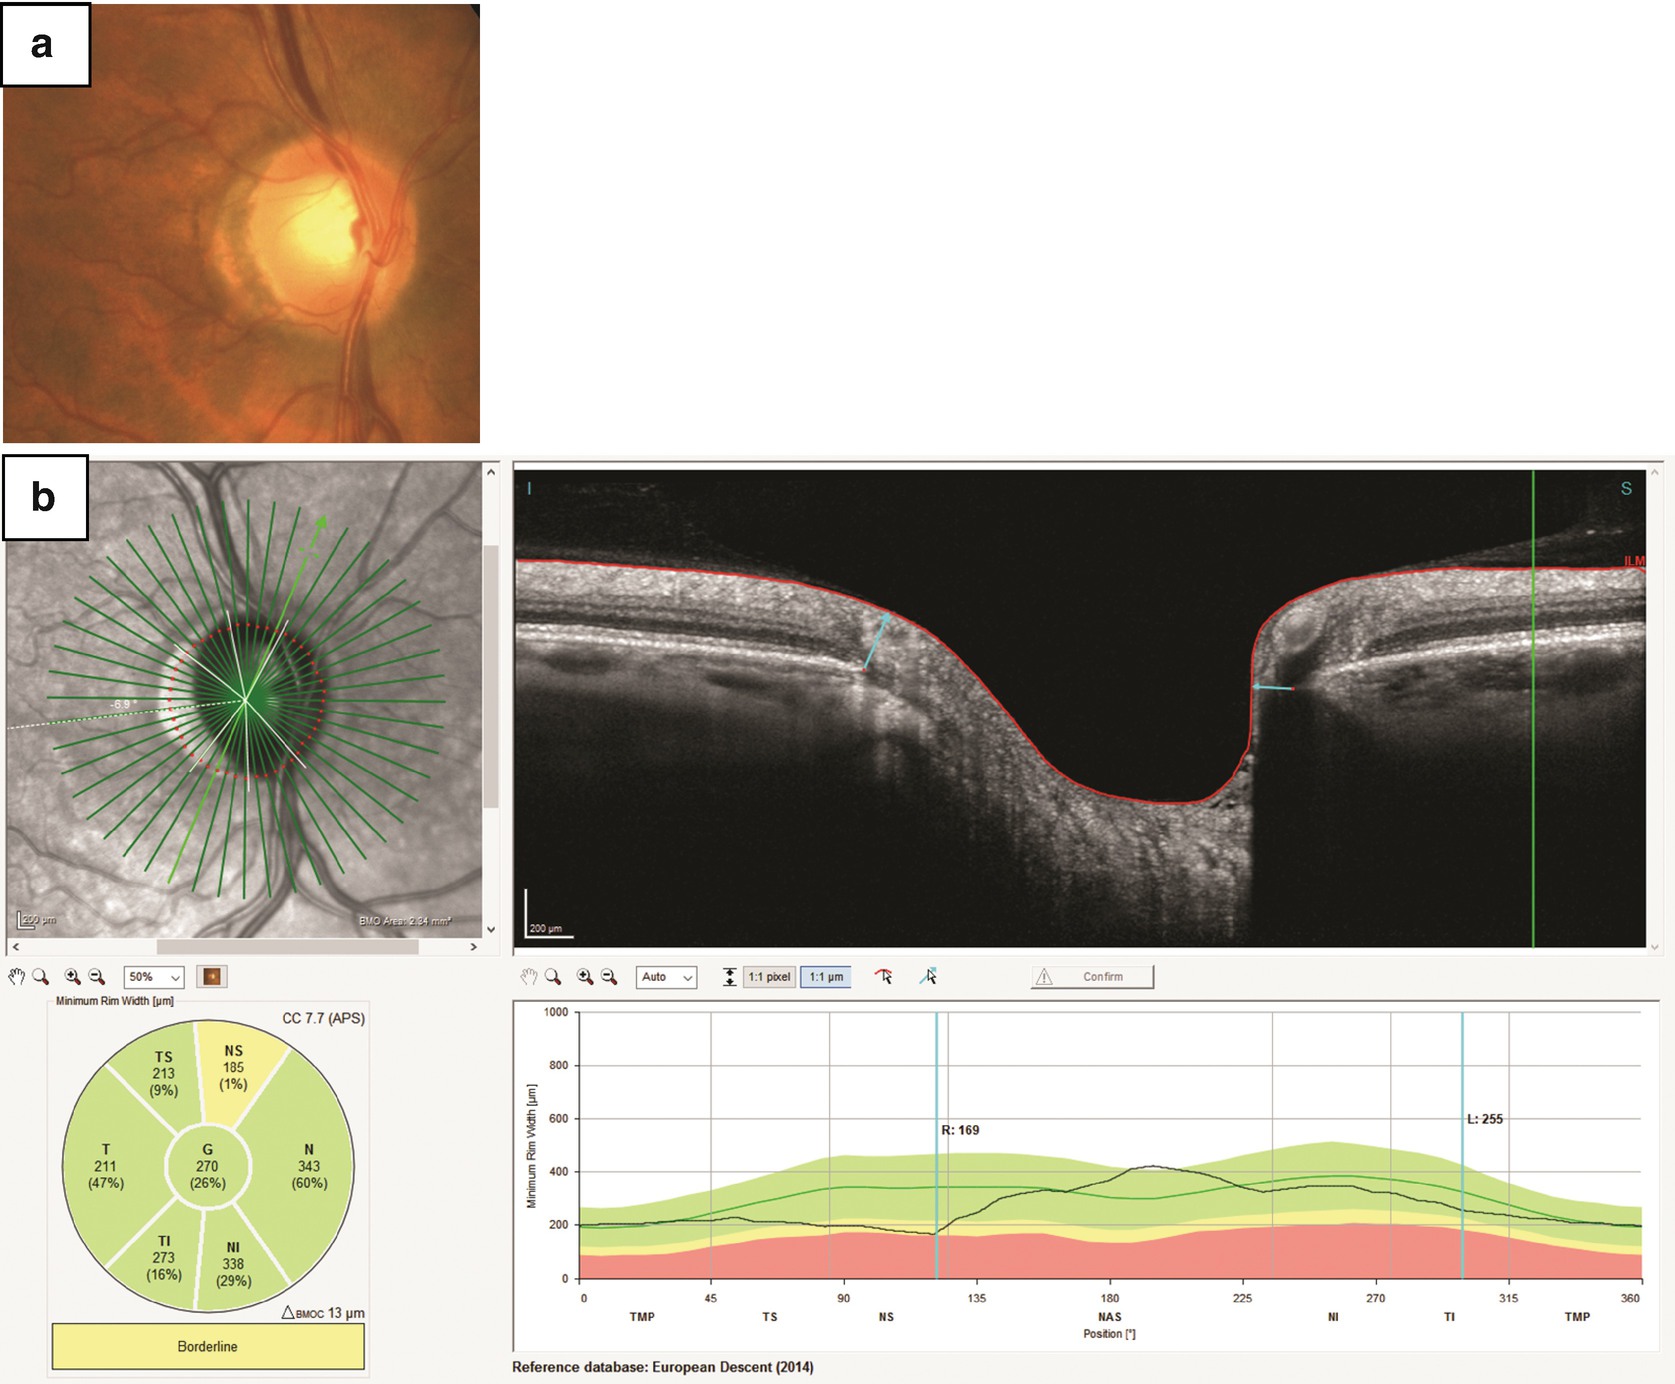
A titled disc can be seen on the fundus photograph (a), and the corresponding BMO endpoints can be identified on the radial scans through the ONH (b). Similar to cases of increased axial length, there can be shifts in the TSNIT profile of BMO-MRW that cause false-positive comparisons to the reference database. Visual inspection of the SD-OCT B-Scans reveals a healthy neuroretinal rim. Images courtesy Mohammad Rafieetary, OD
5.3.6 Posterior Pole: Macular and Asymmetry Analyses
The density of RGCs is highest in the macula, and the ganglion cell layer (GCL) measured by SD-OCT is thickest surrounding the fovea. Loss of these cell bodies has been shown to be indicative of early glaucomatous damage [105]. Studies have also shown that glaucomatous damage results in characteristic patterns of ganglion cell degeneration in the macula. These patterns of loss present as arcuate patterns that correspond to the arcuate RNFL patterns of loss, confirming that the ganglion cell somas and their respective axons are degenerating. Such observations have led to the concept of “macular vulnerability zones” in the temporal inferior and temporal superior sectors [81]. Therefore, when reviewing OCT diagnostic results, it is important to assess anatomically corresponding ONH, RNFL and macula data in order to detect patterns common to glaucomatous damage.
The superior and inferior GCL are symmetric across the fovea in healthy eyes, and assessment of vertical GCL asymmetry across the fovea may be a sensitive method for detection of early glaucomatous damage [106]. Early damage also may be present asymmetrically between eyes [107, 108]. Macular analysis may be especially important for patients classified as “Glaucoma Suspects” by ophthalmic exam, and a study found that glaucoma suspects with macular thinning were more likely to subsequently present with visual field loss [109].

The 61-line posterior pole horizontal scan produces a total retinal thickness color map (lower left). The 8 × 8 grid of thickness values serves as the basis for the Posterior Pole Asymmetry Analysis (PPAA) in the lower right panel. The difference in thickness for each corresponding square across the horizontal meridian is shown, with darker values indicating a larger asymmetric difference in thickness. This analysis can be used to visualize and quantify areas of retinal thickness loss that are characteristic of glaucoma. Images courtesy Shinji Ohkubo, MD, PhD, and Kazuhisa Sugiyama, MD, PhD
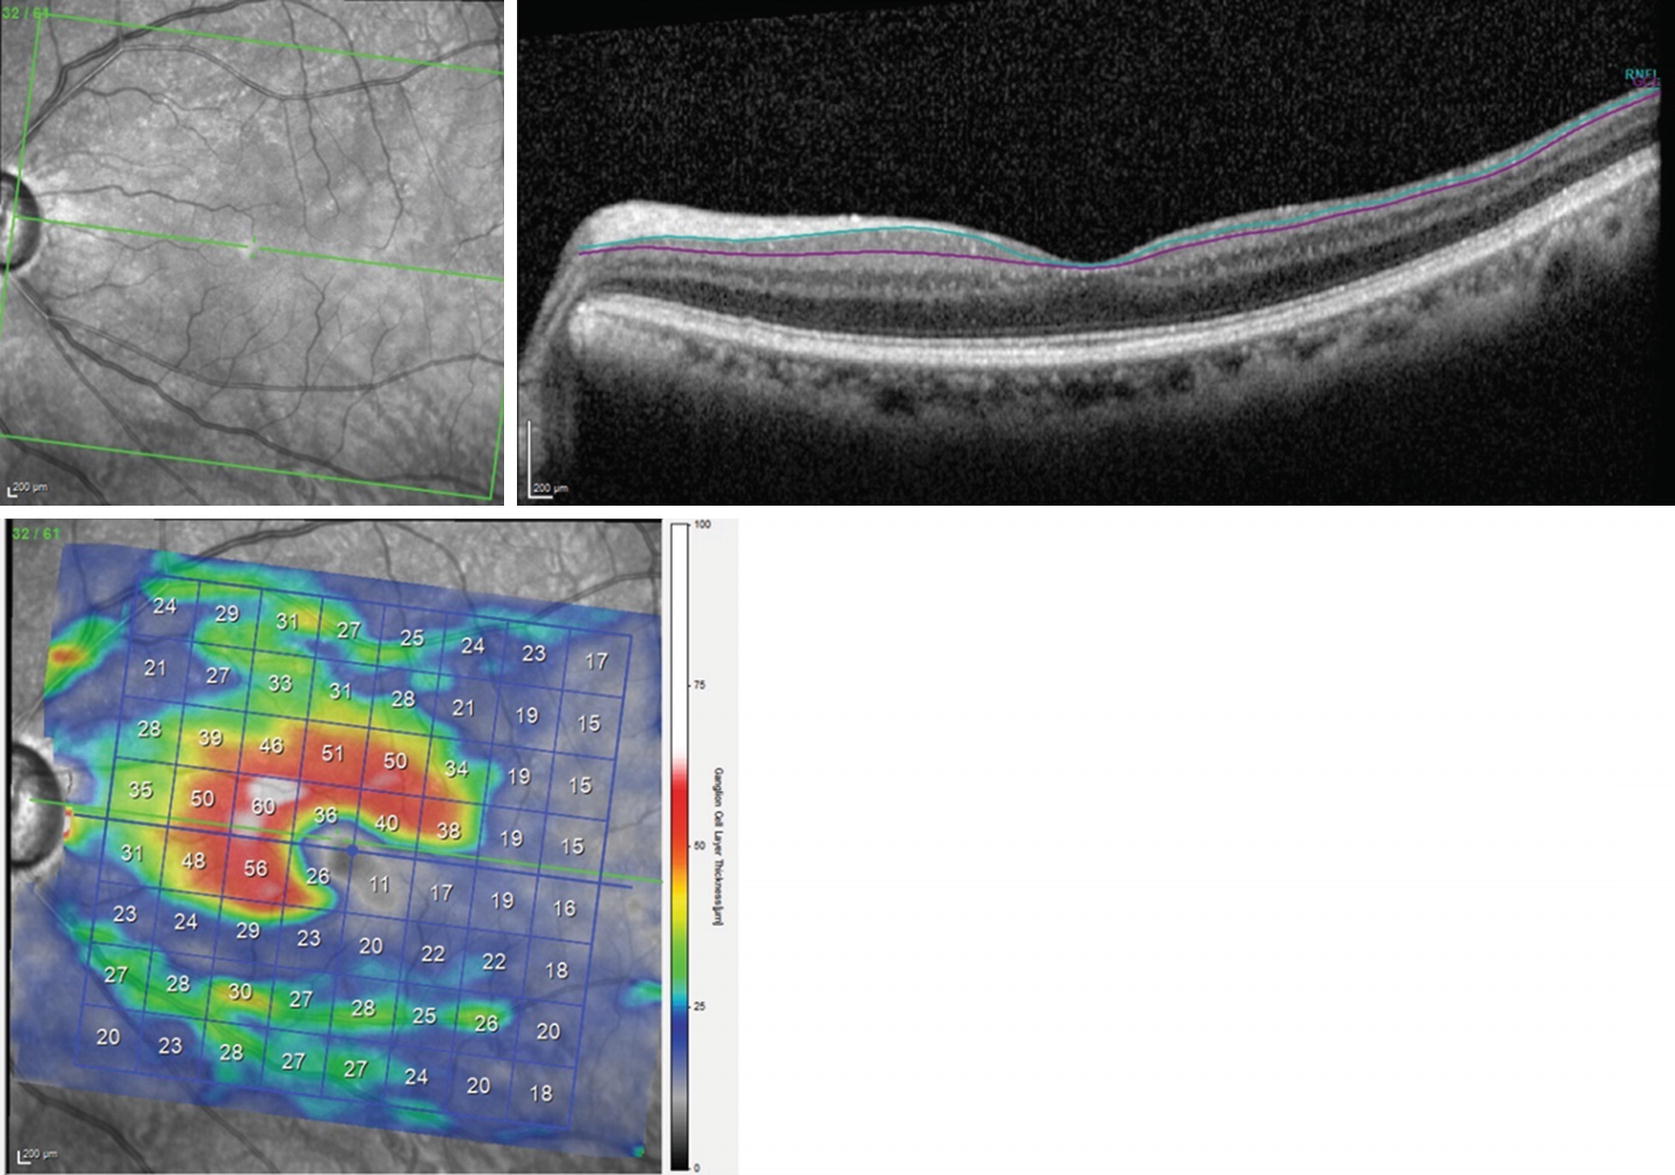
Segmentation of the PPoleH scans between the RNFL and the ganglion cell layer (GCL) provides a GCL thickness color map. In this eye, the same as in Fig. 5.13, there is clear GCL loss in the inferior temporal region
5.3.7 Detection of Glaucomatous Progression with OCT
Considering that most forms of glaucoma are slowly progressing optic neuropathies characterized by the loss of RGCs and their axons, the detection of glaucomatous progression is a critical aspect of disease management. The identification of structural glaucomatous changes, such as progressive thinning of the RNFL and narrowing of the neuroretinal rim , assists clinicians in confirming the initial diagnosis. More importantly, detecting these changes over time provides clinicians with the information they need to make decisions about further treatment to prevent additional glaucomatous visual impairment.
In order to accurately assess progression, test measurements need to have adequate reproducibility [111, 112]. If test measurements have poor reproducibility or are contaminated by noise, detection of true structural loss is not possible. Pierro et al. evaluated retinal nerve fiber layer thickness (RNFLT) measurements using seven different OCTs (spectral- and time-domain), to assess inter- and intra-operator reproducibility of RNFLT [113]. They determined that the SPECTRALIS SD-OCT showed the best reproducibility among the tested devices. The SPECTRALIS eye tracking and ART image acquisition help provide high-quality OCT B-Scans, which in turn allow for reproducible segmentation of the RNFL. In a separate study of clinically relevant reproducibility, Wessel et al. used the SPECTRALIS SD-OCT to measure circumpapillary RNFLT (cpRNFLT) in healthy controls and glaucoma patients over 3 years [114]. Glaucoma subjects were classified as progressing or non-progressing by masked grading of stereoscopic optic disc photographs, and the study showed that the SPECTRALIS measured a cpRNFLT loss of 0.6 μm/year in healthy eyes, a loss of 1.2 μm/year in non-progressing eyes, and a loss of 2.1 μm/year in progressing subjects. Miki et al. showed that the rate of global RNFL loss was more than twice as fast in eyes that developed visual field defects compared with eyes that did not develop a defect [16]. These findings indicate that SD-OCT imaging can be used to detect glaucomatous changes beyond losses from normal aging and beyond the possible noise in repeated measurements.
The ability of a device to measure change over long periods of time also depends on its dynamic range (i.e. the maximum and minimum RNFL thickness measurements that can be reliably made). The lower end of the dynamic range is the “floor” of the measurement, or the minimum layer thickness that is reliably measureable. It is important for an SD-OCT device to have a large dynamic range and a low “floor” value in order to be able to monitor disease progression over time, particularly in advanced glaucoma. The global cpRNFLT dynamic range of the SPECTRALIS has been shown to be larger than comparable devices, while also offering a lower floor [115]. Nevertheless, monitoring advanced glaucoma using standard structural and functional testing is extremely difficult for the treating clinician because both standard structural and functional tests that usually guide treatment decisions are of diminished value. Standard structural measures have a limited dynamic range and visual field (VF) test points are more variable in advanced disease [81, 115–120]. However, Belghith et al. have shown that even in very advanced glaucoma, structural loss can be detected in some eyes using standard global structural measures with macular GCIPL identifying the highest proportion of eyes with detectable change, followed by MRW and cpRNFL [121]. In a subsequent study, Bowd et al. concluded that in advanced glaucoma, more macular tissue remains above the measurement floor compared with other measurements, suggesting that macular thickness is the better candidate for detecting progression of such eyes and that progression with SD-OCT measurements is observable in advanced disease [122–125].
5.3.8 Summary
Because every eye is unique, it is also important for imaging technologies to incorporate analysis tools that allow for the detection of change in a specific eye over time. The SPECTRALIS SD-OCT provides follow-up scans that are co-registered to baseline imaging, which improves repeatability and makes measurement more precise. The combination of high reproducibility, large dynamic range, a low measurement floor and multiple diagnostic parameters such as the BMO-MRW, cpRNFL and macular thickness measurements allows the device to offer a precise and clinically sensitive progression analysis for all stages of the disease.
Several studies have investigated the diagnostic performance of various SD-OCT parameters in a standard ophthalmic environment, and the literature suggests that circumpapillary RNFL thickness, ONH, and macular parameters are specific and sensitive for the detection of glaucoma [107, 126–128]. The SPECTRALIS GMPE software offers multiple measurements of ocular structures that, taken together, can offer confirmatory information and increase confidence in the diagnosis. It has been shown that multiple parameters, when used effectively and with caution, are better than any single parameter for diagnosis and management of glaucoma [129]. More importantly, there is clear utility in looking beyond reports at the individual OCT scans, as these can help clarify and reconcile outlying and aberrant outputs.
5.4 Summary and Outlook
The development and clinical implementation of cSLO technology (Heidelberg Retina Tomograph) was one of the first imaging technologies in ophthalmology that introduced the ability to objectively quantify various diagnostic parameters for the assessment and management of glaucoma. The technology’s diagnostic parameters offered clinicians an objective and precise method to aid their decision in the diagnosis and management of the disease. While the clinical implementation of the HRT served to improve patient care, several clinical research studies employed SLO technology to derive potential surrogate endpoints in clinical trials.
SD-OCT is a more recent technology which also provides objective and quantitative methods to assess the optic nerve head as well as the retinal nerve fiber layer and macula. A current version of this technology, the SPECTRALIS SD-OCT with OCT2 Module, provides a new level of high-resolution imaging of ONH anatomic features that are affected in glaucoma. This device provides clinicians with the ability to visualize optic nerve structures such as the anterior and in some eyes posterior lamina cribrosa surfaces, Bruch’s membrane-retinal pigment epithelium complex and its termination within the ONH border, tissue of Elschnig, choroid, and the scleral canal opening.
The ability to visualize the relevant ocular structures in three dimensions in-vivo for the diagnosis and management of glaucoma and to carefully implement multiple objective parameters enables clinicians to make more confident diagnostic decisions. Structural assessment using the imaging technologies discussed in this chapter provides reproducible quantitative measurements of posterior segment ocular structures relevant to the disease.
A newer development in OCT technology, OCT Angiography (OCTA), has sparked interest in evaluating vascular alterations in the retina and ONH for diagnosis, staging, and monitoring in glaucoma. OCTA is an extension of OCT which allows non-invasive visualization of the retinal vasculature by detecting signal changes induced within perfused blood vessels without the use of exogenous dye. In principle, OCTA compares sequential B-Scans acquired at the same location to detect change. As stationary structures would appear static in sequential B-Scans, changes detected by OCTA are largely attributed to erythrocyte movement in the perfused vasculatures.
Because OCTA offers the non-invasive assessment of microvasculature in the peripapillary retina and macula, it is being investigated for its potential to assess ocular hemodynamics in various diseases [130]. Several OCTA studies have shown reduced microcirculation in the peripapillary retina and the superficial macula of open-angle glaucoma eyes, with a moderate relationship between microvasculature and function [131–133].
An early OCTA study suggested that the OCTA vessel density parameter may identify glaucomatous damage before focal visual field defects are detectable [132]. Another study showed that macular vessel density results correlate with central 10-2 visual field defects [133]. The same group also concluded that macular and peripapillary vascular density measurements detected changes in retinal microvasculature before visual field damage in the unaffected eyes of glaucoma patients presenting with unilateral glaucoma [134]. Moghimi et al. showed that lower baseline OCTA parameters were associated with a faster rate of RNFL progression in mild to moderate glaucoma over a mean follow-up of 27 months, suggesting that decreased vessel density may be a risk indicator for progression [135].
It remains controversial whether OCTA measurements have a higher diagnostic performance for glaucoma detection compared to conventional OCT measurements such as RNFL thickness, neuroretinal rim width, and macular ganglion cell and inner plexiform layer thickness. Chen and colleagues demonstrated that OCTA-measured vessel density and circumpapillary RNFL thickness measurements had comparable diagnostic performance for the detection of glaucoma suspect and glaucoma eyes [136]. Another recent study compared the diagnostic performance for glaucoma detection between OCTA vessel density measurements (defined using a non-commercially available method) and structural OCT RNFL thickness measurements. Results indicated that vessel area density measurements had a significantly smaller area under the receiver operating characteristic curve for classifying healthy versus glaucoma eyes than RNFL thickness measurements [137], in disagreement with several similar studies. However, classification performance of healthy and glaucoma suspect eyes were similar for vessel area density and RNFL thickness measurements. There is also evidence that deep-layer microvasculature dropout of the parapapillary choriocapillaris or microvasculature within the sclera occurs in eyes with glaucoma and is associated with more severe visual field damage and occurs more frequently in eyes with disc hemorrhages and RNFL thinning [63, 138–140].
While findings from the literature comparing OCTA and structural OCT measurements for the detection of glaucoma and evaluation of structure-function association are divergent, the potential ability to elucidate the temporal sequence of vascular changes and optic nerve damage in glaucoma may pave the way for better understating and management of the disease.
During the past three decades, advancements in ophthalmic diagnostic imaging technologies have enabled the ability to detect glaucomatous neuropathy at early stages of disease. These advanced imaging technologies provide large amounts of reproducible data, allowing clinicians to discriminate between normal and glaucomatous optic nerves in a more systematic way. From the earlier stages of cSLO imaging to the more recent implementations of OCT technology, several decades of technical and clinical work have been united and integrated in a high-technology solution to give physicians the ability to look deep in the pathological process of glaucoma and to develop better diagnostics and therapeutic strategies. The development of ophthalmic diagnostic imaging technology and the continued efforts to enhance it continues to benefit patients that suffer from glaucoma.
Acknowledgement
Supported in part by National Institutes of Health/National Eye Institute grants R01 EY029058 (RNW), R01 EY027510 (LZ), R01 EY011008, R01 EY014267, Core Grant P30EY022589, and by an unrestricted grant from Research to Prevent Blindness (New York, NY).

Open Access This chapter is licensed under the terms of the Creative Commons Attribution 4.0 International License (http://creativecommons.org/licenses/by/4.0/), which permits use, sharing, adaptation, distribution and reproduction in any medium or format, as long as you give appropriate credit to the original author(s) and the source, provide a link to the Creative Commons license and indicate if changes were made.
The images or other third party material in this chapter are included in the chapter's Creative Commons license, unless indicated otherwise in a credit line to the material. If material is not included in the chapter's Creative Commons license and your intended use is not permitted by statutory regulation or exceeds the permitted use, you will need to obtain permission directly from the copyright holder.