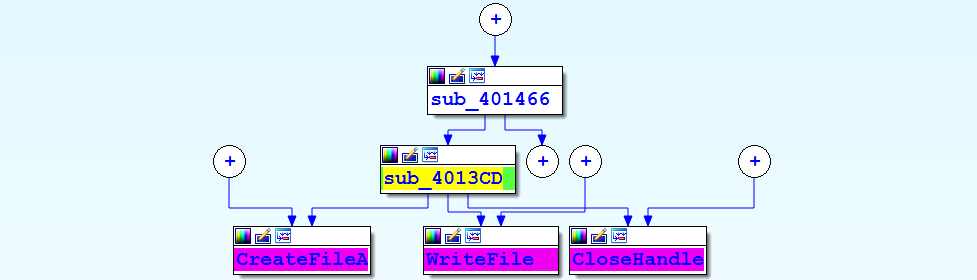
IDA's graphing options are a great way to visualize cross-references. Apart from the graph view shown previously, you can use the IDA's integrated graphing feature, called proximity view, to display the callgraph of a program. To view the callgraph of the function sub_4013CD from the previous example, while placing the cursor anywhere inside the function, click View | Open subviews | Proximity browser; this will change the view in the disassembly window to the proximity view, shown as follows. In proximity view, functions and data references are represented as nodes, and the cross-references between them are represented as edges (the lines that connect the nodes). The following graph displays Xrefs to and Xrefs from sub_4013CD. The parent of sub_4013CD (which is sub_401466) represents its calling function, and the functions called by sub_4013CD are represented as children. You can further drill down the parent/child relationship (Xrefs to and from) by double-clicking the plus icon or by right-clicking on the plus icon and selecting expand node. You can also right-click on the node and use the expand parents/children or collapse parents/children option to expand or collapse parents or children of a node. You can also zoom in and zoom out by using Ctrl + Wheel mouse button. To go back to the disassembly view from the proximity view, just right-click on the background and choose either Graph view or Text view:
Apart from the integrated graphing, IDA can also display graphs using third-party graphing applications. To use these graphing options, right-click on the Toolbar area and select Graphs, which will display five buttons in the toolbar area:
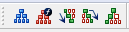
You can generate different types of graphs by clicking on any these buttons, but these graphs are not interactive (unlike the integrated graph-based disassembly view and proximity view). The following outlines the functionality of these buttons:
 |
It displays the external flow chart of the current function. This resembles IDA's interactive graph view mode of the disassembly window.
|
 |
It displays the call graph for the entire program; this can be used to get a quick overview of the hierarchy of the function calls within a program, but if the binary contains too many functions, the graph might be difficult to view, as it can get very large and cluttered.
|
 |
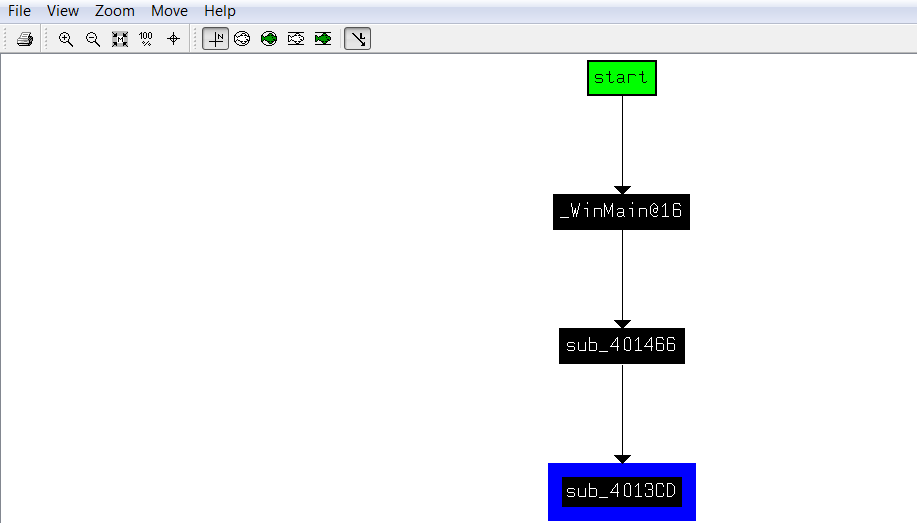
It displays the cross-reference to (Xrefs to) a function; this is useful if you want to see the various paths taken by a program to reach a specific function. The following screenshot shows the path taken to reach the sub_4013CD function:
 |
 |
It displays the cross-references from (Xrefs from) a function; this is useful in order to know all of the functions called by a particular function. The following diagram
will give you an idea of all of the functions that will be called by sub_4013CD:
 |
 |
This is the User Xref button, which allows you to generate custom cross-reference graphs.
|
With an understanding of how to leverage IDA's features to enhance your disassembly, let's move on to the next topic, where you will learn how malware uses the Windows API to interact with the system. You will learn how to get more information about an API function, and how to distinguish and interpret the Windows API from a 32-bit and 64-bit malware.