When you load a program in x64dbg, you will be presented with a debugger display, as follows. The debugger display contains multiple tabs; each tab displays different windows. Each window contains different information regarding the debugged binary:
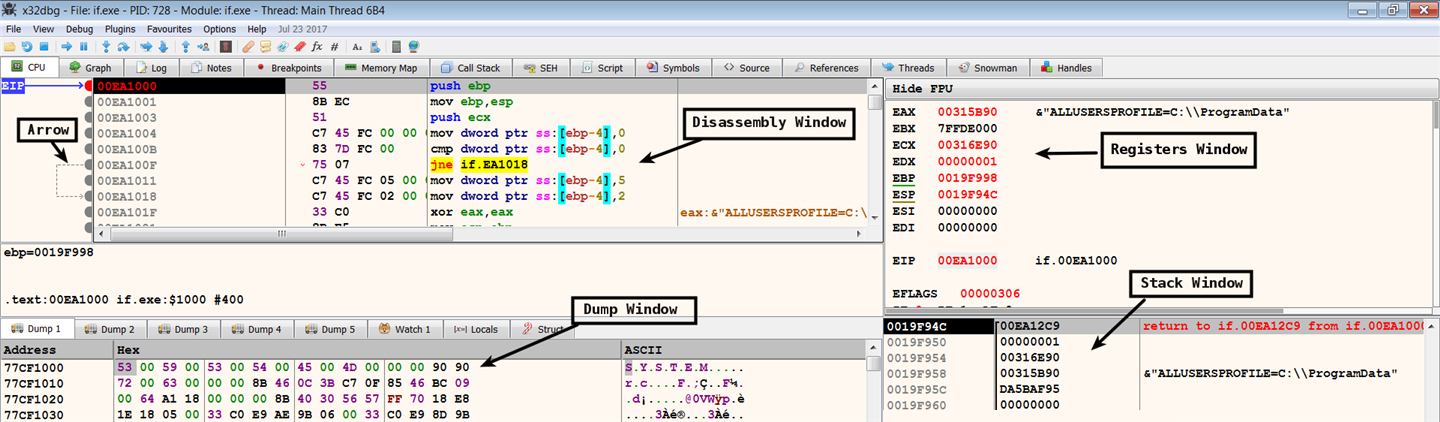
- Disassembly Window (CPU Window): This shows the disassembly of all of the instructions of the debugged program. This window presents the disassembly in a linear fashion, and it is synchronized with the current value of the instruction pointer register (eip or rip). The left portion of this window displays an arrow to indicate the program's non-linear flow (such as branching or looping). You can display the control flow graph by pressing the G hotkey. The control graph is shown as follows; conditional jumps use green and red arrows. The green arrow indicates that the jump will be taken if the condition is true, and the red arrow indicates that the jump will not be taken. The blue arrow is used for unconditional jumps, and a loop is indicated by the upward (backward) blue arrow:

- Registers Window: This window displays the current state of the CPU registers. The value in a register can be modified by double-clicking on the register and entering a new value (you can also right-click and modify the value of a register to zero or increment/decrement the value of the register). You can toggle the flag bits on or off by double-clicking on the values of the flag bits. You cannot change the value of the instruction pointer (eip or rip). As you are debugging the program, the register values can change; the debugger highlights register values with a red color, to indicate a change since the last instruction.
- Stack Window: The stack view displays the data contents of the process's runtime stack. During malware analysis, you will typically inspect the stack before calling a function, to determine the number of arguments passed to the function and the types of the function arguments (such as integer or character pointer).
- Dump Window: This displays the standard hex dump of the memory. You can use the dump window to examine the contents of any valid memory address in the debugged process. For example, if a stack location, register, or instruction contains a valid memory location, to examine the memory location, right-click on the address and choose the Follow in Dump option.
- Memory Map Window: You can click on the Memory Map tab to display the contents of the Memory Map window. This provides the layout of the process memory and gives you the details of the allocated memory segments in the process. It is a great way to see where the executables and their sections are loaded in the memory. This window also contains information about the process DLLs and their sections in the memory. You can double-click on any entry to relocate the display to the corresponding memory location:

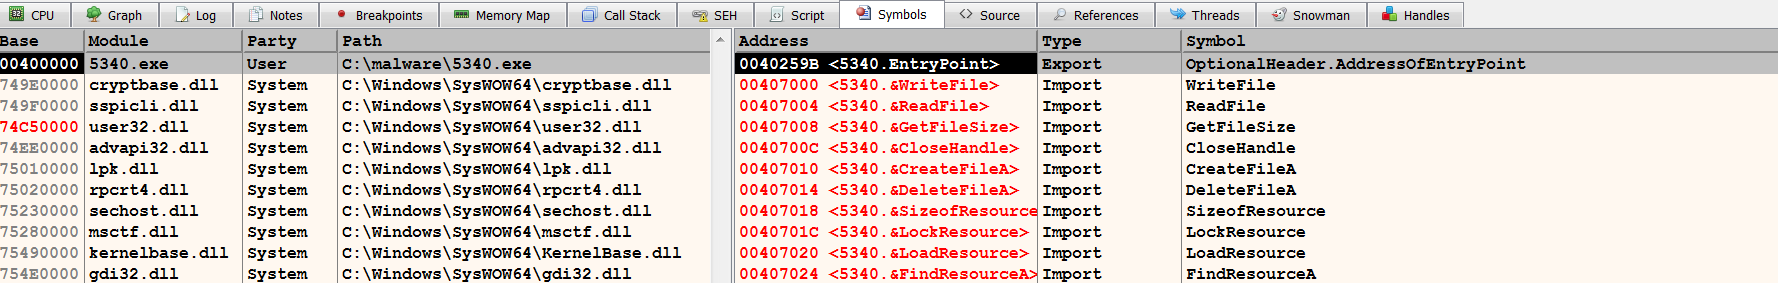
- Symbols Window: You can click on the Symbols tab to display the contents of the Symbols window. The left pane displays a list of the loaded modules (the executable and its DLLs); clicking on a module entry will display its import and export functions in the right pane, as follows. This window can be useful in determining where the import and export functions reside in the memory:
- References Window: This window displays the references to the API calls. Clicking on the References tab will not display the references to the API by default. To populate this window, right-click anywhere in the disassembly (CPU) window (with the executable loaded), then select Search for | Current Module | Intermodular calls; this will populate the references window with the references to all of the API calls in the program. The following screenshot displays references to the multiple API functions; the first entry tells you that at the address 0x00401C4D, the instruction calls the CreateFileA API (which is exported by Kernel32.dll). Double-clicking on the entry will take you to the corresponding address (in this case, 0x00401C4D). You can also set a breakpoint at this address; once the breakpoint is hit, you can inspect the parameters passed to the CreateFileA function:

- Handles Window: You can click on the Handles tab to bring up the handles window; to display the contents, right-click inside the handles window and select Refresh (or F5). This displays the details of all of the open handles. In the previous chapter, when we discussed the Windows API, you learned that the process can open handles to an object (such as the file, registry, and so on), and these handles can be passed to functions, such as WriteFile, to perform subsequent operations. The handles are useful when you are inspecting an API, such as WriteFile, that will tell you the object associated with the handle. For example, when debugging a malware sample, it is determined that the WriteFile API call accepts a handle value of 0x50. Inspecting the handles window shows that the handle value 0x50 is associated with the file ka4a8213.log, as shown here:

- Threads Window: This displays the list of threads in the current process. You can right-click on this window and suspend a thread/threads or resume a suspended thread.