Outcome Data for PACK and MaPS Teen Intensive Outpatient Program
Jocelyn N. Petrella, Tess S. Simpson, Patrice S. Crisostomo and Mary Nord Cook
The overarching goal of the Parenting Approaches for Challenging Kids (PACK) and Mastery of Psychosocial Skills (MaPS) Teen Intensive Outpatient Program (IOP) was to develop a sustainable, state-of-the-art, evidence-based program that could serve as a model for mental health service delivery at the IOP level of care. Tracking and analyzing the outcomes of the PACK and MaPS Teen IOP participants enabled the quantification and evaluation of the program’s success. Results from both parent and teen self-report ratings on the Ohio Youth Scales (Ogles, Dowell, Hatfield, Melendez, & Carlston, 2004) indicated significant improvement occurred from baseline to endpoint, as reflected in the following P values determined via paired sample t-tests: P<0.001 for both parent and teen Problem subscale, P<0.001 for both parent and teen Functioning subscale, P<0.001 for parent Hopefulness subscale and P<0.05 for teen Hopefulness subscale. Data on retention and attendance were also examined. In a sample comprised of 203 referrals, 173 completed the program, giving a retention rate of 85 percent. The families, who completed the program, attended an average of 12.7 of the recommended 15 sessions. Within a data sample of 3008 IOP sessions that were scheduled for teens, 2604 were completed, giving an attendance or compliance rate of 87 percent.
Keywords
Parent report; teen self-report; outcomes; retention; compliance; efficacy; Ohio Youth Scales; cost effectiveness; statistical significance; evidence-based
Objective
The overarching goal of the Parenting Approaches for Challenging Kids (PACK) and Mastery of Psychosocial Skills (MaPS) Teen Intensive Outpatient Program (IOP) was to develop a sustainable, state-of-the-art, evidence-based program that could serve as a model for mental health service delivery at the IOP level of care. Tracking and analyzing the outcomes of the PACK and MaPS Teen IOP participants enabled the quantification and evaluation of the program’s success. The present study used a method of retrospective chart review to examine the types of patients who participated in the PACK and MaPS Teen IOP program, clinical improvement associated with treatment, as ascertained by baseline to endpoint comparisons on the parent and teen self-report rated Ohio Youth Scales (Ogles, Dowell, Hatfield, Melendez, & Carlston, 2004), and timelines for improvement. In addition, cost-effectiveness, retention, and attendance data were examined and reported upon, in an effort to characterize fiscal and treatment compliance outcomes. This information provided a sense of the program’s feasibility, its degree of effectiveness, the duration of treatment necessary to yield significant improvement, as well as the population for whom this program was helpful.
Method
As part of the PACK and MaPS Teen IOP program’s development, outcome measures were routinely administered and analyzed. All adolescents who were enrolled in the PACK and MaPS IOP workshops, along with their parents, were asked to complete rating scales at baseline and weekly, for the duration of treatment. The standard duration of treatment was 5 weeks (with some families attending 6 weeks), with each week comprised of three IOP sessions. The Ohio Youth Scales (Ogles et al., 2004) were chosen for initial outcome assessment because of their practicality of use; they follow a method of paper-and-pencil parent and self-report, take 5–10 minutes to complete, and are affordable, necessitating only a one-time $100 licensure fee that confers unrestricted use. In addition, the scales tap all major outcome domains including problems, functioning, hopefulness, and patient satisfaction. The Ohio Scales (Ogles, Melendez, Davis, & Lunnen, 2001) have been empirically validated and shown to have good internal consistency and test–retest reliability, with psychometric properties comparable to the Achenbach Child Behavior Checklist and Youth Self-Report (Achenbach & Rescorla, 2001).
The Ohio Youth Scales contain 20 broad-ranging items related to presenting behaviors (i.e., Problem subscale), 20 items related to functioning (i.e., Functioning subscale), four items related to hopefulness (i.e., Hopefulness subscale), and four items related to satisfaction with treatment (i.e., Satisfaction subscale), each of which is rated by either the patient or parent, on a 6-point Likert scale (except the functioning subscale, which is on a 5-point Likert scale). It is important to note the scaling of the measure. Items within the Problem subscale were rated from “0” (Not at all) to “5” (All of the time). Items within the Functioning subscale were rated from “0” (Extreme troubles) to “4” (Doing very well). Thus, these scales were in the same (and expected) direction. However, items within the Hopefulness subscale were rated from “1” (Extremely satisfied/Extremely capable, etc.) to “6” (Extremely dissatisfied/Extremely incapable). Similarly, items within the Satisfaction subscale were rated from x“1” (Extremely satisfied/A great deal) to “6” (Extremely dissatisfied/Not at all). Thus, items within the Hopefulness and Satisfaction subscales were in the reverse (i.e., unexpected) direction, which is important in interpreting the results. Some sample items on the Problem subscale include the following:
3. Yelling, swearing, or screaming at others
5. Refusing to do things teachers or parents ask
Some sample Functionality subscale items include the following:
1. Getting along well with friends
3. Dating or developing relationships with boyfriends or girlfriends
4. Getting along with adults outside the family
5. Keeping neat and clean; looking good
6. Caring for health needs; good health habits
7. Controlling emotions; staying out of trouble
The Hopefulness subscale items include the following:
1. Overall, how satisfied are you with your relationship with your child right now?
2. How capable of dealing with your child’s problems do you feel right now?
3. How much stress or pressure is in your life right now?
4. How optimistic are you about your child’s future right now?
The Satisfaction subscale items include the following:
1. How satisfied are you with the mental health services your child has received so far?
2. How much are you included in treatment planning processes for your child?
3. My treatment team listens to and values my ideas about treatment planning for my child.
Baselines to endpoint scores were compared using a paired samples t-test for each of the four subscales of the parent-rated Ohio Youth Scales (Ogles et al., 2004). All data were cleaned and double-checked for accuracy. Subscale scores were established based on scoring algorithms provided in the Ohio Youth Scales manual (Ogles, Anderson, & Lunnen, 1999) and missing data were managed as recommended by the measure developers. Research assistants certified by the Colorado Multiple Institutional Review Board abstracted medical records of the target population described above. Medical record abstraction forms were used to collect demographic and diagnostic information, as well as to compile the weekly scores on the parent and teen self-report versions of the outcome measures.
Cost analyses were also performed, examining the direct and indirect costs of delivering PACK and MaPS Teen IOP, compared with payments or reimbursements. In addition, retention and attendance data were compiled and analyzed.
Results
Data were abstracted from medical records for patients enrolled in the PACK and MaPS Teen IOP program, between January 2009 and December 2012. At the time of analysis, there had been 58 families served in the Teen IOP who had both complete baseline and endpoint data available for the parent-rated scales. Among those, 46 families had both complete baseline and endpoint data available for teen self-report rated scales. Rating scales were administered and collected routinely on Mondays, immediately prior to the IOP workshops. Given that families entered the IOP at different time points, with some families having their first session on a Tuesday and finished at different time points, the baseline rating was considered to be at week 1 or week 2 (whichever was first) and endpoint data were considered to be at weeks 4, 5, or 6 (whichever was last). Thus, baseline occurred at week 1 for 81 percent of families and the remainder of families had baseline data collected at week 2. Endpoint occurred at week 4 for 17 percent of families, week 5 for 60 percent of families, and week 6 for 22 percent of families.
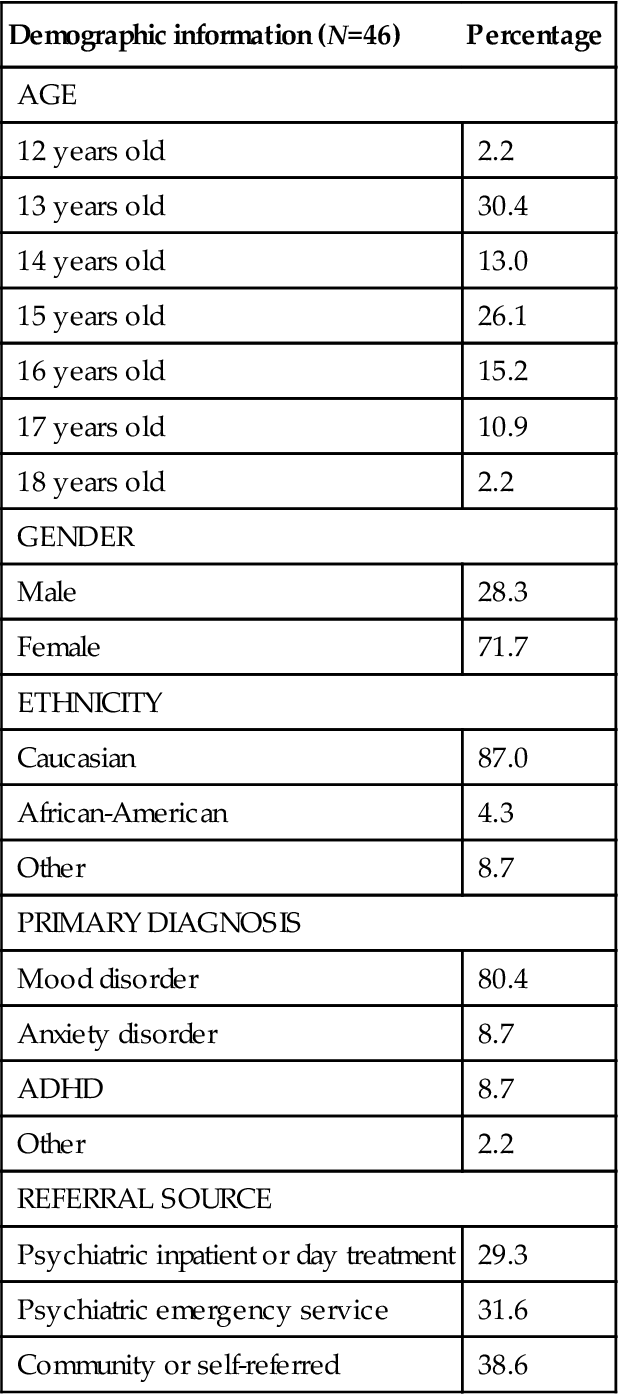
The demographic information for the sample is summarized and displayed in Table 3.1.
Table 3.1
Demographics, Primary Diagnosis, Referral Source
| Demographic information (N=46) | Percentage |
| AGE | |
| 12 years old | 2.2 |
| 13 years old | 30.4 |
| 14 years old | 13.0 |
| 15 years old | 26.1 |
| 16 years old | 15.2 |
| 17 years old | 10.9 |
| 18 years old | 2.2 |
| GENDER | |
| Male | 28.3 |
| Female | 71.7 |
| ETHNICITY | |
| Caucasian | 87.0 |
| African-American | 4.3 |
| Other | 8.7 |
| PRIMARY DIAGNOSIS | |
| Mood disorder | 80.4 |
| Anxiety disorder | 8.7 |
| ADHD | 8.7 |
| Other | 2.2 |
| REFERRAL SOURCE | |
| Psychiatric inpatient or day treatment | 29.3 |
| Psychiatric emergency service | 31.6 |
| Community or self-referred | 38.6 |
The mean number of visits completed was 13.21 (SD=2.76). Nineteen percent of the data points were derived from families in which two caregivers attended the session and completed the outcome measures for that week. Data points collected from single reporters were predominately collected from mothers. Research has shown the correlation coefficient between mother and father reports averages approximately 0.6 (Ogles, Lambert, & Fields, 2002), so in instances in which both the mother and father reported, the mother’s report was used for the analysis. If there was only a single reporter, the report of whoever attended on that day was used.
Patients were referred to the PACK and MaPS Teen IOP program either from higher levels of care including inpatient (IP) and day treatment (DT) psychiatric programs, from the emergency department (ED), or from the community, through parent self-referral or provider-generated referrals. Details regarding referral sources are displayed in Table 3.1, along with patient ethnicity, age, and primary psychiatric diagnosis. As can be seen in Table 3.1, the majority of teens who were referred from IP, DT, or the ED had a mood disorder as their primary diagnosis. Half of the teens referred from the community also had a mood disorder listed as their primary diagnosis.
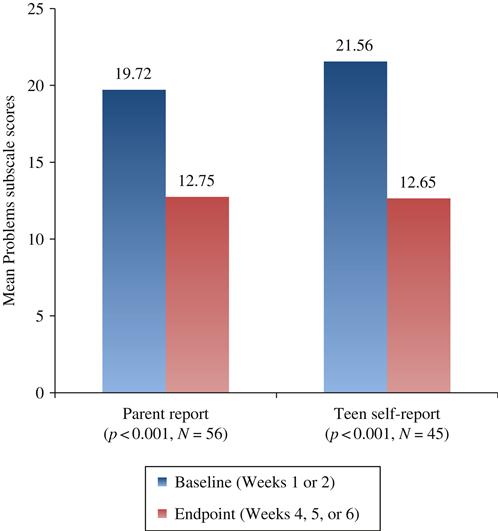
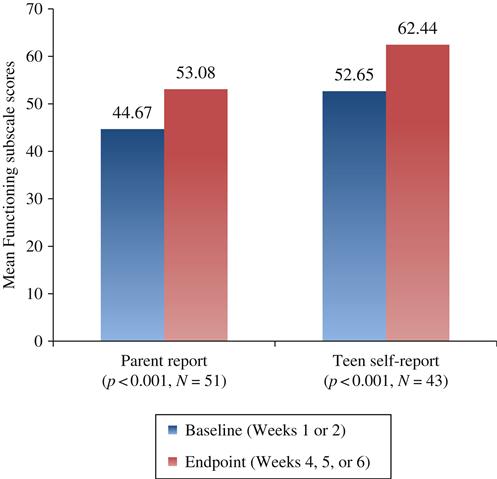
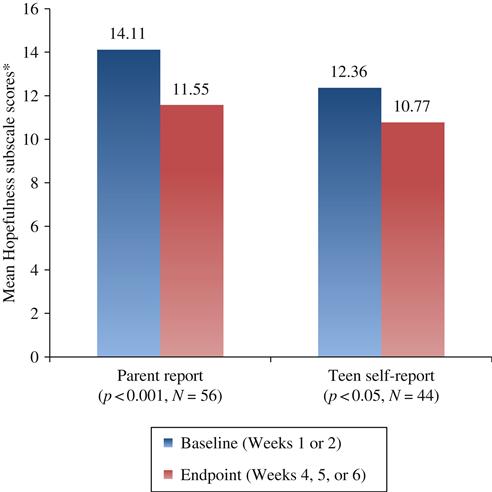
Paired samples t-tests were conducted to determine if the means of the four subscales significantly differed by time point (i.e., baseline to endpoint). Results from the parent ratings indicated that significant improvement occurred from baseline to endpoint on the Problem subscale, t(55)=3.84, P<0.001 (baseline: M=19.72, SD=14.95; endpoint: M=12.75, SD=10.71), Functioning subscale t(50)=−4.14, P<0.001 (baseline: M=44.67, SD=14.96; endpoint: M=53.08, SD=13.22), and Hopefulness subscale t(55)=4.63, P<0.001 (baseline: M=14.11, SD=4.43; endpoint: M=11.55, SD=3.45). Note that within the Hopefulness subscale, higher scores represent less hopefulness. These results suggest that, according to parent ratings, there was a decrease in teens’ problems, an increase in teens’ functioning, and an increase in parental hopefulness.
Similarly, results from the teen self-report ratings indicated that significant improvement occurred from baseline to endpoint on the Problem subscale, t(44)=5.44, P<0.001 (baseline: M=21.56, SD=14.20; endpoint: M=12.65, SD=11.16), Functioning subscale t(42)=−5.61, P<0.001 (baseline: M=52.65, SD=12.40; endpoint: M=62.44, SD=13.32), and Hopefulness subscale t(43)=2.66, P<0.05 (baseline: M=12.36, SD=3.85; endpoint: M=10.77, SD=4.13). Again, note that within the Hopefulness subscale, higher scores represent less hopefulness. These results suggest that, according to teen self-report ratings, there was a decrease in teens’ problems, an increase in teens’ functioning, and an increase in teens’ hopefulness. Both parent and teen self-report results of the paired samples t-tests on the Problem, Functioning, and Hopefulness subscales are depicted graphically in Figures 3.1–3.3.
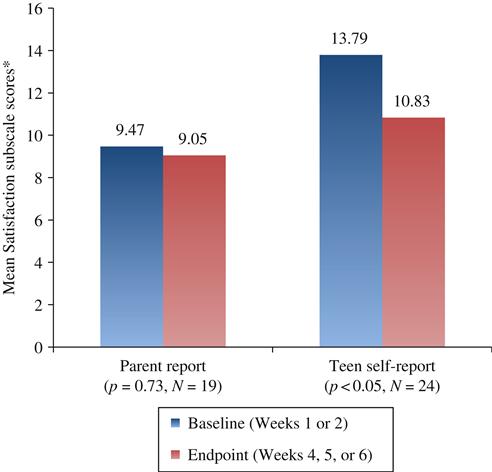
Analysis of the final subscale (i.e., Satisfaction) yielded interesting results when comparing parent ratings to teen self-report ratings. Baseline and endpoint comparisons on the Satisfaction subscale of the parent-rated Ohio Youth Scales (Ogles et al., 2004) did not reveal significant change, t(18)=0.36, P=0.73 (baseline: M=9.47, SD=4.72; endpoint: M=9.05, SD=4.42). The overall, single-point Satisfaction scores for the program remained constant in parent ratings with an average rating of “moderately satisfied”/“moderately” or around 2 on a 1–6 Likert scale in which 1 is the highest score, representing “extremely satisfied”/“a great deal” and 6 is the lowest, representing “extremely dissatisfied”/“not at all.” However, results from the teen self-report ratings indicated that significant improvement occurred from baseline to endpoint on the Satisfaction subscale, t(23)=3.31, P<0.05 (baseline: M=13.79, SD=4.12; endpoint: M=10.83.65, SD=4.23). Thus, in general, teens’ satisfaction with the IOP improved over the course of the program. In addition, they seemed to have a higher sense of empowerment concerning their treatment in comparing baseline to endpoint. The mean change scores from the parent-rated and teen self-report Satisfaction subscale (baseline to endpoint comparisons) are depicted graphically in Figure 3.4. Note that within the Satisfaction subscale, higher scores represent less satisfaction.
In hindsight, it was recognized that the Satisfaction subscale questions from the Ohio Youth Scales (Ogles et al., 2004) did not provide an optimal assessment of patient satisfaction for the PACK and MaPS Teen IOP program because the program was designed to be highly standardized and structured, whereas three out of the four Ohio Youth Scales Satisfaction scale questions specifically tapped the level of perceived input to treatment. In addition, the overall average rating of 2 for parent ratings was the second highest rating on a 6-point scale, but the verbiage associated with a rating of 2 was “moderately satisfied”/“moderately,” which seemed inconsistent relative to the numeric rating. Furthermore, baseline outcome questionnaires were administered either immediately prior to the first IOP session, at which point, families could not yet comment on satisfaction with treatment, or immediately prior to their third session, at which point, they had only completed 2 of 15 (or 18) sessions. Additional parameters examined to more aptly assess patient satisfaction were retention and attendance data, which are detailed below. Details regarding the content of the parent-rated Satisfaction subscale of the Ohio Youth Scales (Ogles et al., 2004) as well as the paired samples t-test baseline to endpoint analysis for parent ratings for that subscale follow:
Satisfaction scale (higher scores indicate less satisfaction; lower scores indicate more satisfaction [1–6 Likert scale: question #1: 1=extremely satisfied and 6=extremely dissatisfied, questions #2–4: 1=a great deal and 6=not at all]):
Question #1: How satisfied are you with IOP so far?
Baseline mean=2.30 (moderately satisfied)
Endpoint mean=2.06 (moderately satisfied)
Question #2: How much are you included in the treatment planning process for your child?
Baseline mean=2.22 (moderately)
Endpoint mean=2.27 (moderately)
Question #3: My treatment team listens to and values my ideas about treatment planning for my child.
Baseline mean=2.50 (quite a bit)
Endpoint mean=2.26 (moderately)
Question #4: I have a lot of say about what happens in my treatment.
Cost-Effectiveness, Retention, and Attendance Data
Additional outcomes that were assessed pertained to cost-effectiveness, retention, and attendance. The PACK and MaPS Teen IOP program was delivered in a hospital setting, and payments for the service were obtained almost exclusively through third-party or insurance collections. Commercial managed-care companies were willing to contract for the service at rates that covered the costs of service delivery partly because they were interested in a program that could potentially serve as a hospital diversion and maintain patients in a lower level of care, than IP or partial hospitalization. Government insurances, including Medicaid and Tricare, did not offer IOP as a covered benefit; therefore, families with those insurance plans could not be served in IOP. Financial analyses demonstrated that collections from insurance exceeded the direct costs (i.e., expenses of provider and staff salaries), of delivering the IOP service and in addition contributed to the indirect or overhead costs of providing hospital-based treatment. If the program had been provided in a non-hospital-based setting with significantly lower overhead or indirect costs, insurance payments would have exceeded overall costs of service delivery.
Data on retention and attendance were also examined. Between January 2007 and June 2011, 203 unique adolescents, and their families were enrolled in PACK and MaPS IOP Teen, and attended at least one session. Among those, 173 completed the program, giving a retention rate of 85%. The families, who completed the program, attended an average of 12.7 of the recommended 15 sessions. Between January 2007 and June 2011, 3008 IOP sessions were scheduled for these teens, of which 2604 were completed, giving an attendance or compliance rate of 87 percent. These data suggest that once enrolled, families were highly committed to attending all scheduled sessions and completing the program. There were 30 adolescent patients who were admitted to the Teen IOP, attended at least one session, but dropped out of the program prematurely, completing three or fewer sessions. Of those 30, six (20 percent) were found to be too acute to be safely maintained at that level of care and were referred to higher levels of care, within the first 2 weeks of enrollment. Among the remaining 23 adolescent patients who attended at least one session, but discontinued treatment prematurely, 6 (20 percent) of that subgroup were referred by PACK and MaPS Teen providers to other routine or intensive outpatient psychiatric programs at Children’s Hospital Colorado, 6 out of 23 (20 percent) terminated prematurely because of adolescent patient refusal, 4 (13 percent) cited financial concerns as the reason for dropping out, and 8 (27 percent) left the program early, for unknown reasons.