Big Data Analytics = Machine Learning + Cloud Computing
C. Wu; R. Buyya; K. Ramamohanarao
Abstract
“Big Data” can mean different things to different people. The scale and challenges of Big Data are often described using three attributes, namely volume, velocity, and variety (3Vs), which only reflect some of the aspects of data. In this chapter, we review historical aspects of the term “big data” and the associated analytics. We augment the 3Vs with additional attributes of big data to make it more comprehensive and relevant. We show that Big Data is not just the 3Vs, but actually 32Vs; that is, 9Vs covering the fundamental motivation behind Big Data, which is to incorporate business intelligence based on different hypothesis or statistical models so that Big Data analytics (BDA) can enable decision makers to make useful predictions for making some crucial decisions or researching results. History of Big Data has demonstrated that the most cost-effective way of performing BDA is to employ machine learning (ML) on the cloud computing (CC)-based infrastructure or simply, ML + CC → BDA. This chapter is devoted to help decision makers by defining BDA as a solution and opportunity to address their business needs.
Keywords
Big Data analytics (BDA); Business intelligence (BI); Machine learning (ML); Cloud computing (CC); Extraction, Transformation, and load (ETL); Statistics; Hadoop; Spark; Flink; MapReduce
1.1 Introduction
Although the term “Big Data” has become popular, there is no general consensus about what it really means. Often, many professional data analysts would imply the process of extraction, transformation, and load (ETL) for large datasets as the connotation of Big Data. A popular description of Big Data is based on three main attributes of data: volume, velocity, and variety (or 3Vs). Nevertheless, it does not capture all the aspects of Big Data accurately. In order to provide a comprehensive meaning of Big Data, we will investigate this term from a historical perspective and see how it has been evolving from yesterday’s meaning to today’s connotation.
Historically, the term Big Data is quite vague and ill defined. It is not a precise term and does not carry a particular meaning other than the notion of its size. The word “big” is too generic; the question how “big” is big and how “small” is small [1] is relative to time, space, and circumstance. From an evolutionary perspective, the size of “Big Data” is always evolving. If we use the current global Internet traffic capacity [2] as a measuring stick, the meaning of Big Data volume would lie between the terabyte (TB or 1012 or 240) and zettabyte (ZB or 1021 or 270) range. Based on the historical data traffic growth rate, Cisco claimed that humans have entered the ZB era in 2015 [2]. To understand the significance of the data volume’s impact, let us glance at the average size of different data files shown in Table 1.
Table 1
Typical Size of Different Data Files
| Media | Average Size of Data File | Notes (2014) |
| Web page | 1.6–2 MB | Average 100 objects |
| eBook | 1–5 MB | 200–350 pages |
| Song | 3.5–5.8 MB | Average 1.9 MB/per minute (MP3) 256 Kbps rate (3 mins) |
| Movie | 100–120 GB | 60 frames per second (MPEG-4 format, Full High Definition, 2 hours) |
The main aim of this chapter is to provide a historical view of Big Data and to argue that it is not just 3Vs, but rather 32Vs or 9Vs. These additional Big Data attributes reflect the real motivation behind Big Data analytics (BDA). We believe that these expanded features clarify some basic questions about the essence of BDA: what problems Big Data can address, and what problems should not be confused as BDA. These issues are covered in the chapter through analysis of historical developments, along with associated technologies that support Big Data processing. The rest of the chapter is organized into eight sections as follows:
1) A historical review for Big Data
2) Interpretation of Big Data 3Vs, 4Vs, and 6Vs
3) Defining Big Data from 3Vs to 32Vs
4) Big Data and Machine Learning (ML)
5) Big Data and cloud computing
6) Hadoop, Hadoop distributed file system (HDFS), MapReduce, Spark, and Flink
7) ML + CC (Cloud Computing) → BDA and guidelines
8) Conclusion
1.2 A Historical Review of Big Data
In order to capture the essence of Big Data, we provide the origin and history of BDA and then propose a precise definition of BDA.
1.2.1 The Origin of Big Data
Several studies have been conducted on the historical views and developments in the BDA area. Gil Press [3] provided a short history of Big Data starting from 1944, which was based on Rider’s work [4]. He covered 68 years of history of evolution of Big Data between 1944 and 2012 and illustrated 32 Big Data-related events in recent data science history. As Press indicated in his article, the fine line between the growth of data and Big Data has become blurred. Very often, the growth rate of data has been referred as “information explosion”; although “data” and “information” are often used interchangeably, the two terms have different connotations. Press’ study is quite comprehensive and covers BDA events up to December 2013. Since then, there have been many relevant Big Data events. Nevertheless, Press’ review did cover both Big Data and data science events. To this extent, the term “data science” could be considered as a complementary meaning to BDA.
In comparison with Press’ review, Frank Ohlhorst [5] established the origin of Big Data back to 1880 when the 10th US census was held. The real problem during the 19th century was a statistics issue, which was how to survey and document 50 million of North American citizens. Although Big Data may contain computations of some statistics elements, these two terms have different interpretations today. Similarly, Winshuttle [6] believes the origin of Big Data was in the 19th century. Winshuttle argue if data sets are so large and complex and beyond traditional process and management capability, then these data sets can be considered as Big Data. In comparison to Press’ review, Winshuttle’s review emphasizes enterprise resource planning and implementation on cloud infrastructure. Moreover, the review also makes a predication for data growth to 2020. The total time span of the review was more than 220 years. Winshuttle’s Big Data history included many SAP events and its data products, such as HANA.
The longest span of historical review for Big Data belongs to Bernard Marr’s description [7]. He traced the origin of Big Data back to 18,000 BCE. Marr argued that we should pay attention to historical foundations of Big Data, which are different approaches for human to capture, store, analyze, and retrieve both data and information. Furthermore, Marr believed that the first person who casted the term “Big Data” was Erik Larson [8], who presented an article for Harper’s Magazine that was subsequently reprinted in The Washington Post in 1989 because there were two sentences that consisted of the words of Big Data: “The keepers of Big Data say they do it for the consumer’s benefit. But data have a way of being used for purposes other than originally intended.”
In contrast, Steve Lohr [9] disagrees with Marr’s view. He argues that just adopting the term alone might not have the connotation of today’s Big Data because “The term Big Data is so generic that the hunt for its origin was not just an effort to find an early reference to those two words being used together. Instead, the goal was the early use of the term that suggests its present interpretation — that is, not just a lot of data, but different types of data handled in new ways.” This is an important point. Based on this reasoning, we consider that Cox and Ellsworth [10] as proposers of the term Big Data because they assigned a relatively accurate meaning to the existing view of Big Data, which they stated, “…data sets are generally quite large, taxing the capacities of main memory, local disk and even remote disk. We call this the problem of Big Data. When data sets do not fit in main memory (in core), or when they do not fit even on local disk…” Although today’s term may have an extended meaning as opposed to Cox and Ellsworth’s term, this definition reflects today’s connotation with reasonable accuracy.
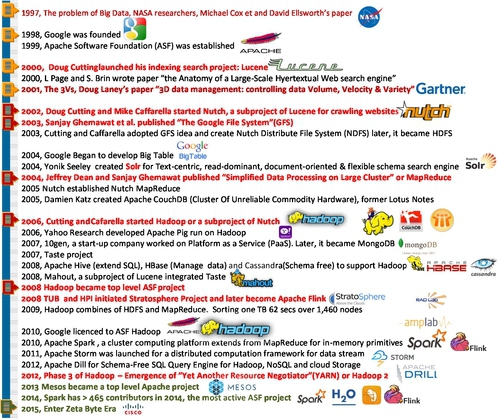
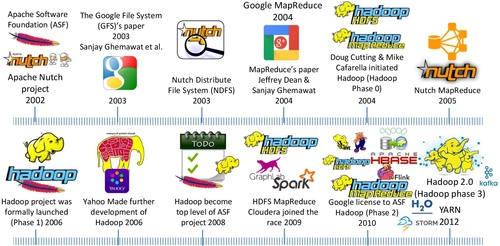
Another historical review was contributed by Visualizing.org [11]. It focused on the timeline of how to implement BDA. Its historical description is mainly determined by events related to the Big Data push by many Internet and IT companies, such as Google, YouTube, Yahoo, Facebook, Twitter, and Apple. It emphasized the significant impact of Hadoop in the history of BDA. It primarily highlighted the significant role of Hadoop in the BDA. Based on these studies, we show the history of Big Data, Hadoop, and its ecosystem in Fig. 1.
Undoubtedly, there will be many different views based on different interpretations of BDA. This will inevitably lead to many debates of Big Data implication or pros and cons.
1.2.2 Debates of Big Data Implication
Pros
There have been many debates regarding Big Data’s pros and cons during the past few years. Many advocates declare Big Data to be a new rock star [12] and that it will be the next frontier [13,14] for innovation, competition, and productivity because data is embedded in the modern human being’s life. Data that are generated every second by both machines and humans is a byproduct of all other activities. It will become the new epistemologies [15] in science. To certain degree, Mayer and Cukier [16] argued that Big Data would revolutionize our way of thinking, working, and living. They believe that a massive quantitative data accumulation will lead to qualitative advances at the core of BDA: ML, parallelism, metadata, and predictions: “Big Data will be a source of new economic value and innovation” [16]. Their conclusion is that data can speak for itself, and we should let the data speak.
To a certain extent, Montjoye et al. [17] echoed the above conclusion. They demonstrated that it is highly probable (over 90% reliability) to reidentify a person with as few as four spatiotemporal data points (eg, credit card transactions in a shopping mall) by leveraging BDA. Their conclusion is that “large-scale data sets of human behavior have the potential to fundamentally transform the way we fight diseases, design cities and perform research.”
Cons
In contrast, some argue that Big Data is inconclusive, overstated, exaggerated, and misinformed by the media and that data cannot speak for itself [18]. It does not matter how big the data set is. It could be just another delusion because “it is like having billions of monkeys typing, one of them will write Shakespeare” [19]. In Dobelli’s term [20], we should “never judge a decision by its outcome — outcome bias.” In other words, if one of the monkeys can type Shakespeare, we cannot conclude or inference that a monkey has sufficient intelligence to be Shakespeare.
Gary Drenik [21] believed that the sentiment of the overeager adoption of Big Data is more like “Extraordinary Popular Delusion and the Madness of Crowds,” the description made by Charles Mackay [22] in his famous book’s title. Psychologically, it is a kind of a crowd emotion that seems to have a perpetual feedback loop. Drenik quoted this “madness” with Mackay’s warning: “We find that whole communities suddenly fix their minds upon one subject, and go mad in its pursuit; that millions of people become simultaneously impressed with one delusion, and run it till their attention is caught by some new folly more captivating than the first.” The issue that Drenik has noticed was “the hype overtaken reality and there was little time to think about” regarding Big Data. The former Obama’s campaign CTO: Harper Reed, had the real story in terms of adoption of BDA. His remarks of Big Data were “literally hard” and “expensive” [23].
Danah Boyd et al. [24] are quite skeptical in regarding big data in terms of its volume. They argued that bigger data are not always better data from a social science perspective. In responding to “The End of Theory” [25] proposition, Boyd asserted that theory or methodology is still highly relevant for today’s statistical inference and “The size of data should fit the research question being asked; in some cases, small is best.” Boyd et al. suggested that we should not pay a lot of attention to the volume of data. Philosophically, this argument is similar to the debate between John Stuart Mill (Mill’s five classical or empirical methods) and his critics [26]. Mill’s critics argued that it is impossible to bear on the intelligent question just by ingesting as much as data alone without some theory or hypothesis. This means that we cannot make Big Data do the work of theory.
Another Big Data critique comes from David Lazer et al. [27]. They demonstrated that the Google flu trends (GFT) prediction is the parable and identified two issues (Big Data hubris and algorithm dynamics) that contributed to GFT’s mistakes. The issue of “Big Data hubris” is that some observers believe that BDA can replace traditional data mining completely. The issue of “algorithm dynamics” is “the changes made by [Google’s] engineers to improve the commercial service and by consumers in using that service.” In other words, the changing algorithms for searching will directly impact the users’ behavior. This will lead to the collected data that is driven by deliberated algorithms. Lazer concluded there are many traps in BDA, especially for social media research. Their conclusion was “we are far from a place where they (BDA) can supplant more traditional methods or theories.”
All these multiple views are due to different interpretations of Big Data and different implementations of BDA. This suggests that in order to resolve these issues, we should first clarify the definition of the term BDA and then discover the clash point based on the same term.
1.3 Historical Interpretation of Big Data
1.3.1 Methodology for Defining Big Data
Intuitively, neither yesterday’s data volume (absolute size) nor that of today can be defined as “big.” Moreover, today’s “big” may become tomorrow’s “small.” In order to clarify the term Big Data precisely and settle the debate, we can investigate and understand the functions of a definition based on the combination of Robert Baird [28] and Irving Copi’s [29] approaches (see Fig. 2).
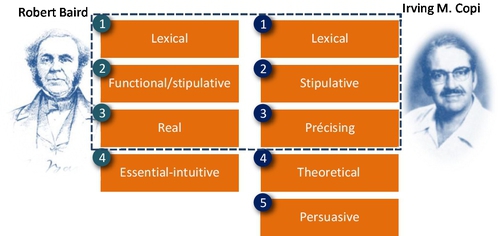
Based on Baird or Irving’s approach of definition, we will first investigate the historical definition from an evolutionary perspective (lexical meaning). Then, we extend the term from 3Vs to 9Vs or 32Vs based on its motivation (stipulative meaning), which is to add more attributes for the term. Finally, we will eliminate ambiguity and vagueness of the term and make the concept more precise and meaningful.
1.3.2 Different Attributes of Definitions
Gartner — 3Vs definition
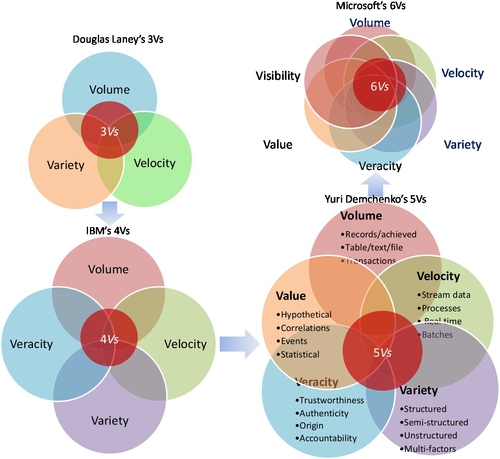
Since 1997, many attributes have been added to Big Data. Among these attributes, three of them are the most popular and have been widely cited and adopted. The first one is so called Gartner’s interpretation or 3Vs; the root of this term can be traced back to Feb. 2001. It was casted by Douglas Laney [30] in his white paper published by Meta group, which Gartner subsequently acquired in 2004. Douglas noticed that due to surging of e-commerce activities, data has grown along three dimensions, namely:
1. Volume, which means the incoming data stream and cumulative volume of data
2. Velocity, which represents the pace of data used to support interaction and generated by interactions
3. Variety, which signifies the variety of incompatible and inconsistent data formats and data structures
According to the history of the Big Data timeline [30], Douglas Laney’s 3Vs definition has been widely regarded as the “common” attributes of Big Data but he stopped short of assigning these attributes to the term “Big Data.”
IBM — 4Vs definition
IBM added another attribute or “V” for “Veracity” on the top of Douglas Laney’s 3Vs notation, which is known as the 4Vs of Big Data. It defines each “V” as following [31,32]:
1. Volume stands for the scale of data
2. Velocity denotes the analysis of streaming data
3. Variety indicates different forms of data
4. Veracity implies the uncertainty of data
Zikopoulos et al. explained the reason behind the additional “V” or veracity dimension, which is “in response to the quality and source issues our clients began facing with their Big Data initiatives” [33]. They are also aware of some analysts including other V-based descriptors for Big Data, such as variability and visibility.
Microsoft — 6Vs definition
For the sake of maximizing the business value, Microsoft extended Douglas Laney’s 3Vs attributes to 6 Vs [34], which it added variability, veracity, and visibility:
1. Volume stands for scale of data
2. Velocity denotes the analysis of streaming data
3. Variety indicates different forms of data
4. Veracity focuses on trustworthiness of data sources
5. Variability refers to the complexity of data set. In comparison with “Variety” (or different data format), it means the number of variables in data sets
6. Visibility emphasizes that you need to have a full picture of data in order to make informative decision
More Vs for big data
A 5 Vs’ Big Data definition was also proposed by Yuri Demchenko [35] in 2013. He added the value dimension along with the IBM 4Vs’ definition (see Fig. 3). Since Douglas Laney published 3Vs in 2001, there have been additional “Vs,” even as many as 11 [36].
All these definitions, such as 3Vs, 4Vs, 5Vs, or even 11 Vs, are primarily trying to articulate the aspect of data. Most of them are data-oriented definitions, but they fail to articulate Big Data clearly in a relationship to the essence of BDA. In order to understand the essential meaning, we have to clarify what data is.
Data is everything within the universe. This means that data is within the existing limitation of technological capacity. If the technology capacity is allowed, there is no boundary or limitation for data. The question is why we should capture it in the first place. Clearly, the main reason of capturing data is not because we have enough capacity to capture high volume, high velocity, and high variety data rather than to find a better solution for our research or business problem, which is to search for actionable intelligence. Pure data-driven analysis may add little value for a decision maker; sometimes, it may only add the burden for the costs or resources of BDA. Perhaps this is why Harper believes Big Data is really hard [23].
1.3.3 Summary of 7 Types Definitions of Big Data
Table 2 shows seven types of definitions, summarized by Timo Elliott [36] and based on more than 33 Big Data definitions [41].
Table 2
Seven Popular Big Data Definitions
| No | Type | Description |
| 1 | The original big data (3Vs) | The original type of definition is referred to Douglas Laney’s volume, velocity, and variety, or 3Vs. It has been widely cited since 2001. Many have tried to extend the number of Vs, such as 4Vs, 5Vs, 6Vs … up to 11Vs |
| 2 | Big Data as technology | This type of definition is oriented by new technology development, such as MapReduce, bulk synchronous parallel (BSP — Hama), resilient distributed datasets (RDD, Spark), and Lambda architecture (Flink) |
| 3 | Big Data as application | This kind of definition emphasizes different applications based on different types of big data. Barry Devlin [37] defined it as application of process-mediated data, human-sourced information, and machine-generated data. Shaun Connolly [38] focused on analyzing transactions, interactions, and observation of data. It looks for hindsight of data |
| 4 | Big Data as signals | This is another type of application-oriented definition, but it focuses on timing rather than the type of data. It looks for a foresight of data or new “signal” pattern in dataset |
| 5 | Big Data as opportunity | Matt Aslett [39]: “Big data as analyzing data that was previously ignored because of technology limitations.” It highlights many potential opportunities by revisiting the collected or archived datasets when new technologies are variable |
| 6 | Big Data as metaphor | It defines Big Data as a human thinking process [40]. It elevates BDA to the new level, which means BDS is not a type of analytic tool rather it is an extension of human brain |
| 7 | Big Data as new term for old stuff | This definition simply means the new bottle (relabel the new term “big data”) for old wine (BI, data mining, or other traditional data analytic activities). It is one of the most cynical ways to define big data |
Each of the above definitions intends to describe a particular issue from one aspect of Big Data only and is very restrictive. However, a comprehensive definition can become complex and very long. A solution for this issue is to use “rational reconstruction” offered by Karl Popper, which intends to make the reasons behind practice, decision, and process explicit and easier to understand.
1.3.4 Motivations Behind the Definitions
The purpose of Big Data or BDA is to gain hindsight (ie, metadata patterns emerging from historical data), insight (ie, deep understanding of issues or problems), and foresight (ie, accurate prediction in near future) in a cost-effective manner. However, these important and necessary attributes are often neglected by many definitions that only focus on either single-issue or data aspects. In order to reflect all aspects of Big Data, we consider all attributes from different aspects.
1.4 Defining Big Data From 3Vs to 32Vs
The real objective of BDA is actually to seek for business intelligence (BI). It enables decision makers to make the right decisions based on predictions through the analysis of available data. Therefore, we need to clarify new attributes of Big Data and establish their relationship meaning cross three aspects (or domain knowledge), namely:
• Data domain (searching for patterns)
• Business intelligence domain (making predictions)
• Statistical domain (making assumptions)
1.4.1 Data Domain
Laney’s 3Vs have captured the importance of Big Data characteristics reflecting the pace and exploration phenomena of data growth during the last few years. In this, the key attribute in data aspect is volume. If we look the history of data analytics, the variation of velocity and variety is relatively small in comparison with volume. The dominated V that often exceeds our current capacity for data processing is volume. Although volume cannot determine all attributes of data, it is one of the crucial factors in BDA.
1.4.2 Business[1] Intelligent (BI) Domain
When we discuss BI of BDA, we mean value, visibility, and verdict within the business intelligent domain. These 3Vs are the motivations or drivers for us to implement BDA process at the first place. If we cannot achieve BI, the pure exercise of data analytics will be meaningless. From a decision maker’s perspective, these 3Vs are how to leverage data’s 3Vs for BI’s 3Vs.
• Visibility: It does not only focus on the insight but also focuses on metadata or sometimes the wisdom of data crowds or hierarchical level of abstraction data patterns. From a BI perspective, it provides hindsight, insight, and foresight of a problem and an adequate solution associated with it.
• Value: the purpose of V for value is to answer the question of “Does the data contain any valuable information for my business needs?” In comparison with 5Vs definition, it is not just the value of data but also the value of BI for problem solving. It is the value and utility for the long-term or strategic pay off.
• Verdict: It is a potential choice or decision that should be made by a decision maker or committee based on the scope of the problem, available resources, and certain computational capacity. This is the most challenging V to be quantified at the beginning of BDA. If there are many hypotheses or “What-ifs,” the cost of collecting, retrieving data, and ETL, especially to extract archived data, will be costly (see Fig. 4).
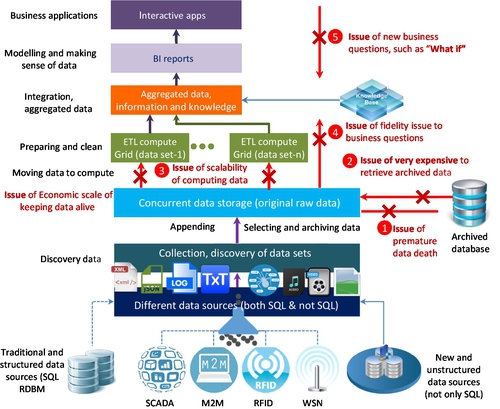
These business motivations led to the new BDA platforms or MapReduce processing frameworks, such as Hadoop. It intends to answer the five basic questions in Big Data, as shown in Fig. 4. These questions reflect the bottom line of BI:
1. How to store massive data (such as in PB or EB scale currently) or information in the available resources
2. How to access these massive data or information quickly
3. How to work with datasets in variety formats: structured, semi-structured, and unstructured
4. How to process these datasets in a full scalable, fault tolerant, and flexible manner
5. How to extract BI interactively and cost-effectively
In this domain, the key notation of V is visibility, which is to obtain the prediction or real-time insight from BDA exercises. The relationship of these 3Vs in BI is that without visibility, other 2Vs will be impossible.
1.4.3 Statistics Domain
Similarly, we should have another set of 3 V attributes in the statistic domain, which are veracity, validity, and variability. These 3Vs should establish the statistic models based on the right hypothesis (What if), which is the trustworthiness of the data sets and the reliability of the data sources. If the hypothesis is inadequate or the data source is contaminated or the statistics model is incorrect, the BDA might lead to a wrong conclusion. There have been many lessons regarding contaminated data samples. A famous example was the opinion poll for the 1936 US presidential election that was carried by Literary Digest magazine before the election [42]. Because the sample data (2.4 million survey responses) were accidentally contaminated, the result of their predication (or president winner in 1936) became a disaster for the polling company. Therefore, the statistics domain should consist of following attributes:
• Veracity: Philosophically speaking, it is the true information (or fact) is the resolution of data uncertainty. V of Veracity is searching for trustworthiness and certainty of data sets.
• Validity: It is to verify the quality of data being logically sound. The V of validity emphasizes how to correctly acquire data and avoid biases. Another essential meaning of validity is the inference process based on a statistical model.
• Variability: It is the implication of data complexity and variation. For example, Bruce Ratner [43] believed that if there are more than 50 variables or different features in one dataset, it could be considered as “Big Data.” Statistically, it is how to use the logical inference process to reduce data complexity and reach desirable outcomes or predictions for business needs.
The key attribute of this aspect is veracity, which emphasizes how to build a statistical model close to the reality. The process to approach veracity can be considered an exercise of a curve fitting: If we have few constraints, the regression errors of the curve will be too large. If we adopt too many constraints, it will cause an overfitting problem.
1.4.4 32 Vs Definition and Big Data Venn Diagram
Once all 32 Vs attributes have been defined from three different aspects, we can establish a combined Venn diagram and their relationships. This has become our definition of Big Data (see Fig. 5), which is comprehensive enough to capture all aspects of Big Data.
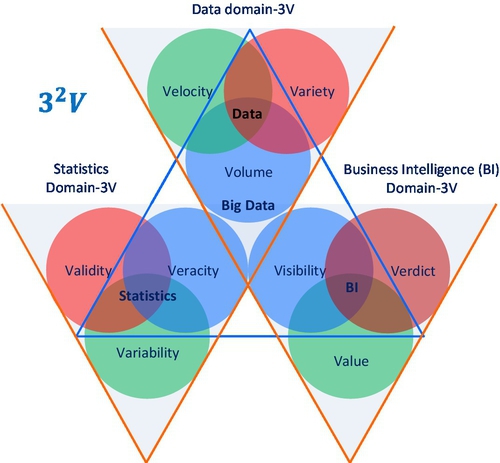
As shown in Fig. 5, each Venn diagram is supported by one V shape of a triangle to illustrate 3Vs’ attributes in one aspect. Moreover, three key attributes from each Venn diagram can also form a single hierarchical triangle diagram. It represents the essential meaning of Big Data.
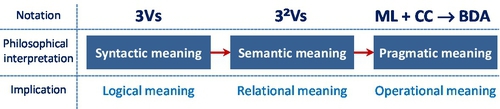
If the original 3Vs’ data attributes represented a syntactic or logical meaning of Big Data, then 32Vs (or 9Vs) represent the semantic meaning (relationship of data, BI, and statistics). For many complex problems or applications, the 32Vs could be interpreted as a hierarchical model, for which three key attributes form a higher level 3Vs to be learnt by a machine. At the heart of BDA, there is “machine learning” because without the machine (computer), the mission of learning from Big Data would be impossible.
1.5 Big Data Analytics and Machine Learning
1.5.1 Big Data Analytics
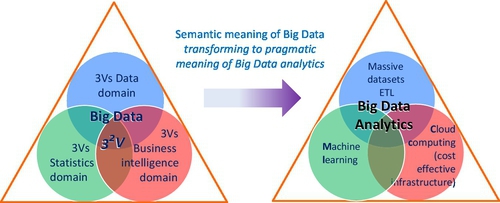
If 32Vs represent semantic meaning of Big Data, then BDA represents pragmatic meaning of Big Data. We can view from computational viewpoint, Big Data Venn diagram with a BDA’s Venn diagram in Fig. 6.
According to Arthur Samuel, the original definition of ML was “The field of study that gives computers (or machines) that ability to learn without being explicitly programmed” [44]. Historically, there have been many terms that intend to describe the equivalent meaning of ML, such as learning from data, pattern Recognition, data science, data mining, text mining, or even BI, etc. If we list all terms based on their different orientations, we can probably find there are more than 32 different descriptions that contain certain meanings of ML from four aspects (see Table 3):
Table 3
Popular Interpretation of ML
| Data | Information | Knowledge | Intelligence |
| Data mining | Information analytics | Real-time analytics | Business analysis |
| Data science | Information visualization | Predictive analytics | Business intelligence |
| Data warehouse | Information system management | Machine learning | Artificial intelligence |
| Learning from data | Text analytics | Knowledge base system | Decision support system |
| Data smart | Text mining | Pattern recognition | Actionable intelligence |
| Data analytics | Web analytics | Statistical application | Business forecasting |
| Making sense of data | Web semantic analysis | Knowledge discovery | Business strategy |
| Data ingestion | Web searching | Expert systems | Business transformation |
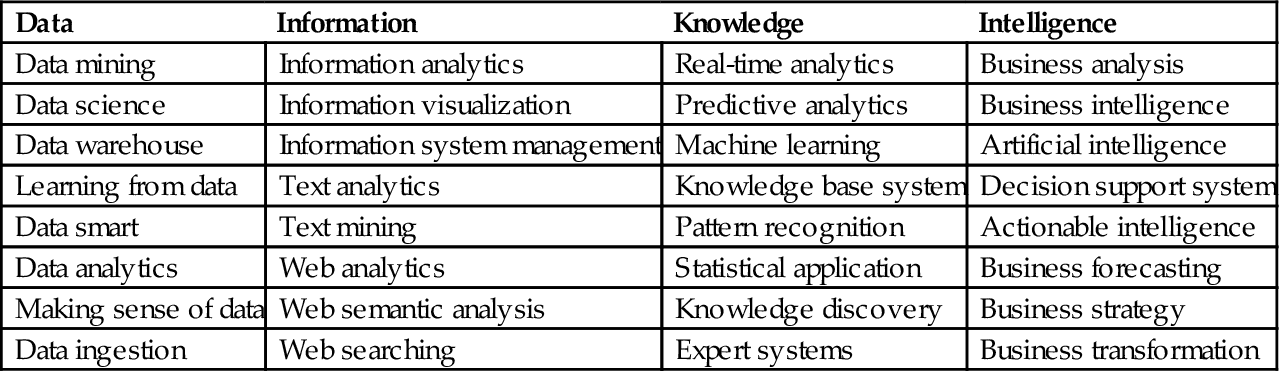
• Information
• Knowledge
• Intelligence
1.5.2 Machine Learning
The essence of ML is an automatic process of pattern recognition by a learning machine. The main objective of ML is to build systems that can perform at or exceed human level competence in handling many complex tasks or problems. ML is a part of artificial intelligence (AI). During the early AI research era, the goal was to build robots and to simulate human activities. Later, the application of AI has been generalized to solve general problems by a machine. The popular solution was to feed a computer with algorithms (or a sequence of instructions) so it can transform the input data to output answers. This is often called a rule-based system or Good Old-Fashioned of Artificial Intelligence (GOFAI), such as expert systems.
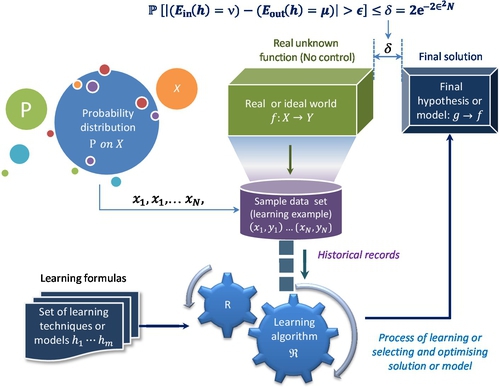
However, we cannot easily find suitable algorithms for many problems; for example, the recognition of human handwriting. We do not know how to transform the input of handwriting letter to the output of the standard recognized letter; an alternative is learning from data. The principle of learning from data is similar as both trial and error and “The Wisdom of Crowds” [45]. This means that having one trial could have a large error but if we can aggregate many trials, the error will be reduced down to an acceptable level or convergence. Fig. 7 illustrates a typical example of a ML process or learning from data.
Since the dotcom boom started in late 1990s, the volume of data has become increasingly larger. A logical question is how to deal with these large volumes of data and how to find useful or meaningful patterns from a larger volume of data. This leads to knowledge discovery in database, or KDD, which is also called data mining. In other words, we want to dig into the database and discover the meaning or knowledge for decision making. Larose et al. [47] defined the term as “the process of discovering useful patterns and trends in large datasets.” In order to discover meaningful patterns from a massive data set, statistics are the vital tools to add value to data sampling, modeling, analysis, interpretation, and presentation, just as Jiawei Han et al. [48] indicated, “Data mining has an inherent connection with statistics.” This leads to the converging of data mining and fuzzy expert system under the big umbrella of ML. From ML evolution perspective, the statistics theory or probability modeling has shifted AI discipline from rule-based expert systems or schema-on-write learning to a schema-on-read or data-driven methodology, which is to resolve the uncertainty issue with parameters’ probability of a model. From this perspective, the statistics have been embedded into ML. As Witten et al. [49] indicated, “In truth, you should not look for a dividing line between machine learning and statistics because there is a continuum — and a multidimensional one at that — of data analysis techniques.”
Since the 1950s, there have been many functional definitions of ML. Different authors would emphasize different aspects of ML, such as process, application, and utility. For example, Arthur Samuel’s definition emphasized “automatically learning” of ML. Mitchell described every component of ML process [50]. Murphy [51] and Bishop [52], on the other hand, stressed the function of pattern recognition. Nisan and Schocken [53] argued that ML could turn abstract thoughts into a physical operation. In the summary of over 30 definitions, we can find some essential and common ingredients of these ML definitions:
• Train the machine to learn automatically and improve results as it gets more data
• Discover or recognize patterns and intelligence with input data
• Predicate on unknown inputs
• The machine will acquire knowledge directly from data and solve problems
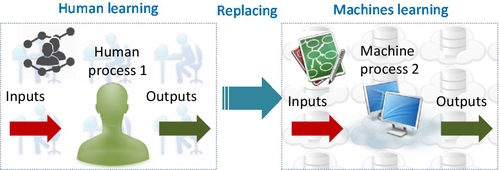
According to these elements, we can find that fundamentally, ML is “an outgrowth of the intersection of computer science and statistics, aims to automatically learn to recognize complex patterns and make intelligent decisions based on existing datasets” [54]. Another way to say that is “Machine learning is turning data into information” [55]. The ultimate goal of ML is to build systems that are of at the level of human competence (see Fig. 8) in performing complex tasks.
ML underpins the BDA implementation. Without ML to mine ever-growing massive data, BDA would be impossible. In conclusion, ML is the centerpiece of any BDA. All other components within a framework of Big Data aim to support ML process. In terms of computational support to BDA, there are four major architectural models that are able to process large amounts of data in a reasonable time, according to Wadkar et al. [56]:
• Massively parallel processing database system: For example, EMC’s Greenplum and IBM’s Netezza
• In-memory database systems, such as Oracle Exalytics, SAP’s HANA, and Spark
• MapReduce processing model and platforms such as Hadoop and Google File System (GFS)
• Bulk Synchronous Parallel (BSP) systems such as Apache HAMA and Giraph
To perform BDA in the most cost-effective way, a fifth model, cloud computing (CC), has become a preferred solution especially for small and media businesses.
1.6 Big Data Analytics and Cloud Computing
CC plays a critical role in the BDA process as it offers subscription-oriented access to computing infrastructure, data, and application services [57]. The original objective of BDA was to leverage commodity hardware to build computing clusters and scale-out the computing capacity for web crawling and indexing system workloads. Due to the massive volume of dataset, searching for lower cost and fault-tolerance computational capacity is an important factor for implementing BDA. On the other hand, the implementation of CC were underpinned with three service models, four deployment models, and five characteristics [58], which is the so-called 3S-4D-5C definition.
◦ Service orientation or 3 S Service models (SaaS, PaaS, and IaaS)
◦ Customized delivery or 4D Deployment models (private, public, community, and hybrid cloud)
◦ Shared infrastructure or 5C characteristics (on-demand, broad network access, resource pool, rapid elasticity, and measured service)
This means that the nature of cloud characteristics makes it the most accessible infrastructure for many small to medium companies to be able to implement BDA.
The cloud does not only enable us to easily scale-out, but also scale down to fit all sizes of dataset. When BDA is discussed, it is quite often that the only focus is how to scale-out. However, it is not necessarily the case. Although the overall data volume may tend to increase, the daily volume for each individual case could be moderate and fluctuating, or Big Data processing requirements needed for BI can vary from time to time. If we can leverage the elastic nature of cloud, we can save a substantial amount of the cost due to amortization benefits provided by the cloud systems. The elastic nature of cloud can reduce the overall cost of computation for different types of Big Data workloads, such as batch, micro-batch, interactive, real-time, and near real-time.
Taking Yahoo sorting one TB data as an example, it took 3.5 minutes over 910 nodes to complete the task in 2008, but it only took 62 seconds over 1460 nodes in 2009. To "scale-out" computational capacity will make a huge difference regardless of an improvement of each node due to technological advances. This implies that cloud infrastructure provides computational flexibility if Big Data workload or business requirements need it. For example, Amazon Web Service (AWS) offers spots instances at a fraction of the regular rate. If the workload only requires batch mode, we can leverage AWS’s spots instances to increase computational capacity and complete the job in a much shorter time.
A popular and open platform that is widely deployed on a cloud infrastructure is Hadoop, whose implementation is inspired by Google MapReduce and GFS.
1.7 Hadoop, HDFS, MapReduce, Spark, and Flink
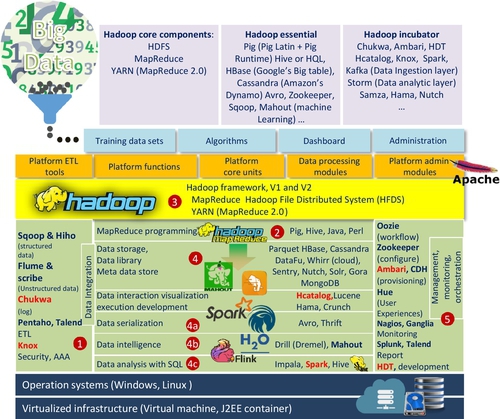
Fig. 9 highlights one of the most popular platforms of BDA, Hadoop. It was the first choice for many analysts and decision makers for implementing BDA. Michael Cafarella, one of the two Hadoop’s founders once remarked, “Nutch (the predecessor of Hadoop) is The National Public Radio (NPR) of search engines” [59]. There are several reasons behind this development:
1. It is an open source platform and also programmed in Java
2. It is linearly scalable and reliable and accepts hardware failure
3. It is a fault-tolerant system
4. It is a practical platform to store and process data amounts greater than tens of TB
5. It leverages a commodity-type of hardware
6. It is “schema-on-read” or has “data agility” character
7. It is best fit for diversified data sources
The basic idea to create Hadoop is driven by both ever-growing data and cost of computational hardware. The objective of Hadoop is to leverage the commodity hardware for large-scale workload processing, which used to be accomplished only by expensive mainframe computers. From an infrastructure perspective, Hadoop enables the computational capacity to be scale-out rather than scale-up. Notice that it is quite often we use both terms interchangeably [60] but based on a standard definition, “scale-up” has a quality improvement sense while “scale-out” implies adding or repeating the same unit horizontally.
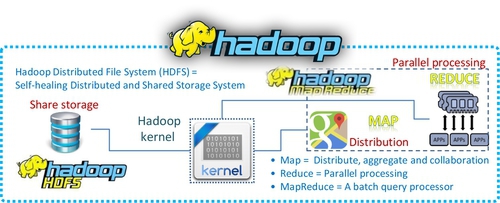
The advantage to adopt Hadoop [60] platform is that “Hadoop is a free and open source distributed storage and computational platform. It was created to allow storing and processing large amounts of data using clusters of commodity hardware.” This statement also describes the basic principle of Hadoop architecture that consists of three essential components (see Fig. 10): HDFS for file storage function, Map for distribute function, and Reduce for parallel processing function.
However, Hadoop’s main disadvantage is that it processes all workloads in batch mode because “Hadoop is a generic processing framework designed to execute queries and other batch read operations on massive datasets that can scale from tens of terabytes to petabytes in size” [61]. This means that the early version of Hadoop cannot handle streaming and interactive workloads. Table 4 summarizes main characteristics of Hadoop.
Table 4
Common Aspects of Hadoop
| Attributes | Characteristics of Hadoop |
| Initiators | Doug Cutting and Michael J. Cafarella |
| Predecessor | Nutch |
| Subsequent version | YARN or Hadoop 2.0 |
| Hadoop written language | Java |
| Philosophy of computation | Divide and conquer for large datasets |
| Principle of computational processing | Bring computer to data rather than bring data to computer |
| System | A distributed programming framework |
| Main characteristics | Accessible, robust, scalable, simple, and fault tolerant |
| Storage-Hadoop distributed file system (HDFS) | Self-healing distributed and shared storage element |
| Initial computational program — MapReduce | Distributed, aggregated, and collaborated parallel processing |
| MapReduce library written language | C++ code |
| Process type | Batch |
| Hardware type | Heterogeneous commodity hardware |
| Software license | Open source |
| Initial applications | IR and searching index and web crawler |
| Solution type | Software solution, not hardware solution |
| Scalability solution | Scale-out, not scale-up |
| Typical size of data set | From a few GBs to a few TBs |
| Capable size of data set | From tens of TBs to a few PBs |
| Simple coherency model | Write once and read many |
| Default replication factor | 3 |
| Typical size of data block for HDFS | 64 MB |
| Permission model | Relaxing POSIXa model |
| Main application modules | Mahout, Hive, Pig, HBase, Sqoop, Flume, Chukwa, Pentaho … |
| Typical vendors | MapR, Cloudera, Hortonworks, IBM, Teradata, Intel, AWS, Pivotal Software, and Microsoft |
a POSIX is the portable operating system interface. Few POSIX rules (permissions model for supporting multiuser environment) have been relaxed in order to gain a higher throughput of data uploads.
The origin of Hadoop can be traced back to Nutch project under Apache Software Foundation (ASF) in 2002 (see Fig. 11). The initial platform was built as an open source implementation of MapReduce [62] processing model and distributed file system [62] proposed by Google. In 2010, Google granted a license to Apache for incorporating the MapReduce model into Hadoop software freely and distributed it without any patent or IP rights infringement concerns.
1.7.1 Google File System (GFS) and HDFS
The Hadoop project adopted GFS architecture and developed HDFS. The original authors (Google’s engineers) laid out four pillars for GFS:
• System architecture
• System assumptions
• System interfaces
The GFS principles departed from the traditional system design dogma that a failure was not allowed and a computation system should be designed to be as reliable as possible. In contrast, GFS anticipates the certain number of system failures with specified redundancy or replicating factor and automatic recovery. In comparison to the traditional file standard, GFS is capable of handling billions of objects, so I/O should be revisited. Moreover, most of files will be altered by appending rather than overwriting. Finally, the GFS flexibility is increased by balancing the benefits between GFS applications and file system API. The GFS architecture consists of three components (see Fig. 12):
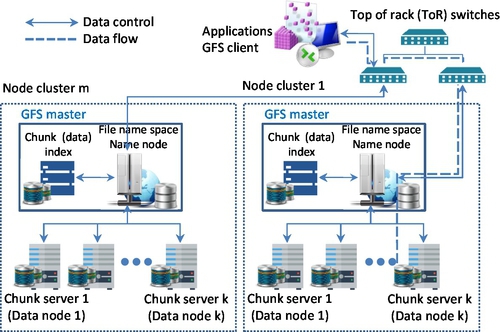
• Single master server (or name node)
• Multiple chunk servers (or data nodes for Hadoop)
• Multiple clients
The master server maintains six types of the GFS metadata, which are: (1) namespace; (2) access control information; (3) mapping from files to chunks (data); (4) current locations of chunks or data; (5) system activities (eg, chunk lease management, garbage collection of orphaned chunks, and chunk migration between chunk servers); (6) master communication of each chunk server in heartbeat messages.
GFS was designed with five basic assumptions, [63] according to its particular application requirements:
1. GFS will anticipate any commodity hardware outages caused by both software and hardware faults. This means that an individual node may be unreliable. This assumption is similar to one of its system design principles
2. GFS accepts a modest number of large files. The quantity of “modest” is few million files. A typical file size is 100 MB/per file. The system also accepts smaller files, but it will not optimize them
3. The typical workload size for stream reading would be from hundreds of KBs to 1 MB, with small random reads for a few KBs in batch mode
4. GFS has its well defined sematic for multiple clients with minimal synchronization overhead
5. A constant high-file storage network bandwidth is more important than low latency
In contrast to other file systems, such as Andrew File System, Serverless File System, or Swift, GFS does not adopt a standard API POSIX permission model rather than relax its rules to support the usual operations to create, delete, open, close, and write.
According to these workload processing assumptions, GFS is actually a file storage system or framework that has two basic data structure: logs (metadata) and sorted string table (SSTable). The main object of having GFS is to implement Google’s data-intensive applications; initially, it was designed to handle the issues of web crawler and a file indexing system under the pressure of accelerating data growing.
The aim for Google publishing these influential papers [63] was to show how to scale-out the file storage system for large distributed data-intensive applications. Doug Cutting and Mike Cafarella leveraged the Google’s GFS idea to develop their file system, Nutch or Nutch Distribute File System (NDFS) for web crawling application, namely Apache Lucene. NDFS was the predecessor of HDFS (see Figs. 13 and 15). Although HDFS is based on a GFS concept and has many similar properties and assumptions as GFS, it is different from GFS in many ways, especially in term of scalability, data mutability, communication protocol, replication strategy, and security.
1.7.2 MapReduce
MapReduce is a programming model used to process large dataset workloads. In contrast to imperative programming (describing computation as a bunch of statements to change program state), MapReduce treats computation as the evaluation of mathematic functions. In essence, functional programming can avoid state and just list in-and-out states.
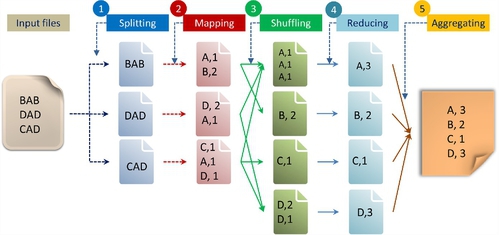
The basic strategy of MapReduce is to divide and conquer. In order to perform different data-intensive applications effectively with MapReduce on the GFS framework, Dean and Ghemawat [62] presented a five-step process or programming model, as shown in Fig. 13.
Lin et al. [64] simplified this process down to three steps: mapping, shuffling, and reducing. As shown in Fig. 13, the first step involves splitting the input file into three files. The second step is to generate a process of a key/value pair by a user (or client) who specifies the function. In the above example, it is to count the number of different letters (A, B, C, and D) with a corresponding quantity within each split file. The first split file contains the letters “BAB.” The letter “A” is counted as 1 and letter “B” is counted as 2. In the third step, the shuffling function is to generate an intermediate key/value pair, which is to sort the same letter (or key) and quantity (or value) from different split files into one file. The fourth step is to merge all intermediate values (3, 2, 1, and 2) associated with the same intermediate key (A, B, C, and D). The final step aggregates these key/value pairs into one output file. Here, “key” is equal to the different types of letters to be counted and “value” is equal to the quantity of each letter.
From a programming perspective, MapReduce has two other meanings; “mapping” is splitting for distribution and “reducing” is shuffling and sorting in parallel. A major advantage of MapReduce is its capability of shared-nothing data processing, which means all mappers can process its data independently.
The characteristic of shared-nothing data processing enables MapReduce to run a simple program across thousands or even millions of unreliable and homogeneous machines in parallel and to complete a task in very short time. Theoretically speaking, it allows any programmer to access an almost unlimited commodity type of computing resources instantly (theoretically) or within an acceptable time frame (practically), eg, cloud infrastructure. Several CC platforms have implemented their own MapReduce processing model such as CouchDB, Cloud MapReduce, and Aneka [57].
According to Dean and Ghemawat [62], the original Google’s MapReduce is potentially capable to handle five types of workloads:
2. Clustering problems for Google News and Google products
3. Extraction of data used to produce reports of popular queries (eg, Google Zeitgeist)
4. Extraction of properties of web pages for new experiments and products (eg, extraction of geographical locations from a large corpus of web pages for localized search)
5. Large-scale graph computations
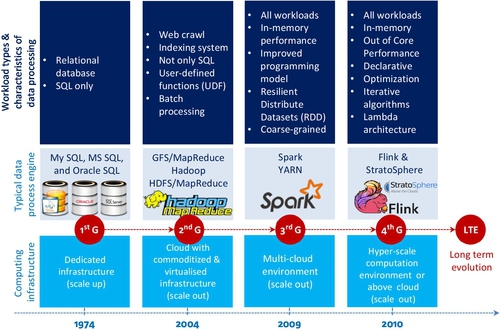
Eric Bieschke echoed this point and indicated, “Hadoop is cost efficient, but more than that, it makes it possible to do super large-scale machine learning” [65]. To this extent, the history of Hadoop is an evolutionary progress to generalize data processing task from a particular workload (eg, web crawler) to all types of ML workloads (see Fig. 14). However, MapReduce is not very efficient in performing an iterative and recursive process that is widely utilized for a simulation type of workload in ML. In order to understand the issue, it is necessary to see how the Hadoop project has been evolved.
1.7.3 The Origin of the Hadoop Project
Lucene
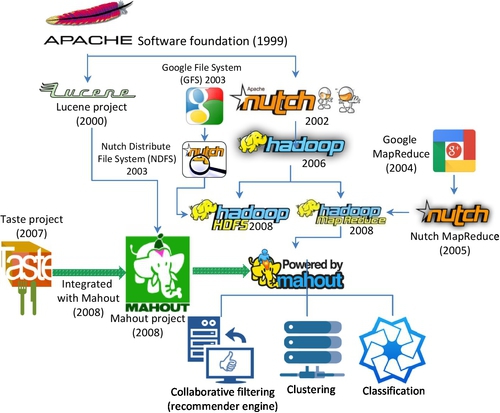
According to Hatcher and Gospodnetic [59], Lucene is a high-performance scalable information retrieval (IR) library. It lets developers add indexing and searching capabilities to their applications. Lucene was a mature, free, open source project implemented in Java. It is a member of the popular Apache Jakarta family of projects, licensed under the liberal Apache Software License (see Fig. 15). Lucene was written by Doug Cutting in 2000 in Java. In Sep. 2001, Lucene was absorbed by ASF.
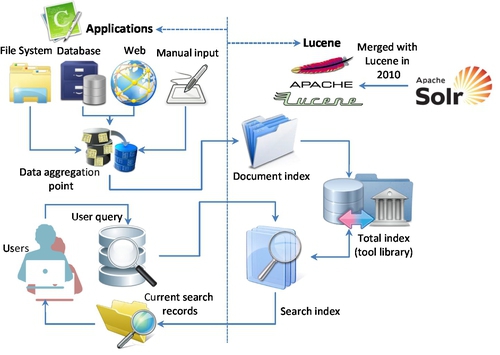
However, Lucene is not an application or search engine rather it is a toolbox or searching tool kit that enables many applications to borrow or use it. It serves as a classification index. It converts any data to a textual format and enables them to be searchable. Its powerful searching capability is beneficial to many third parties. At the heart of Lucene IR library is its searching and indexing capability. In order to utilize Lucene’s searching and indexing functions, another open source software, Nutch, is required, which was also built by Doug Cutting in 2002 (see Fig. 14).
Nutch
Nutch is the predecessor of Hadoop, which is an open source and executable search engine file system. There are two main reasons to develop Nutch:
• Create a Lucene index (web crawler)
• Assist developers to make queries of their index
There are a lot of codes in Nutch program (such as HTTP fetcher and URL database). Michael J. Cafarella indicated that the text searching was the centerpiece of any search engine or web crawler, which was included in Nutch.
Based on Laliwala and Shaikh [66], another Apache project called Solr was developing with similar searching function to Nutch. It was also an open source enterprise platform for full text search, which was initiated by CNET in 2004. It became an Apache project in 2007. Since then, Solr has absorbed many tools in Apache Lucene’s library to enhance and extend its full text search capability. Like Apache Lucene, Solr was not an executable search engine rather than a toolkit or IR library [67]. Therefore, Solr and Lucene had been merged into a single development project since 2010 [68]. As shown in Fig. 15, although both Lucene and Solr had adopted many different techniques for index searching, text mining, and IR algorithms, they can be generalized as classification algorithms.
In general, BDA applications need different algorithms or techniques, such as clustering, collaborative filtering (or recommender engine), and others. These requirements lead to the beginning of Mahout Project in 2008 as a subproject of Apache Lucene. Since all the algorithms of both Lucene and Mahout are closely related to machine learning, In Apr. 2010, Mahout has risen as a top-level project in its own right.
Mahout
The original object of Mahout was to build a Java-based ML library that covers all ML algorithms or techniques in theory, but it can mainly handle three types of ML algorithms in practice:
• Collaborative filtering (recommender engines)
• Clustering
• Classification
If other learning algorithms are required, we have to check the Apache Mahout URL [69] and find out whether MapReduce can support a particular algorithm or not before this algorithm can be applied in a large scalable environment. In other words, Mahout is not a universal ML library. In addition of scalable issue, Hadoop is very slow for ML workloads. It led to the development of complimentary ecosystems, such as Hama, Storm, Spark, and Flink that addressed weakness of MapReduce-based systems.
1.7.4 Spark and Spark Stack
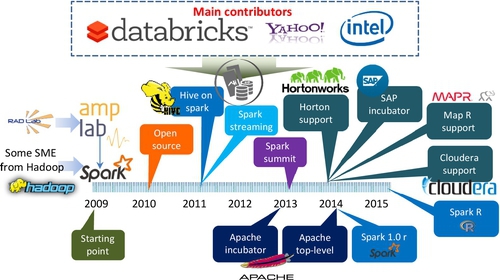
Spark was developed by the UC Berkeley RAD Lab (now called as AMP Lab). The main contributor is Matei Zaharia et al. [70,71]. Its original objective was to extend Hadoop to a general-purpose framework that adopts resilient distributed datasets (RDDs) in memory computation (micro batch) technique. In a simple terms, it intends to replace a MapReduce model with a better solution. It emphasizes the computational efficiency of iterative and recursive algorithms and interactive queries of data mining. It claimed that it would be 10–20 times faster than MapReduce for certain type of workload, such as performing iterative algorithm.
Although it attempts to replace MapReduce, it did not abandon HDFS; instead, it leverages Hadoop’s file storage system. Like many other Hadoop related projects, it is an open source project under ASF. In June 2013, it was moved to ASF as an incubator. Since 2014, it has become an Apache top-level project and supported by many Big Data vendors, such as Cloudera, Horton, SAP, and MapR, as noted in Fig. 16.
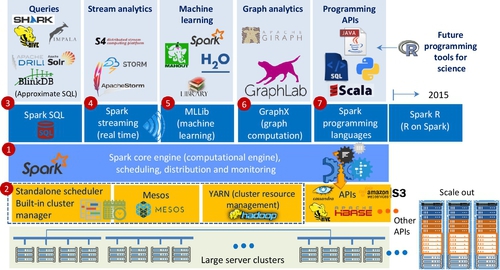
Generally, Spark is a fast- and general-purpose computation platform based on large clusters. In contrast to MapReduce that is basically designed for a web crawler, indexing system, and limited ML, Spark includes SQL, interactive query, data stream, graph, and ML analytic functions in its computation platform.
Based on the Berkeley data analytics stack architecture, Spark developed as a unified stack integrating all libraries and higher level components together (see Fig. 17). Spark consists of seven major elements: Spark core of data engine, Spark cluster manager (includes Hadoop, Apache Mesos, and built-in Standalone cluster manger), Spark SQL, Spark streaming, Spark Machine Learning Library, Spark GraphX, and Spark programming tools.
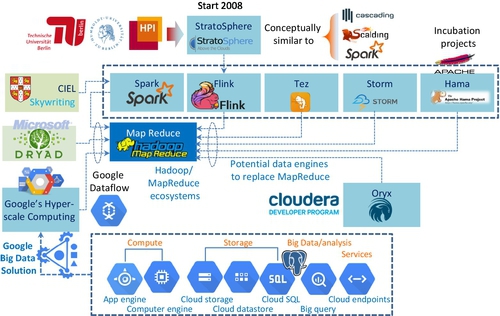
1.7.5 Flink and Other Data Process Engines
Apart from Spark, there are several data processing engines such as Microsoft Dryad, Storm, Tez, Flink, and CIEL (see Fig. 18) that are capable of supporting MapReduce-like processing requirements. They aim to support more computational functions, such as standard queries, stream analysis, machine learning, graphic analysis, and interactive or ad hoc queries efficiently. The effort made by these platforms is to generalize Hadoop to be able to support a wide variety of BDA workloads.
Ewen et al. [72], Tzoumas [73], and Balassi and Fora [74] argued that Flink is the next generation or the 4th generation data processing engine in comparison with others (see Table 5 and Fig. 19), although each data processing engine has its own special feature. Flink data engine is truly a general-purpose framework for BDA. They claim that Flink is capable of outperforming Spark by 2.5 times.
Table 5
Data Processing Engine Comparison


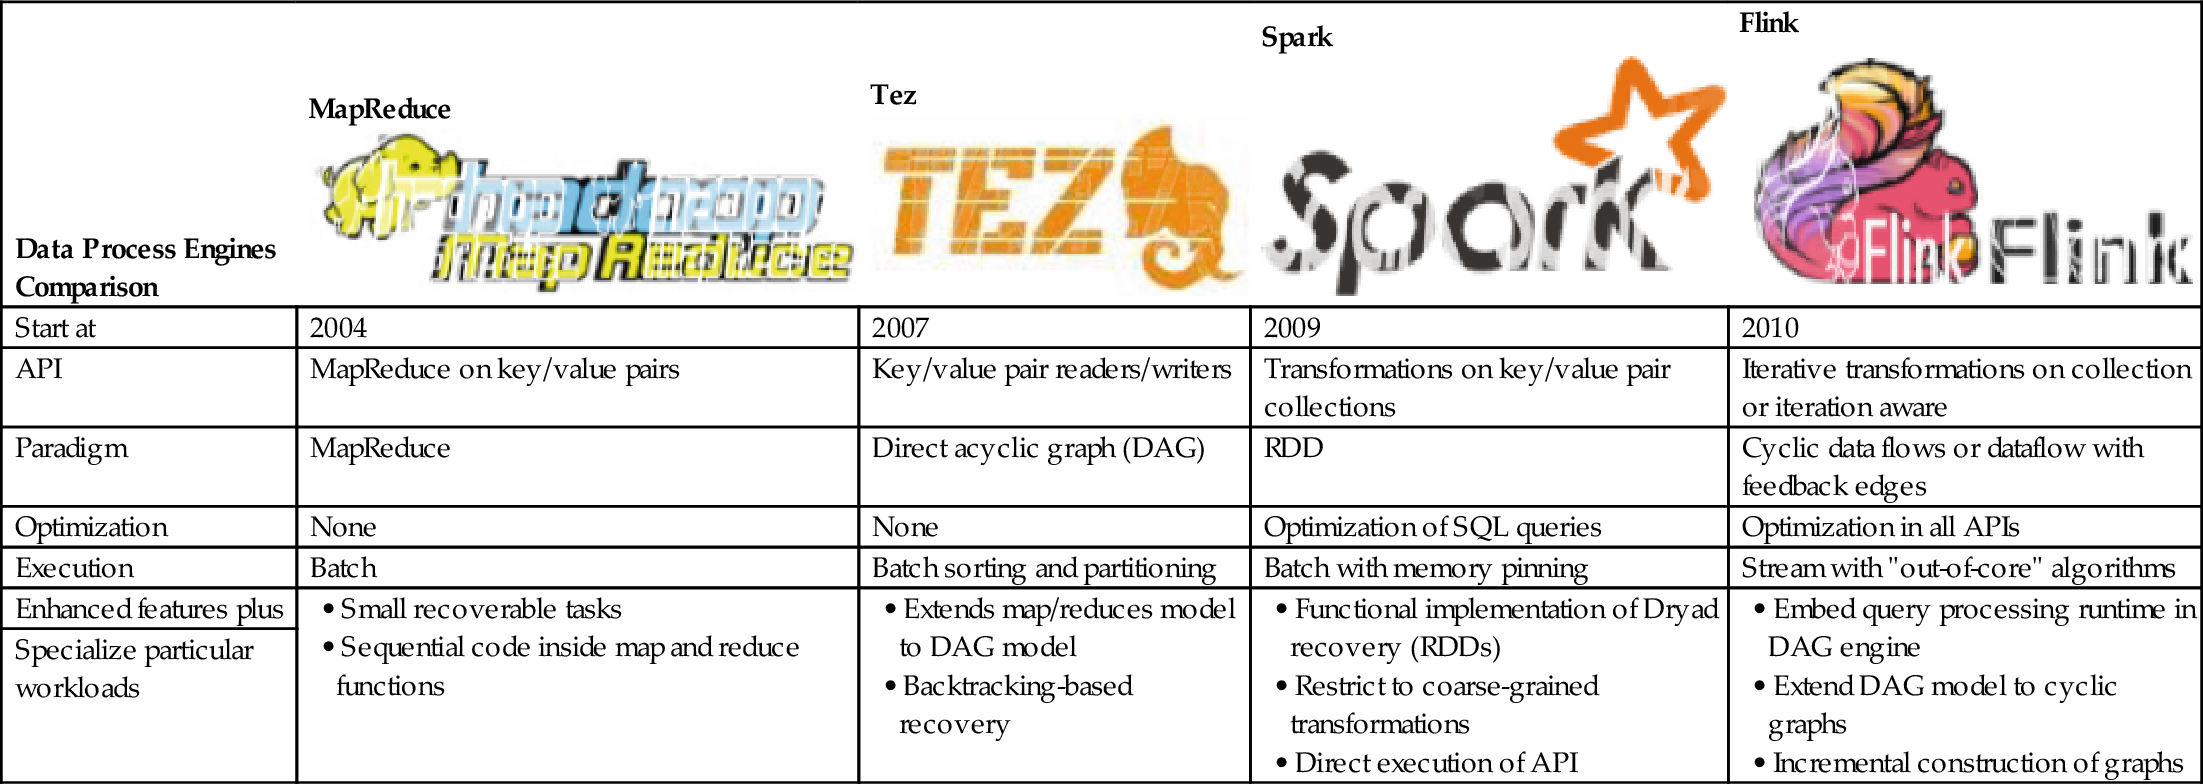
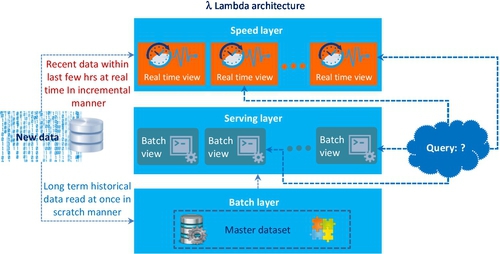
A possible reason for Ewen et al. to claim that Flink is better than Spark is that it is based on Lambda architecture and able to process arbitrary Big Data workloads in real time. The basic concept of Lambda architecture is to build the data processing engine or system with the number of layers in order to deal with a subset of data with stream properties. These layers are only a few thousand line of code to implement a total of seven steps (two for the batch layer, two for the serving layer, and three for speed layers; see Figs. 20 and 21).
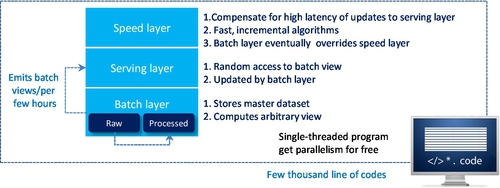
The purpose for establishing these three layers, according to Nathan Marz [75], is to meet the characteristic requirements of all types of Big Data workloads. They are:
• Robustness and fault tolerance
• Low-latency reads and updates
• Scalability
• Generalization
• Extensibility
• Ad hoc queries
• Minimal maintenance
• Debuggability
Fig. 22 shows that the batch layer as a part of Hadoop can easily meet robustness and fault tolerance requirements. Scalability is the requirement for both batch and serving layers so that both Hadoop and Elephant DB can handle it. Extensibility means the data stream adds a new function to the master dataset. The batch layer allows users to recompute another entire batch view from scratch. To some extent, this also means that a batch layer can perform ad hoc queries because the master dataset in one location. Due to the robustness nature of Hadoop minimal maintenance is acceptable. The reason for robustness is because a serving layer database only gets a batch view per few hours, which emits from the batch layer. In other words, it doesn’t write randomly very often and has so few moving parts. Subsequently, it is less likely to have something go wrong.
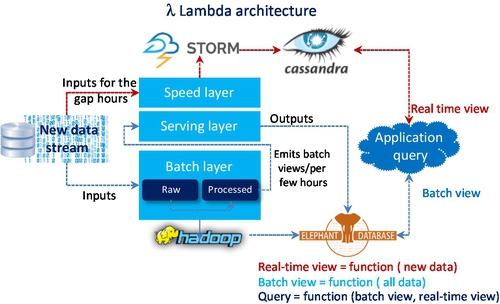
The combination of both batch and serving layers can record all intermediate steps of outputs (serving layer) and inputs (batch layer — master dataset) for data process. Therefore, if the process has any hiccup, the debug analysis is quite easier.
The top element of the Lambda architecture is the speed layer. The purpose of having speed layer is to perform an arbitrary computing function on arbitrary data in real time, which is to fill the gap time of new data for both batch and serving layers that have been left. In contrast to the batch layer, the speed layer only checks the latest data, while the batch layer covers all the data in one batch. Moreover, it only does so in an incremental manner rather than in doing a re-computation from scratch manner that the batch layer does. The speed layer capability meets the Big Data requirements for low-latency reads and updates.
The overall Big Data query is the combination of real-time and batch views, as noted in Fig. 22, which shows an example query processing system based on Lambda architecture. In contrast to MapReduce (batch only), the Lambda architecture can meet all requirements of Big Data query, whether it is in batch or real time.
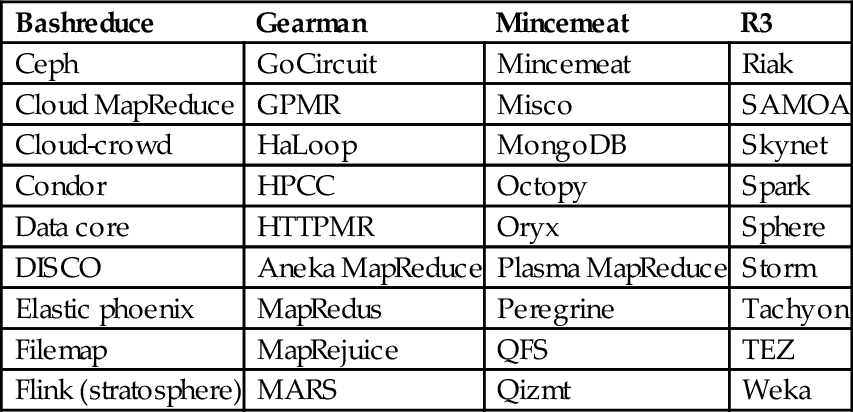
In addition to Flink and Spark, more than 40 processing engines are available, which are capable of processing different types of BDA workloads (see Table 6).
Table 6
40 Alternative Platforms for Big Data Processing
| Bashreduce | Gearman | Mincemeat | R3 |
| Ceph | GoCircuit | Mincemeat | Riak |
| Cloud MapReduce | GPMR | Misco | SAMOA |
| Cloud-crowd | HaLoop | MongoDB | Skynet |
| Condor | HPCC | Octopy | Spark |
| Data core | HTTPMR | Oryx | Sphere |
| DISCO | Aneka MapReduce | Plasma MapReduce | Storm |
| Elastic phoenix | MapRedus | Peregrine | Tachyon |
| Filemap | MapRejuice | QFS | TEZ |
| Flink (stratosphere) | MARS | Qizmt | Weka |
1.7.6 Summary of Hadoop and Its Ecosystems
Hadoop has become the standard framework to run distributed BDA that can process massive scale of data on large clusters based on the commodity hardware or a cloud infrastructure. Along with its evolutionary journey, it has absorbed and integrated some Apache projects that have similar functionalities, such as Taste, Solr, and Mahout. Due to the demand for processing all types of BDA workloads, many of Hadoop’s ecosystems have been developed, such as Spark, Storm, Hama, Tachyon, TEZ, S4, and Flink. These ecosystems intend to overcome MapReduce’s shortcomings and specialize in a particular type of BDA workload. Consequently, some platforms have been generalized to handle all types of BDA workloads.
Hadoop key functions
When Douglas Cutting and Michael J. Cafarella created it in early 2006, their original idea was to build Apache Nutch (or a web crawler engine) on a cheaper infrastructure. It consists of five key functional components (see Fig. 5):
1. ETL tools for data integration
2. Functional element or programming model: MapReduce
3. Core units: distributed framework or storage system
4. Processing modules or libraries: machine learning
5. Administration models
In comparison to many other conventional databases, Hadoop is not a database but a distributed storage and computational framework. It is a free and open source ecosystem. It has six characteristics:
1. Scale-out with distributed computing
2. Expect failures with redundancies
3. Focus on smart software rather than dumb hardware
4. Share-nothing architecture
5. Move processors not data (taking computer to data, rather than other way around)
6. Build applications, not infrastructure
Hadoop’s distinguishing features
One of Hadoop’s unique features is that it is supported by so many auxiliary tools, especially administration tools such as monitoring, management, and maintenance (see Fig. 9). It also has many APIs to interface with other BDA applications. Many ASF incubation projects (such as Spark and Flink) can replace MapReduce, but it would be too costly to substitute the entire Hadoop framework.
1.8 ML + CC → BDA and Guidelines
We discussed the role of ML, CC, and Hadoop-like systems. We see that ML and CC are the two most important components of BDA. If there are no advances in ML and CC, BDA could not be implemented or operated cost effectively. Of course, BDA needs a good understanding of application domain. Effective BDA needs an appropriate choice of ML techniques and the use of CC to handle Big Data sets for both training and extracting new meaningful data patterns. CC can provide an affordable solution for many individuals and small- to medium-scale enterprises. Therefore, we assert that ML + CC → BDA. Hadoop’s history and its ecosystems with machine learning applications have demonstrated this concept adequately.
Finally, BDA is not an ideal solution for every analytics problem. For some cases, it may only add the burden to the business. Table 7 provides guidelines to decide which cases could be applied for BDA solutions and which ones would not benefit from BDA. These guidelines help in determining the case for BDA.
Table 7
Guidelines for BDA
| 3 Aspects | 9Vs | Fit for BDA | Not Fit for BDA |
| Data | Volume |
• Datasets do not fit into one node (eg, PB–EB size datasets) • Bringing computing to the data |
• Dataset can be fit into one node • Bringing data to the computing node |
| Variety |
• Collection and discovery of datasets from different data sources (eg, M2M, WSN, RFID, SCADA, SQL, and NoSQL) • Schemaa on read |
• One type workload (RDBMS or SQL) • Single data source • Schema on write | |
| Velocity |
• Interactive and dynamic data stream |
• Traditional stable environment • Static dataset | |
| Statistics | Veracity |
• Models construction need many “What-ifs” for fidelity issues • Rely on archived data for reliability and credibility |
• Model construction is relatively simple • Require live data |
| Variability |
• Dynamic or flexible schemas • Numerous variables of dataset (eg, > 50 variables) |
• Fixed schema • Few variables of dataset | |
| Validity |
• Require independent and transparent criteria to verify the result of BDA (eg, GFT) |
• Simple and straightforward approach to verify the result of data mining | |
| Business Intelligence | Value |
• Solving strategic problems that have long-term consequences (eg, competitive advantages, integrity, excellence, sustainability, success, and cost leadership) • Leveraging business values from all data sources |
• Routine issues for a short term • Exploring business value from single source |
| Verdict | |||
| Visibility | |||
| Other Aspects |
• Large-scale computing needing high fault tolerance • Scale-out • High percentage of parallel and distributed processing workload |
• Fault tolerance may not be essential • Scale-up • Percentage of serial processing workloads is higher |
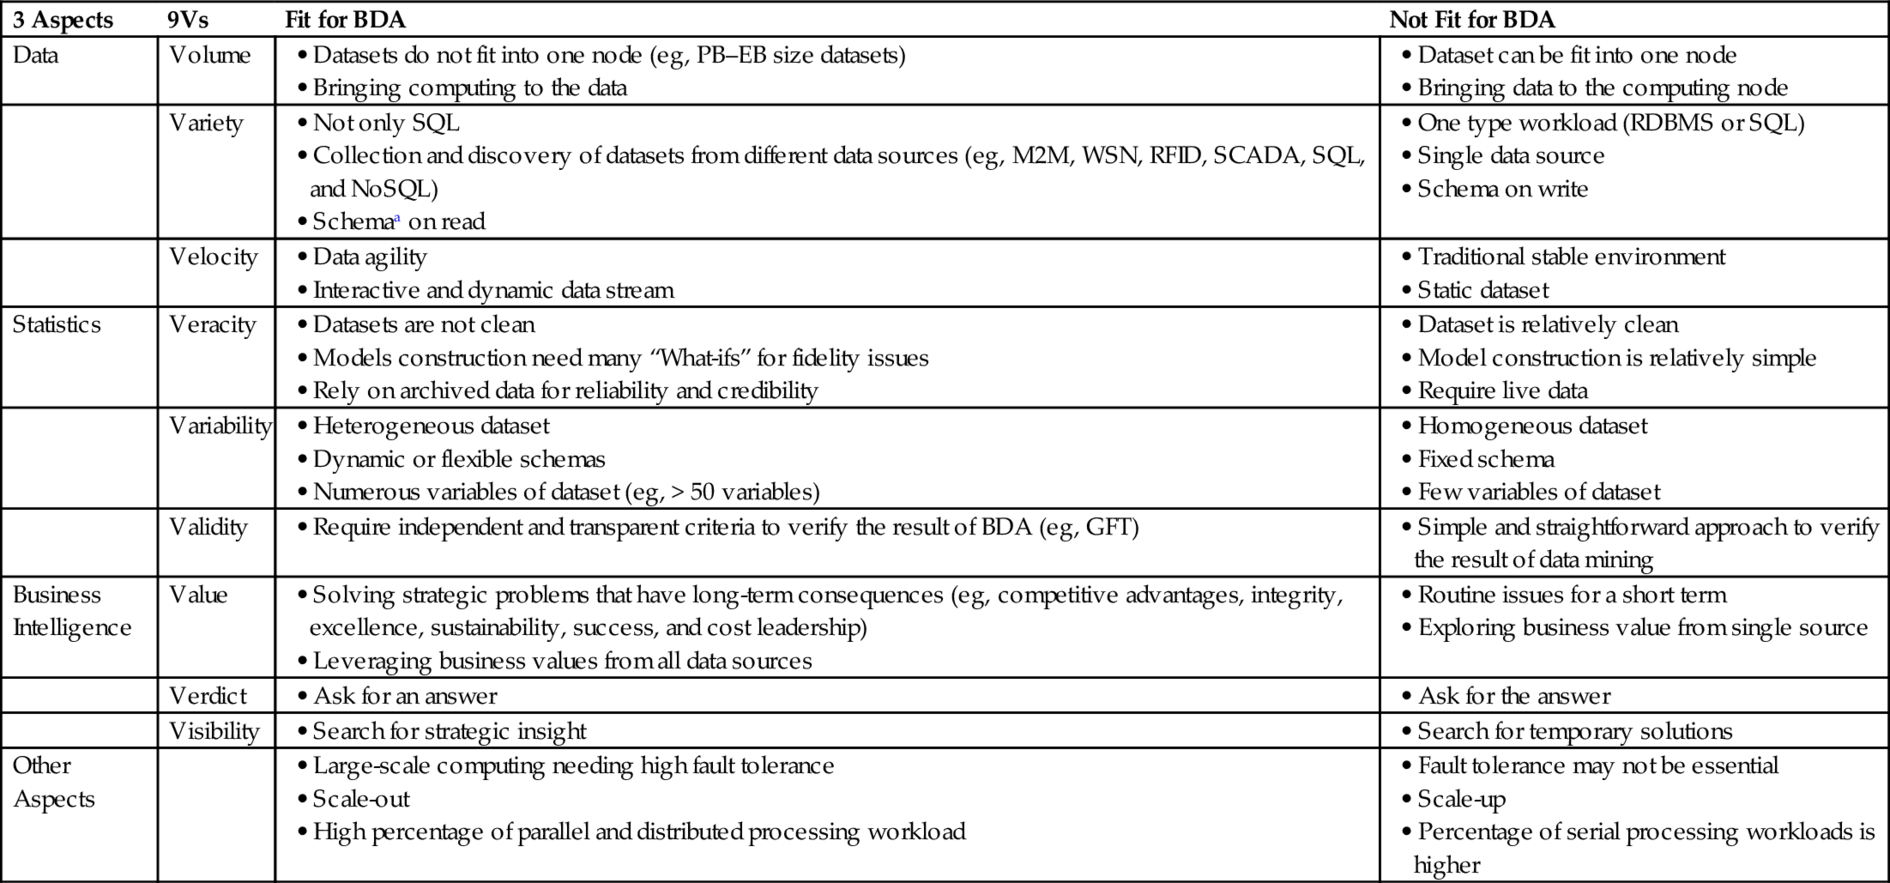
a “Schema-on-Read” means a table or a set of statements is not predefined. Sometime it is also named as “Schemaless” or “Schema free.” In contrast, “Schema-on-Write” means that a table is predetermined. Sometime, it is also called as “fixed schema” [76–78].
1.9 Conclusion
We have discussed many major events and debates in Big Data and introduced the original concept of Big Data and its 3Vs attributes. We proposed an extension to this view of Big Data from 3Vs to 32Vs (9 Vs) to capture the full meaning of BDA to include additional attributes of BI and statistics aspects (see Fig. 23). We provided an overview of many popular platforms for BDA such as Hadoop, Spark, and Flink that are affordable to small- and medium-scale enterprises. We have developed the notion that ML + CC → BDA; that is, the execution of ML tasks on large data sets in CC environments that is often called BDA.