Real-Time Analytics
Z. Milosevic; W. Chen; A. Berry; F.A. Rabhi
Abstract
Real-time analytics is a special kind of Big Data analytics in which data elements are required to be processed and analyzed as they arrive in real time. It is important in situations where real-time processing and analysis can deliver important insights and yield business value. This chapter provides an overview of current processing and analytics platforms needed to support such analysis, as well as analytics techniques that can be applied in such environments. The chapter looks beyond traditional event processing system technology to consider a broader big data context that involves “data at rest” platforms and solutions. The chapter includes a case study showing the use of EventSwarm complex event processing engine for a class of analytics problems in finance. The chapter concludes with several research challenges, such as the need for new approaches and algorithms required to support real-time data filtering, data exploration, statistical data analysis, and machine learning.
Keywords
Real-time analytics; Complex event processing; Streaming; Event processing; Advanced analytics; Data analysis; Machine learning; Finance; EventSwarm
2.1 Introduction
This chapter focuses on real-time analytics and in particular, relevant analytics approaches, ie, the velocity aspects of Big Data. Real-time analytics is increasingly gaining prominence in business and social applications as a result of the need to deal with the proliferation of data and the need to act instantly in response to data triggers. A recent Harvard Business Review article refers to such data as “Fast Data” and states that “… large enterprises have spent heavily on managing large volumes and disparate varieties of data for analytical purposes, but they have devoted far less to managing high velocity data” [1]. This is in spite of the fact that data volumes are expected to double every 2 years, with the greatest growth coming from the vast amounts of new data being produced by intelligent devices and the Internet of Things. “That’s a problem, because high velocity data provides the basis for real-time interaction and often serves as an early-warning system for potential problems and systemic malfunctions” [1].
It should be noted that many of the requirements, principles, characteristics, and solutions associated with real-time analytics have a foundation in the distributed computing infrastructure, event processing, and machine learning, as well as in real-time applications from the pre-Internet era. The key differences are in the growing audience for data insights, increasing use of cloud computing and commodity infrastructure, and the proliferation of new data sources, such as social media and mobile devices. This is in contrast to the early distributed systems applications, which were developed using high-end proprietary computing infrastructures and intended for limited audience, eg, subject matter experts, engineers, and other professionals in specific industry sectors. Further, data is increasingly arriving continuously in so-called data streams or event streams. This introduces computational and resource challenges in processing such data in a real-time fashion, and in particular when looking for new insights through applying various statistical techniques.
This chapter describes the new real-time infrastructure, tools, and analytics techniques while also positioning them in relation to current stored-data analytics and the event-driven architectures and complex event processing (CEP) technologies of the last decade.
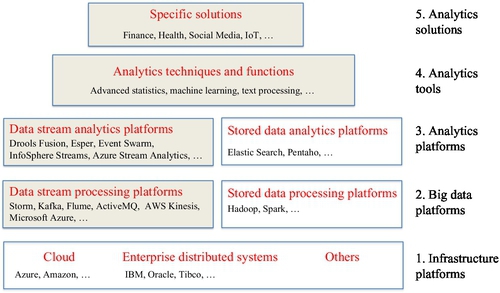
The chapter is structured as follows. The next section introduces a hierarchy of abstractions for Big Data and analytics, which we refer to as the analytics stack for Big Data (see Fig. 1). This stack was developed to position real-time analytics and facilitate discussion on various analytics concepts, technologies, and principles described in this chapter; later sections of this chapter are structured according to the stack.
The subsequent section highlights key characteristics of real-time systems considered from the standpoint of Big Data, while outlining their roots in early distributed system developments and related industrial applications. This section sets a scene for the solutions and challenges to be discussed in the remaining sections. Following that, the chapter describes key concepts and platforms used when designing and implementing real-time systems and analytics solutions, with a particular focus on the event-driven technologies. This is followed by the description of real-time data processing platforms for Big Data environments (or “fast data” systems), which we refer to as data stream processing platforms, including a number of open source platforms and proprietary solutions. The subsequent section describes analytics solutions that can apply analytics techniques to the real-time data streams, and we refer to these as data stream analytics platforms. The key analytics techniques and functions support development of specific analytics solutions on top of these platforms, and these are described in the following section.
Finally, we describe an example application in the finance domain that is built upon one of the analytics platforms and associated techniques and tools. The chapter concludes with a list of interesting research topics we have identified based on our industrial and academic experience.
2.2 Computing Abstractions for Real-Time Analytics
This section introduces a hierarchy of abstractions for building analytics solutions, including real-time analytics solutions. These abstractions were developed to facilitate the description of different capabilities and features of analytics solutions, as well as to position real-time analytics in the broader spectrum of analytics platforms and solutions. We refer to these layers informally as the analytics stack. Fig. 1 depicts these abstractions.
Note that the real-time analytics topics in the stack are distinguished in the figure as grayed boxes. The other topics are included for completeness and positioning, but are not discussed in any more detail beyond this section.
The bottom layer reflects infrastructure platforms needed to provide computing resources over which analytics systems are built. These include traditional enterprise distributed system components provided by vendors such as IBM, Oracle, and Tibco, cloud PaaS offerings of these companies, as well as other companies such as Amazon and Microsoft Azure. There are also other infrastructure platforms for building real-time systems, such as for industrial applications in utility, mining, and transportation industries.
The second layer identifies Big Data platforms developed for processing huge amounts of data, including both data at rest and data in motion (ie, “fast data”). These are software platforms that are built using the underlying resources provided by infrastructure platforms. We distinguish the stored data processing platforms such as Hadoop, Spark, distributed file systems, and NoSQL databases [2] from the data stream processing platforms, which provide a basis for real-time analytics and will be described in the later sections of this chapter.
One special kind of Big Data processing is in support of analytics applications. A number of analytics platforms were developed in recent times to support such applications. These are software platforms that make use of the components and functions provided by Big Data platforms. As with the Big Data platforms, we distinguish them based on their ability to process “data at rest” versus “data in motion,” namely stored data analytics platforms, such as ElasticSearch [3] and Pentaho [4], and data stream analytics platforms. The data stream analytics platforms are described in more detail later in this chapter.
The next layer is termed analytics techniques and tools. This layer can be regarded as a library of methods for developing analytics solutions for specific business problems. Examples include various advanced statistics, machine learning, and text processing algorithms and models. Note that the implementation of these methods is left to the specific requirements of the layer below, ie, whether it is real-time data or stored data layers.
It should be noted that many technologies and solutions can be difficult to position at one layer only. For example, Microsoft Azure and Amazon provide components in most of these layers.
2.3 Characteristics of Real-Time Systems
The term real-time system signifies the requirement for IT systems to process events as they occur and within a specified time interval. This time interval is typically in order of milli-, micro-, or even nanoseconds, depending on the system in question. Real-time systems are often said to be the systems in which timeliness is essential to correctness [5]. While this statement is true for safety critical systems, in the context of Big Data analytics, this requirement is somewhat relaxed and real time refers to the ability to process data as it arrives, rather than storing the data and retrieving it at some point in the future. In this chapter, the terms real time and real-time analytics imply this more relaxed requirement, which some refer to as near real time.
In either case, this real-time property requires the collection of data associated with various data sources and processing them as they arrive. It often involves generating notifications to humans about significant occurrences in the environment, invoking functions of the system’s components to perform some tasks, or sometimes both.
In the pre-Internet era, many real-time IT systems were developed for monitoring and controlling industrial plants. They include real-time operating systems, embedded systems that control operations of a specific component within a larger electrical/mechanical system, and programmable logical controllers that control operations of electromechanical processes, eg, factory assembly lines. They also included large supervisory control and data acquisition systems [6] that typically collect real-time data from an industrial plant, present information to operators, and react to significant events, including generating alerts or performing some automatic control functions in response to events. There have been also many other real-time systems specifically developed for time-sensitive applications in industries such as finance, telecommunication, aviation, transportation, space exploration, and so on.
Many of these early real-time systems have required the development of a foundational distributed computing infrastructure, leveraging the power of the telecommunication network capabilities at the time. The distributed computing systems, although providing many benefits, required solutions to many difficult problems such as true concurrency (vs. interleaved), partial state, unreliable communication media, prolonged and variable transmission delays, possibility of independent partial system failures, and so on. These difficulties in turn led to many innovations in the field of distributed computing, including the development of key distributed systems principles, techniques, and algorithms. Examples include various solutions for dealing with different types of failure models, unreliable communications, synchrony in the presence of unreliable computer clocks, etc. Many of these distributed solutions provide foundations for the understanding of requirements in the new generation of real-time systems of the Internet era and in particular for Big Data and analytics.
Some key requirements are discussed in the following subsections, based on an excellent overview provided in [7].
2.3.1 Low Latency
In general, latency can be defined as the time delay between the cause and the effect of some physical change in the system being observed.
In a real-time system, latency refers to the time between an event occurring in an environment of the system and the start of its processing in the system. This latency typically involves network latency and computer processing latency.
Real-time systems require low latency in order to respond to the events within specified time bounds.
A number of strategies can be adopted to support these requirements in analytics. These include:
• In-memory processing — needed to minimize processing delay associated with the use of disks and I/O; this is increasingly viable due to the decreasing cost of memory
• Use of flash technology to store all data that does not need to be in main memory; this approach increase access speed to data
• Incremental evaluation, that is, updating calculations and query results for each new data item without reevaluating the entire data set
• Parallel processing with high bandwidth connection between processors
• Anticipatory fetching and processing, enabling faster access to data from multiple data streams
2.3.2 High Availability
Availability means the ability of a system to perform its function when required.
Real-time systems require high availability; otherwise the events arriving from the outside world are not immediately processed and are difficult to store or buffer for subsequent processing, especially with high volume/high velocity data streams.
In order to support this requirement, a number of strategies can be adopted to support enable effective analytics. These include:
• Distribute processing to multiple nodes so that if one machine fails, another can take over
• Replication of data to several servers, so that of one machine fails, the data can still exist on another machine
• Redundant processing of data; that is, having more than one node calculating a result for a data set (which implies both of the above)
2.3.3 Horizontal Scalability
This characteristic refers to the ability to add servers to an existing pool to improve performance or increase capacity. The ability to dynamically add new servers as data volume or processing workload requires is of high importance for real-time systems to ensure that data is processed within specified time intervals.
Horizontal scalability is especially important if one cannot control the rate of data ingress. If a system is consuming a known, fixed-volume feed, then it can be sized to ensure that real-time requirements are met.
Note that horizontal scalability is to be contrasted to vertical scalability, which refers to the ability to add resources to a single server to improve performance and capacity [7].
2.4 Real-Time Processing for Big Data — Concepts and Platforms
This section provides an outline of concepts and techniques for architecting and designing real-time systems in a Big Data environment, as well as for building analytics applications on top of it. It begins by describing the concept of event, event processing, and streams, which are central concepts to many real-time analytics applications today. These concepts will be used in describing key features of several Big Data processing platforms and analytics approaches.
2.4.1 Event
Many recent modeling and implementation approaches for developing real-time applications are centered around the concept of an event. An event signifies some occurrence in the system’s environment. This naturally reflects the nature of many real-time applications, where event-driven computing can provide a more timely response and better throughput while leveraging availability and scalability properties of the underlying distributed infrastructure. For example, many real-time applications involve (often distributed) sensors that detect and report events, which in turn need to be analyzed in real time to detect patterns that signify some opportunity or threat. Other real-time applications need to monitor events capturing actions of users and detect patterns of interest associated with their activities and subsequently record this information or generate alerts. Some other applications need to distribute the data associated with external events for processing on multiple computers to allow computations to be performed in parallel and thus improve the performance of the applications.
2.4.2 Event Processing
Event processing is computing that performs operations on events as they are reported in a system that observes or listens to the events from the environment. Common information processing operations include reading, creating, transforming, and processing events [8].
Event processing has its origins in active database systems [9], distributed event-based systems [10], and simulation work, such as the Stanford Rapide project. Luckham [11] and Bacon et al. [12] pioneered research into event processing in the 1990s. The former mainly focused on simulation and pattern matching, whereas the latter focused on the construction of distributed applications using event-driven approaches.
Many event processing applications are built to react to events from the environment, and the design of such applications follows the principles of event-driven architecture. Note that these applications might not need to deal with temporal properties of events, whether of single events or between multiple events, even if data associated with an event carries a timestamp. In fact, many event-driven applications merely need to perform some computation or action in response to an event. In this case, we are talking about event-based programming or event-driven architectures [8].
2.4.3 Event Stream Processing and Data Stream Processing
Many real-time applications involve a continuous flow of information that is transferred from one location to another over an extended period of time [13]. This type of interaction is called a stream and it implies the transfer of a sequence of related information; for example, video and audio data. It is also used frequently to describe a sequence of data associated with real-world events, eg, as emitted by sensors, devices, or other applications, such as a stock ticker.
Processing these kinds of events is thus referred to as event stream processing or data stream processing. The latter is taken to mean processing over data carried in the stream of events, essentially with the same meaning as event stream processing. Note also that some earlier references, mainly coming from database applications and data stream applications focus on filtering and aggregation of a stream data using SQL queries.
Note that in principle, one can model any discrete data flow (ie, where individual data elements are distinguished in time and space) using events, and that all digital data streams are, in essence, discrete. Note also that event stream processing typically refers to processing of a single stream, which is a simplified form of CEP, as described in the following section.
2.4.4 Complex Event Processing
Some more CEP applications need to perform complex computations over multiple events coming from the same or different sources in the environment. This is required when the combination of events and their relationships have some meaning beyond the discrete events alone. These relationships can be of any type, including causal relationships, data relationships, or temporal dependences (ie, before or after relationship). This kind of event processing is often referred to as CEP [14]. In practice, the terms event stream processing and CEP are often used interchangeably [15], and considering that the same is often the case between event stream and data stream processing, we will use these concepts interchangeably, with the same meaning apply to all three concepts.
CEP provides abstractions (event processing logic) for operations on events that are separated from the application logic (event producers and event consumers). This can reduce the cost of development and maintenance. Event processing logic is often expressed in domain specific languages that we refer to as event processing languages (EPLs).
Large enterprise vendors (IBM, Tibco, and Oracle in particular) have developed or acquired several enterprise scale CEP systems, eg, InfoSphere Streams [16], Tibco Stream Base [17], and Oracle Stream Explorer [18]. These systems have influenced the development of a number of recent data stream processing and analytics platforms, which will be described in the next two sections.
2.4.5 Event Type
An event processing system (EPS) thus needs a definition of an event type, which describes properties of events occurring in the environment for the purpose of the processing of data associated with events arriving from the environment. Typical attributes of an event type are the timestamp when it has occurred and various data types associated with event payload, such as data format of a message emitted by a physical sensor or data format associated with a messaging system, such as HL7 messages, SWIFT messages, and so on.
2.4.6 Event Pattern
An event pattern is one of the key concepts used in many advanced real-time analytics approaches, particularly CEP systems. It captures relationships between events in the real world. There are many examples of event patterns that can signify some opportunity or threat, eg, unusual money deposits by one person in a number of banks, of interest to antimoney laundering applications; unusual pathology orders in eHealth systems, or some causal relationships between rise or falls of trades of one stock on the market, preceded or followed by social media postings about the stock.
As with an event type, an EPS needs a description of an event pattern type so that the system can detect the occurrence of event patterns in the environment.
2.5 Data Stream Processing Platforms
This section describes the most recent and prominent data stream processing platforms. Many of these are open source solutions. These platforms facilitate the construction of real-time applications, in particular message-oriented or event-driven applications which support ingress of messages or events at a very high rate, transfer to subsequent processing, and generation of alerts. These platforms are mostly focused on supporting event-driven data flow through nodes in a distributed system or within a cloud infrastructure platform. They provide a basis for building an analytics layer on top, such as many abstractions typical to CEP.
The section first provides a brief description of stored data processing platforms to facilitate positioning of several specific data stream processing platforms, which will be described in subsequent sections.
The Hadoop ecosystem covers a family of projects that fall under the umbrella of infrastructure for distributed computing and large data processing [19,20]. It is developed to support processing large sets of structured, unstructured, and semi-structured data, but it was designed as a batch processing system. Consequently, it doesn't support fast data analytics performance requirements. In order to support real-time processing, it can be linked with the Storm environment described in the next section.
Hadoop includes a number of components, and below is the list of components of relevance for this chapter [19]:
• MapReduce, a distributed data processing model and execution environment that runs on large clusters of commodity machines
• Hadoop Distributed File System (HDFS), a distributed file system that runs on large clusters of commodity machines
• ZooKeeper, a distributed, highly available coordination service, providing primitives such as distributed locks that can be used for building distributed applications
• Pig, a dataflow language and execution environment for exploring very large datasets. Pigs runs on HDFS and MapReduce clusters
• Hive, a distributed data warehouse
The MapReduce component supports parallel processing of computation through breaking up work into small tasks, all while dealing with task failures and without compromising the job to which they belong. This supports near linear scalability — as the data size increases, it is possible to add more computers and see jobs complete in the same amount of time. Note that a new version of MapReduce, referred to as YARN (Yet Another Resource Negotiator) addresses some of the scalability shortcomings of the “classic” MapReduce [21], but the details of this are beyond the scope of this chapter.
2.5.1 Spark
Apache Spark is more recent framework that combines an engine for distributing programs across clusters of machines with a model for writing programs on top of it. It is aimed at addressing the needs of the data scientist community, in particular in support of Read-Evaluate-Print Loop (REPL) approach for playing with data interactively.
Spark maintains MapReduce’s linear scalability and fault tolerance, but extends it in three important ways [22]. First, rather than relying on a rigid map-then-reduce format, its engine can execute a more general directed acyclic graph (DAG) of operators. This means that in situations where MapReduce must write out intermediate results to the distributed file system, Spark can pass them directly to the next step in the pipeline. Second, it complements this capability with a rich set of transformations that enable users to express computation more naturally. Third, Spark supports in-memory processing across a cluster of machines, thus not relying on the use of storage for recording intermediate data, as in MapReduce.
Spark supports integration with the variety of tools in the Hadoop ecosystem. It can read and write data in all of the data formats supported by MapReduce. It can read from and write to NoSQL databases like HBase and Cassandra.
Finally, its stream processing library, Spark Streaming, is an extension of the Spark core framework and is well suited for real-time processing and analysis, supporting scalable, high throughput, and fault-tolerant processing of live data streams. Spark Streaming generates a discretized stream (DStream) as a continuous stream of data. Internally, a DStream is represented as a sequence of resilient distributed datasets (RDD), which is Spark’s abstraction of an immutable distributed dataset. RDDs are distributed collections that can be operated in parallel by arbitrary functions and by transformations over a sliding window of data (sliding window computations). DStreams can be emitted either straight from input data streams sources, such as Apache Kafka or Flume (see later); HDFS; and databases; or by passing the RDDs from other DStreams output. Regarding input stream, Spark Streaming receives live input data streams through a receiver and divides data into micro batches, which are then processed by the Spark engine to generate the final stream of results in batches. The processing components, similar to Storm bolt (see later), are referred to as window transformation operators. Spark Streaming utilizes a small-interval (in seconds) deterministic batch to dissect stream into processable units. The size of the interval dictates throughput and latency, so the larger the interval, the higher the throughput and the latency. Since Spark core framework exploits main memory (as opposed to Storm, which is using Zookeeper) its mini batch processing can appear as fast as “one at a time processing” adopted in Storm, despite of the fact that the RDD units are larger than Storm tuples. The benefit from the mini batch is to enhance the throughput in internal engine by reducing data shipping overhead, such as lower overhead for the ISO/OSI transport layer header, which will allow the threads to concentrate on computation.
Spark was written in Scala [23], but it comes with libraries and wrappers that allow the use of R or Python.
2.5.2 Storm
Storm is a distributed real-time computation system for processing large volumes of high-velocity data. It makes it easy to reliably process unbounded streams of data and has a relatively simple processing model owing to the use of powerful abstractions:
• A spout is a source of streams in a computation. Typically, a spout reads from a queuing broker, such as RabbitMQ, or Kafka, but a spout can also generate its own stream or read from somewhere like the Twitter streaming API. Spout implementations already exist for most queuing systems.
• A bolt processes any number of input streams and produces any number of new output streams. They are event-driven components, and cannot be used to read data. This is what spouts are designed for. Most of the logic of a computation goes into bolts, such as functions, filters, streaming joins, streaming aggregations, talking to databases, and so on.
• A topology is a DAG of spouts and bolts, with each edge in the DAG representing a bolt subscribing to the output stream of some other spout or bolt. A topology is an arbitrarily complex multistage stream computation; topologies run indefinitely when deployed.
Trident provides a set of high-level abstractions in Storm that were developed to facilitate programming of real-time applications on top of Storm infrastructure. It supports joins, aggregations, grouping, functions, and filters. In addition to these, Trident adds primitives for doing stateful incremental processing on top of any database or persistence store.
2.5.3 Kafka
Kafka is an open source message broker project developed by the Apache Software Foundation and written in Scala [23]. The project aims to provide a unified, high-throughput, low-latency platform for handling real-time data feeds. A single Kafka broker can handle hundreds of megabytes of reads and writes per second from thousands of clients. In order to support high availability and horizontal scalability, data streams are partitioned and spread over a cluster of machines [23]. Kafka depends on Zookeeper from the Hadoop ecosystem for coordination of processing nodes.
The main uses of Kafka are in situations when applications need a very high throughput for message processing, while meeting low latency, high availability, and high scalability requirements.
2.5.4 Flume
Flume is a distributed, reliable, and available service for efficiently collecting, aggregating, and moving large amounts of log data. It has a simple and flexible architecture based on streaming data flows [24]. It is robust and fault tolerant with tunable reliability mechanisms and many failover and recovery mechanisms. It uses a simple extensible data model that allows for online analytic application.
While Flume and Kafka both can act as the event backbone for real-time event processing, they have different characteristics. Kafka is well suited for high throughput publish-subscribe messaging applications that require scalability and availability. Flume is better suited in cases when one needs to support data ingestion and simple event processing, but is not suitable for CEP applications. One of the benefits of Flume is that it supports many sources and sinks out of the box.
Note that several real-time applications have combined Flume and Kafka to leverage their individual features, as reported in [25].
2.5.5 Amazon Kinesis
Amazon Kinesis is a cloud-based service for real-time data processing over large, distributed data streams. Amazon Kinesis can continuously capture and store terabytes of data per hour from hundreds of thousands of sources such as website clickstreams, financial transactions, social media feeds, IT logs, and location-tracking events [26].
Kinesis allows integration with Storm, as it provides a Kinesis Storm Spout that fetches data from a Kinesis stream and emits it as tuples. The inclusion of this Kinesis component into a Storm topology provides a reliable and scalable stream capture, storage, and replay service.
2.6 Data Stream Analytics Platforms
The data stream processing platforms introduced above provide a basis for additional functionality needed to support real-time analytics solutions. This additional functionality incorporates a number of key constructs implemented in various EPS. We refer to this software layer as data stream analytics platforms.
There are broadly three types EPS: query-based approaches, rule-based approaches, and programmatic approaches. These three types of EPSs are discussed next.
2.6.1 Query-Based EPSs
Query-based EPSs typically support an EPL extended from the relational database language SQL to query event data. The queries expressed in a query-based EPL are often referred to as continuous/continual queries [27]. In contrast to traditional non-persisting queries that work on persistent data, continuous queries are stored persistently in the database and applied to event streams. The processing paradigm in such systems is:
• Define queries in an SQL-like language
• Process queries
• Results of the processing step are only selectively stored in the database
In order to handle unbounded input streams, a common feature among these query-based languages is “the extensive operations on sliding windows” [28]. Sliding windows are used to divide the event stream into segments so that these segments can then be manipulated and analyzed without the system running into unlimited wait time and memory usage. There are different types of sliding windows [29]:
• Time-driven model: The window is reevaluated only at the end of each time step. CQL [30] adopts this model.
• Tuple-driven model: The window is reevaluated every time a new tuple arrives. StreamSQL [31] adopts this model.
Since CQL and StreamSQL adopt different sliding window models, not all queries that can be expressed in CQL can also be expressed in StreamSQL, and vice versa [29]. In any one particular query-based language, it is important to stick to the consistent semantics so that all implementations using this EPL work in a consistent manner and generate expected results.
Query-based EPLs are considered as good at defining patterns of “low-level aggregation views according to event types defined as nested queries” [32]. However, any of these languages have shortcomings when expressing event pattern types. For example, CQL does not have the ability of expressing windows with a variable slide parameter [29]. Additionally, when detecting occurrences of the same event pattern type, different query-based EPLs may generate different results, but the user does not have the power to control which result should be generated [33].
A more recent solution is Azure Stream Analytics from Microsoft, which supports CEP over streaming data in the cloud [34]. CEP processing is realized through an SQL-like language to specify streaming analytics tasks, such as correlation, aggregation, sliding windows and calculations over those windows, comparing current conditions to historical values, and so on [34].
2.6.2 Rule-Oriented EPSs
Compared with query-based EPSs and general purpose EPSs, rule-oriented EPSs work best on describing higher-level conditional business event pattern types.
Production rules
Production rules techniques originated in the area of expert systems (or knowledge-based systems) in the 1980s. Since then they have been investigated comprehensively and have become very popular; they also have been successfully applied commercially in various domains such as medicine, telecommunications networks, and computer configuration systems [32].
Most production rule systems, as well as their database implementations, adopt forward-chaining operational or execution semantics [32]. The rules have the form of “if Condition then assert Conclusion/Action.” Whenever the rule base manager needs to modify the condition, the conclusion/action needs to be updated accordingly.
While production rules in nature “react to condition state changes and have no connections to event data” [32], recent work has attempted to extend production rule systems with new features like object models and a fact base to make CEP possible. Specifically, in the declarations of production rules, event types are defined. Incoming events are initialized as instances of the declared event types and are dynamically added to the fact base. In the rule condition, some operations such as filters and event pattern detection may be applied to the instances of events. If the condition is fulfilled, the action is triggered. Representative tools include Drools [35] and Business Events [17].
However, contemporary production rule systems still lack expressiveness as “they do not have a clear declarative semantics, suffer from termination and confluence problems of their execution sequences, and typically do not support expressive nonmonotonic features, such as classical or negation-as-finite failure or preferences” [32]. Therefore, certain event pattern types can be difficult to express. Some research in this area focuses on extending the core production systems to enhance their expressiveness [36], but this results in more complication of the usage of the system.
Event-condition-action rules
The event-condition-action (ECA) rules [37] approach was developed to support the need to react to different kinds of events occurring in active databases [38]. There are three components in an ECA rule:
• Event: Specifies the event that triggers the invocation of the rule. The event itself can be a composition of different event types, in which case it is called a composite event.
• Condition: Consists of the conditions that need to be satisfied in order to carry out the specified action. The condition is only checked upon occurrence of the specified event.
• Action: Specifies the actions to be taken on the data.
Examples of active database systems using ECA rules include ACCOOD [39] and Chimera [40]. Expert system techniques are sometimes integrated to allow rule triggering to be automatic. Apart from active databases, ECA rules have also been applied in conventional databases, where the condition is a traditional query to the local database, and in memory-based rule engines, where the condition is a test on the local data.
EPSs applying ECA rules in the corresponding EPL include Amit [41] and InfoSphere Streams [16]. These systems support event algebra operators analogous to those provided by active database event algebras, eg, Snoop [9], where complex expressions can be created using operators like And, Or, Sequence, etc. to describe event pattern types that can be applied over the event streams in real time.
Two typical usages of ECA rules in event data analysis include detecting and reacting to occurrences of particular event pattern types in the database that may undermine the data integrity in real time, and executing some business logic on incoming event streams.
2.6.3 Programmatic EPSs
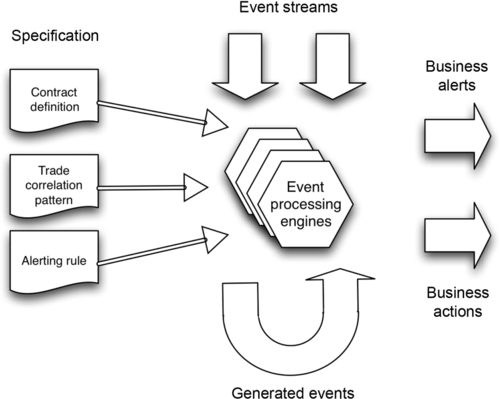
As mentioned above, programmatic EPSs provide a wide range of functionality for processing complex (or composite) events. They mostly follow the high-level architecture such as EventSwarm software framework. Its conceptual model is shown in Fig. 2. As many CEP engines, EventSwarm can process any type of event streams, such as trading event from stock market; eHealth messages, such as HL7 V2 messages and Twitter streams and generate alerts; or invoke a service, when a specific event pattern type occurs. The event patterns are specified using predefined constructs that define processing rules, such as length of sliding time windows, type of events to be monitored and their relationships. These event pattern types can, for example, specify monitoring rules for trading events (see our finance case study), for business contracts and also alerting rules.
EventSwarm provides a programming framework based on Java and offers “a range of pre-defined abstractions and pattern components implemented in the Java programming language” [42]. There are two typical styles of applications built using this framework, namely applications built for specific, predefined patterns or abstractions, and domain-specific applications that allow end users to define new patterns. For the latter, a graphical interface can be developed and provided for the user. It also has the following outstanding features [42]:
• “the ability to filter on any computed abstraction that matches a single event, including statistical analysis”
• the capability of “using causal precedence in sequence patterns”
• the ability to manage time and ordering issues through, buffering, flexible relationships between events, time skew allowance, and causal ordering
• the ability to incrementally update statistics on sliding windows
It is to be noted that one of the production rules based systems, Drools [35], has adopted similar semantics, and this product is referred to as Drools Fusion.
Table 1 lists different types of EPSs. There are some common event operations (key features) in these products:
Table 1
Classification of Event Processing Systems
| Type | Product |
| Query-based |
CCL/Aleri [43] *CQL [44] *Esper [45] StreamSQL [31] Azure Stream Analytics [43] |
| Programmatic |
Apama [46] EventSwarm [47] |
| Rule-oriented | |
| Production rules |
*Drools Fusion [35] BusinessEvents [17] |
| Event-condition-action rules (ECA rules) |
Amit [48] InfoSphere Streams [16] |
| Other (logic programming) |
*ETALIS [49] *Prova [50] |
• Event expressions — the fundamental building block of an EPS, allowing the specification of matching criteria for a single event [42].
• Filter — the component for reducing the set of events to be processed by an EPS to a subset of events relevant for the given processing task, eg, removing erroneous or incomplete data. The complexity of filtering mechanism in EPSs can vary depending on the expressiveness of the system, from basic static inspection of event attributes to comparisons against complex computed abstractions.
• Transformation — changing event data from one form to another, including translation, splitting, aggregation, composition, etc.
− Translation takes each incoming event and operates on it independently of preceding or subsequent events. It performs a “single event in, single event out” operation.
− Splitting takes a single incoming event and emits a stream of multiple events, performing a “single event in, multiple events out” operation.
− Aggregation takes a stream of incoming events and produces one output event that is a function of the incoming events. It performs a “multiple events in, one event out” operation.
− Composition takes two streams of incoming events and operates on them to produce a stream of output events. This is akin to the join operator in relational algebra, except that it joins streams of events rather than tables of data.
• Event pattern detection — component for detecting high-level patterns by examining a collection of events (using correlation, aggregation, abstraction, etc.). This operation can be further broken down into three steps:
− Predetection: Event pattern types are validated (eg, syntax and grammar errors), then compiled into executable EPL code by the EPL Compiler.
− Detection: The EPL executes the EPL code of the selected event pattern type generated from the previous step. Input event data is generated by a particular source and pushed to the EPL. The EPL then monitors the incoming event stream, matches the selected event pattern type in data, and produces an output of detected occurrences of this event pattern type.
− Post-detection: The EPL stores all occurrences of the selected event pattern type into the Event Database, and notify relevant targets to perform corresponding actions.
2.7 Data Analysis and Analytic Techniques
2.7.1 Data Analysis in General
The purpose of data analysis is to answer questions, to suggest conclusions, and to support decision making for data analysts. It is a process of converting raw data into useful information by systematically applying statistical and/or logical techniques. The following phases are normally included in data analysis [51]:
• Data collection — the process of gathering data of interest from certain data sources that are required to answering research questions.
• Data cleansing — the process of detecting and correcting (or removing) corrupt or inaccurate records from a record set, table, or database [52].
• Data transformation — denotes preparing data for further analysis via standardization or normalization. It is needed since in many applications of data analysis, the raw data or cleansed data cannot be used directly due to formatting issues. The formatting of values into consistent layouts is performed based on various elements, including industry standards, local standards, business rules, and domain knowledge bases.
• Statistical analysis — the goal of this phase is to find interesting patterns so as to identify trends. This phase involves various algorithms and can be broken down into five discrete steps, namely data nature description, data relation exploration, data modeling on how the data relates to the underlying population, validation of the model, and predictive analytics. Statistical analysis is often accompanied with or followed by data visualization to interpret the results of the analysis.
Note that these phases are akin to the phases in knowledge discovery in databases, which focuses on data analysis in databases.
There are different types of data processing tools, reflecting different stages of the data analysis activities as introduced above. Examples of such tools are:
• Pre-processing tools, such as OpenRefine [53,54] and Data Wrangler [55]
• Database management systems, making use of SQL (eg, MySQL [56] and PostgreSQL [57]), as well as NoSQL queries to search for data-satisfying specific parameters; the NoSQL are more amenable to real-time applications, with some examples of being Cassandra [58] and MongoDB [59]
• Statistical data analysis tools, such as R, SAS, Stata, and SPSS
2.7.2 Data Analysis for Stream Applications
Data stream analytics requires a special set of techniques for processing data that may be quite different to the analytics applied for historic data.
One reason for this is that the computation over streams, whether mathematical or statistical, needs to take into account that the data sets over which computations are performed are not fixed. These data sets are typically included as part of the sliding window abstraction, supported by most EPSs. Rather, such data sets change over time, such as when new events arrive and old events need to be removed.
The effect of this is that continuous updates of computations must occur over the sliding time window. Some of these such as stream related computations are relatively simple, such as calculation of minima, maxima, mean, or averages, and even simpler statistical calculations such as standard deviation. They can be computed with one update at a time, triggered by either event arrival or removal.
Other computations may be more involved, either due to the complexity of an algorithm, such as in multivariable regressions or when some sort of sampling over streams needs to be applied. The latter may be required when it is too costly or time consuming to perform calculations over the large population of data in the stream or when there is an infinite stream of data. Examples of techniques for sampling from a streaming population are sliding window reservoir sampling and biased reservoir sampling.
This property of streams will also have an impact on some other statistical techniques that are used in the context of predictive modeling. When, for example, one needs to perform a sampling of data over streams to apply forecasting techniques such as regression modeling, one needs to apply appropriate sampling algorithms as well.
Another complication of data stream analytics is that the computation needs to support processing out of order events. This is because in some cases, due to network delay or failures, the earlier event (ie, the one with earlier timestamp) can arrive later than the events currently being processed. There are various mechanisms that can be used to address these issues, including buffering for a defined period before processing, recalculation when an out-of-order event is received, or the use of calculation methods that are correct in the face of out-of-order events.
It may be noted that in general, a significant class of real-time analysis has the character of time series analysis, and many time series analysis techniques can be applied, although they need to be modified to reflect the specifics of stream analytics requirements, as illustrated by the several examples introduced above.
2.8 Finance Domain Requirements and a Case Study
This section will illustrate how some of the concepts, technologies, and techniques described in previous sections can be used to address a class of real-time analytics solutions in finance domain. The section begins by outlining some of the requirements when analyzing real-time financial market data, describes two example problems, and shows how one specific type of a CEP solution can be used to address these problems.
2.8.1 Real-Time Analytics in Finance Domain
The area of financial markets has witnessed significant changes in recent years due to a dramatic reduction in trading latency resulting from the use of high-speed computers and networks. High-frequency algorithmic trading, in which market and news data must be analyzed and trading decisions must be made, now occurs within a window of few microseconds. This results in huge volumes of “real-time tick data” or “tick-by-tick data” being generated. High-frequency datasets of typically hundreds of megabytes to many gigabytes in size are being used by finance researchers to study market behavior [60]. Studies have used high-frequency data to analyze many aspects of market microstructure, including volatility and price jumps [61,62]. There are many empirical works related to financial markets research that use such datasets.
Financial market data is a source of knowledge about trading behavior, strategies and patterns, market design, operations and efficiency, products being traded, and financial news. For this reason, there are many financial market data providers that sell either real-time data or historical data. Examples of financial market data providers or portals include Thomson Reuters [63], Bloomberg [64], and WRDS [65].
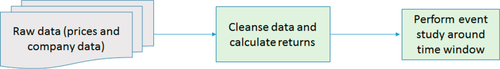
An example of real-time analytics in the finance domain is the data quality control. For instance, there are many data quality issues associated with data that is obtained from on-line feeds. Another example is determining the potential impact of a new event that requires an event study [66,67] to be carried out within a time window surrounding the event. Real-time price data needs to be preprocessed to accurately determine the returns timeseries (see Fig. 3). If the data preprocessing is not done properly, the data analysis will end up with errors or unreliable results.
In this case study, we will simulate a real-time feed using historical data downloaded from Thomson Reuters Tick History (TRTH) [63] provided by Sirca [68].
2.8.2 Selected Scenarios
We used two scenarios that are both representative in financial market data quality control and involve CEP rules. The purpose of the data analysis involved in these two scenarios is to detect occurrences of particular event pattern types related to the data preprocessing.
The first scenario involves dealing with duplicate dividend announcement events, which require six rules, as shown in Table 2.
Table 2
Event Pattern Rules for Duplicate Dividends
| Rule | Condition Description | Expected Action |
| 1 | Simple duplicate dividend records: Two events with Type “Dividend” have the same timestamp, the same “Div Amt.” and the same “Div Ex Date” | Delete the former dividend event |
| 2 | No “End Of Day” event exists with “Div Ex Date” of a Dividend event as the timestamp | Report it: missing data |
| 3 | An event with the type “Dividend” has null or empty value in the field “Div Amt.” or “Div Ex Date” | Discard this Div event and report missing value |
| 4 | A pair of duplicate dividends (pattern type No. 4) have different “Div Mkt Lvl ID.” Although these two dividends are issued at the same time (Date), the Div IDs are different which indicates they are two different dividends rather than a duplicate | This cannot be counted as a “duplicate dividends” case |
| 5 | A “Dividend” event has a value other than “APPD” in the field “Payment Status.” This dividend event is not approved (a value other than APPD) so it should be considered as an out-dated record | This dividend event cannot be counted in any “duplicate dividends” case |
| 6 | A “Dividend” event has “1” in the field “Div Delete Marker.” This dividend event is virtually deleted by the data provider, so this is not a valid entry | This dividend event cannot be counted in any “duplicate dividends” case |
The second scenario involves calculating and comparing the price-earnings ratios (P/E) of different companies in the same industry to indicate whether investors of a particular company are expecting a higher earnings growth in the future than other companies. To calculate the P/E ratio, we need both price data that provides price information and corporate action data that provides earnings information. There are totally six rules (business logic) for earnings calculation (see Table 3).
Table 3
Event Pattern Rules for Earnings Calculation
| Rule | Condition Description | Expected Action |
| 1 | An event with type “Earning” (E) happens before an event with type “End Of Day” (EOD) |
Calculate the earnings of the EOD event using the following formula: EOD.earnings = E.epsAmount * 10EPS_scaling_factor |
| 2 | Two events E6(1) and E6(2) with type “Earning” (E6(2) before E6(1)) happen before an event with type “End Of Day” (EOD) |
Calculate the earnings of the EOD event using the following formula: EOD.earnings = (E6(1).epsAmount + E6(2).epsAmount) * 10EPS_scaling_factor |
| 3 | Three events with type “Earning” (E3(2) before E3(1) before E6) happen before an event with type “End Of Day” (EOD) |
Calculate the earnings of the EOD event using the following formula: EOD.earnings = (E6.epsAmount + E3(1).epsAmount + E3(2).epsAmount) * 10EPS_scaling_factor |
| 4 | One 3-month earning E3 and one 9-month earning E9 occur before End Of Day |
Calculate the earnings of the EOD event using the following formula: EOD.earnings = E9.epsAmount + E3.epsAmount |
| 5 | Four 3-month earnings events (E3(1), E3(2), E3(3), E3(4)) before End Of Day |
Calculate the earnings of the EOD event using the following formula: EOD.earnings = (E3(1).epsAmount + E3(2).epsAmount + E3(3).epsAmount + E3(4).epsAmount) * 10EPS_scaling_factor |
| 6 | One 9-month earning event E9 and one 3-month earning event E3 occur before End Of Day |
Calculate the earnings of the EOD event using the following formula: EOD.earnings = (E3.epsAmount + E9.epsAmount) * 10EPS_scaling_factor |
2.8.3 CEP Application as a Case Study
This section introduces a CEP application that deals with the selected scenarios for financial market data processing. The application consists of two major components, namely financial user front-end system and a back-end CEP engine (see Fig. 4).
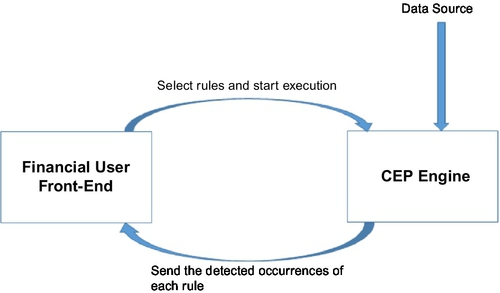
The role of the Financial User Front-End is to permit financial data analysts to select the rules they want to process on financial market data streams. The CEP engine serves to detect event pattern occurrences for each rule defined in the two selected scenarios.
A prototype was developed using the EventSwarm software framework for matching patterns against data sets. Communication with between the front end and the back end took place via a RESTful interface. Upon completion of processing, the CEP passes the result back to the calling application using an HTTP POST request containing matches encoded using the wire format, which is implemented using JSON [8] for simple and efficient cross-platform processing.
The EventSwarm service is implemented using Ruby on Rails on the JRuby platform. The specified patterns were coded in Ruby and are called in response to requests from a user or external application. The Ruby “patterns” are primarily constructors that build a CEP graph using EventSwarm core constructs. These constructs are provided through the EventSwarm core Java library with convenient Ruby wrappers to facilitate rapid development. Pattern matching execution primarily occurs in Java for maximum performance, although some elements of the earnings patterns are implemented in Ruby. Encoding of results into the wire format and sending is also implemented in Ruby.
Patterns are matched inside EventSwarm by feeding events through one or more processing graphs that select matching events or sets of events. Processing graph nodes can include sliding windows, filters, splitters (powersets), and abstractions. Abstractions are values or data structures calculated or constructed from the stream of events; for example, the EventSwarm statistics abstractions maintains sum, mean, variance, and standard deviation over numeric data extracted from events in a stream. Events can be added to and removed from the stream by a node, although downstream nodes can choose to ignore removals. For example, a sliding window works by instructing downstream nodes to remove events that have “fallen out” of the window.
The following steps were applied in deploying and testing the finance event pattern types [69]:
• A financial data analyst specifies a set of interesting event pattern rules. The specifications of the event pattern types are described in a natural language conveyed in writing or verbally to an IT expert.
• The IT expert implements the event pattern types in the event pattern detection service and makes them available for invocation by the Front-End application.
• The researcher selects the rules to be executed via the Front-End. The Front-End then passes these parameters to EventSwarm using an HTTP GET request to a configurable URL. Alternatively, the researcher can conduct event pattern detection tasks via the EventSwarm pattern detection service GUI.
• The EventSwarm engine then returns detected event pattern occurrences in JSON format. Finally, the occurrences are further processed by the front end.
As reported in [69], this application provides a number of implementation benefits, including:
• Simple and easy-to-use API; developers can easily integrate EventSwarm into their own applications.
• Very fast and efficient CEP, with the average speed of processing of more than 10,000 events per second on TRTH daily data provided by Sirca. This is almost as fast as a bespoke program dedicated to a fixed event processing process and executed locally.
• Very fast deployment of a new event pattern; it normally takes less than a day to implement five event pattern types.
• Well-structured output; JSON as the output format is well structured and it is convenient for developers to parse and further analyze the results.
Some limitations of the implementation prototype are:
• No user-friendly way of defining event pattern types via the GUI or an API; thus, the development cycle largely depends on the availability of the IT experts.
• The communication between the researcher and the IT expert can be very involving to help the IT expert in properly understanding the semantics of event pattern types described by the researcher. Any failure in the communication may cause issues that will be hard to diagnose in the future.
Overall, the implementation of the patterns using EventSwarm was mostly straightforward and required only minimal programmer effort, and most work required was on pattern specification and implementation.
2.9 Future Research Challenges
There are a number of research challenges in the area of real-time analytics. A major challenge is related to how to best apply and refine existing analytics techniques and functions, such as statistics or machine learning methods to streaming data. This is needed for applications such as more precise monitoring of the system under question, including detection of business, quality or security and privacy issues, more up-to-date data insights development, and predictive analytics outcomes.
Another problem is the lack of standard formats for facilitating interoperation of systems across the different layers of the real-time analytics stack. For example, there is no standard for representing event abstractions, such as events and event patterns. This issue should be addressed by proposing new models and standards that can accurately represent streaming data abstractions and can be used to facilitate interoperability between solutions across streaming and stored data platforms.
The final challenge is in developing user friendly solutions that reflect existing analysis methods and practices in specific application domains. For example, our financial study suggests that while data analysts are empowered to manage the event processing rules, they are unable to define suitable analytics abstractions (ie, event pattern types) by themselves. Ideally, there should be some domain-specific analysis models that drive the analytics infrastructure in a “model-driven” way. Whether such models should be based on a Domain-Specific Language approach or Semantic Technologies is still an open question.