1 Introduction
While functionality, quality, and cost have typically been the predominant criteria in the assessment of products, it has been observed that sustainability aspects are now receiving increased attention (O’Rourke 2014). Product sustainability, as understood in this paper, refers to the environmental, economic, and social impacts related to the different stages of the product’s life cycle. Due to the global value chains of many products, these impacts are often dispersed over multiple locations.
While some of the impacts, such as the emission of greenhouse gases, are of global importance, other impacts, such as the emission of acidifying or toxic substances, and particularly social impacts, are primarily applicable on a regional or even local scale.
Life cycle-oriented sustainability assessment methods (Kloepffer 2008; Finkbeiner et al. 2010; Zamagni et al. 2013), such as environmental life cycle assessment (LCA), usually compile the total impacts related to a product supply chain without explicitly considering their spatial distribution. Instead, global average values with regard to the inputs and outputs of the involved processes as well as average characterization factors are applied to compute aggregate impact indicators covering the entire product life cycle. These results are often used to identify sustainability hotspots in the product supply chain or to make comparisons between alternative products.
Neglecting the spatial dimension of the product supply chain may be problematic for the following reasons. First, interregional trade flows require that raw materials and products are transported over thousands of kilometers and the total transportation distance depends on the locations where the processes are carried out. Second, the inputs and outputs of manufacturing processes are influenced by technological heterogeneity. For example, the technologies for electricity generation and the resulting impacts are quite different throughout the world. Third, the local impacts of the same process (with identical inputs and outputs) carried out in different regions may vary due to environmental, social, and economic heterogeneity. As an example, the regionalized characterization factors for the acidification potential of nitrogen oxides can vary to a factor of more than 100 across European countries (Hauschild and Potting 2005). Thus, the geographic dispersion of the supply chain should not be ignored when assessing product sustainability. Instead, spatially differentiated assessments taking into account regional differences should be carried out. From this, important information about the design of the supply chain can be derived in order to improve product sustainability.
The topic of spatial differentiation has been discussed for many years in the life cycle assessment community (Potting and Hauschild 1997; Finkbeiner et al. 1998; Potting and Hauschild 2006; Reap et al. 2008; Finnveden et al. 2009). The main approaches to implement spatial differentiation within LCA are inventory regionalization, inventory spatialization, and impact regionalization (Patouillard et al. 2018). While inventory regionalization refers to the improvement of the geographic representativeness of inventory data (type and quantity of economic and elementary flows), inventory spatialization aims at attributing geographic locations to the unit processes and their corresponding elementary flows. Impact regionalization addresses the application of regionalized characterization factors that are more representative of specific geographic areas. For example, regionalized characterization factors have been developed by Hauschild and Potting (2005) and Verones et al. (2016). Computational models to perform spatially differentiated LCA calculations have been proposed by Mutel and Hellweg (2009) and Yang and Heijungs (2017).
However, in practice, spatial differentiation is rarely applied. A recent review of 142 articles in the context of operations research and sustainability assessment (Thies et al. 2018a) found that in only 20 of the articles a site-specific assessment, taking into account the local specifics, was carried out. In 20 further articles was the assessment site-dependent, considering at least some characteristics of the region or country. The most frequent use of spatially explicit data was at the inventory analysis level, but rarely with regard to the characterization factors.
Motivated by the discussion above, the objective of this paper is to show how the application of spatial differentiation in sustainability assessment can influence the assessment results and the conclusions that can be drawn on the design of supply chains in order to improve product sustainability. To this end, a hypothetical setting considering a supply chain of beer is introduced and the results for different scenarios of spatial differentiation are compared. For the sake of simplicity, the assessment concentrates on environmental impacts. Finally, the potentials and limitations of spatial differentiation in sustainability assessment related to supply chain design decisions are discussed and avenues for further research are identified.
2 Exemplary Setting for Spatially Differentiated Sustainability Assessment
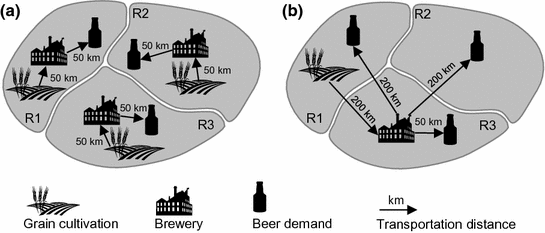
In this section, a hypothetical setting to highlight the consequence of spatial differentiation in sustainability assessment is introduced. This example considers selected environmental aspects of a highly simplified supply chain for beer production and is adapted from Yang and Heijungs (2017). While the original example contains spatially differentiated data on production technologies and environmental characteristics, transportation processes and alternative supply chain configurations have been added for the purpose of our analysis.

Structure of the simplified supply chain for beer production

Alternative supply chain configurations: (a) decentralized structure, (b) centralized structure
Process parameters for grain cultivation, brewery, and transportation
Parameter | Unit | Global average value | Spatially differentiated values | ||
|---|---|---|---|---|---|
R1 | R2 | R3 | |||
Grain cultivation CO2 emissions per kg barley NOx emissions per kg barley | kg kg | 0.2 0.3 | 0.15 0.2 | 0.18 0.24 | 0.3 0.4 |
Brewery Barley input per L beer CO2 emissions per L beer NOx emissions per L beer | kg kg kg | 3 0.4 0.8 | 3.2 0.45 1.1 | 3.2 0.45 1.1 | 2.5 0.25 0.5 |
Transportation CO2 emissions per t*km NOx emissions per t*km | kg kg | 0.7 0.4 | 0.7 0.4 | 0.7 0.4 | 0.7 0.4 |
Characterization factors for climate change and acidification
Parameter | Unit | Global average value | Spatially differentiated values | ||
|---|---|---|---|---|---|
R1 | R2 | R3 | |||
Climate change CO2 | kg CO2-eq | 1 | 1 | 1 | 1 |
Acidification NOx | kg H+-eq | 1.2 | 0.9 | 1.5 | 1.3 |
3 Results and Discussion

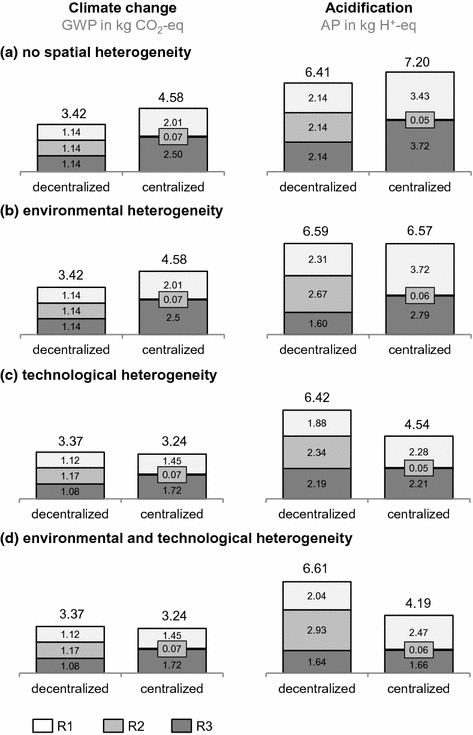
Impact assessments results for the decentralized and the centralized supply chain structure in the categories climate change and acidification in different scenarios of spatial differentiation (a–d)
In scenario (a), global average values for process parameters as well as characterization factors are applied. The total climate change and acidification impacts are higher for the centralized supply chain structure than for the decentralized supply chain structure, which is solely due to the longer transportation distances. Thus, the decentralized supply chain would be considered advantageous over the centralized structure from a global sustainability perspective.
Environmental heterogeneity is introduced in scenario (b). In this instance, the spatially differentiated characterization factors are applied, but global average values are used for process parameters. Compared to scenario (a), the results for climate change remain unchanged. However, with regard to acidification, the total impact of the centralized supply chain structure becomes lower than in the decentralized case because the emission of nitrogen oxides mainly takes place in regions where the spatially differentiated characterization factors are lower than the global average value.
Similarly, technological heterogeneity is introduced in scenario (c) by applying spatially differentiated process parameters while fixing the characterization factors to their global average values. This affects the results for both climate change and acidification. Due to the high yields of grain cultivation in R1 and the efficient brewery technology in R3, the centralized structure gains advantages over the decentralized structure in both impact categories.
Finally, environmental and technological heterogeneity are considered simultaneously in scenario (d) by applying the spatially differentiated values for process parameters and characterization factors. In this case, the effects of scenarios (b) and (c) add up, and as a result, the centralized structure has lower total impact with regard to climate change and acidification. Consequently, from a global sustainability perspective, the centralized structure should be preferred.
The results also reveal the spatial distribution of impacts. This is especially interesting for acidification as a regionally relevant impact category. It can be observed that although the total acidification impact is lower in the centralized structure, the regional acidification impact in R1 and R3 is slightly higher. Only in R2, the regional impact is much lower. Thus, a decision maker with a regional perspective on sustainability might prefer another design option than a decision maker with a global sustainability perspective.
4 Conclusions
This paper addresses the issue of spatial differentiation in sustainability assessment. Using a simplified example of beer production and concentrating on environmental sustainability aspects, it is shown that the application of region-specific process parameters and characterization factors instead of global average values influences the assessment results and has the potential to change the rank order of the alternatives. Furthermore, it gives insights into the geographic distribution of the impacts, highlighting potential conflicts of objectives between the perspectives of local and global decision makers.
The results underline the need for a consistent framework that allows for the spatially differentiated modeling of production and transportation processes and integrates regionalized impact assessment methods. Such a framework would not only enable a more accurate assessment of product sustainability, but also support the design of appropriate supply chain structures that allow for an improvement of product sustainability. Furthermore, the framework would not be limited to environmental sustainability aspects, but also integrate economic and social indicators. To this end, additional resource flows (e.g. labor) and respective characterization factors (e.g. wages, work accidents) need to be considered. A more detailed discussion on this is provided in Thies et al. (2018b).
In future work, more realistic supply chains and additional indicators for economic and social sustainability issues need to be investigated. To this end, the computational logic, which could be implemented in a spreadsheet model for the illustrative example above, needs to be formalized and implemented in a more sophisticated modeling environment. Furthermore, suitable data structures to handle the various materials and processes need to be developed.
With an increasing complexity of the supply chain, the number of possible design options to be considered than can be solved by manual iteration. The design of the supply chain should therefore be supported by appropriate optimization algorithms with options for decision makers to interact with the parameters/results and input their preferences. This would allow for the inclusion of many additional features of the decision making process, transcending the constraints set by numerical optimizations and leading to better human centered decisions.