1 Life Cycle Inventory (LCI) of Machining Processes
A CNC machine tool must be supplied with electrical power, cutting fluid, pressured air, cutting tools and needs a manufacturing infrastructure. In addition, the work station must be supplied with light, heat, fresh air and various equipments. During machining waste like oily equipment, metal chips and used cutting fluid, as well as emissions are generated. Most of these flows have upstream and downstream processes, i.e. production, cleaning, conditioning and waste treatment of cutting fluid.
The parametric life cycle inventory (LCI) model of machining processes is based on a LCI method for machining processes described by Schiefer (Schulz and Schiefer 1998, 1999a, b; Schiefer 2001; Abele et al. 2005). This LCI model contains the in- and outputs of the machining process and all necessary sub processes (before, after and during machining), like wastewater treatment, treatment of oily scrap, production of machine tools and cutting tools, cleaning of the part after machining, transportation inside the factory, as well as the complete manufacturing infrastructure. The quantity of the different energy, material, waste and emission flows were defined as functions of geometry and process parameters. Factory layout and process planning were setup in terms of technical feasibility, economical reasonability and work regulation aspects. The modeling principles, the containing in- and outputs and the structure of this parametric LCI model are described in Schiefer et al. (2017). The parametric LCI model was created using the professional software openLCA (GreenDelta GmbH, Berlin). Datasets from the ecoinvent database (ecoinvent Association, Zürich, CH) were used for the background operation, i.e. the generating of electricity.
2 EcoDesign
The product development has an important influence on the environmental effects of a product, due to the basic characteristics/properties of the product and its production processes they are directly and indirectly defined during this phase. If product designers would have a practicable and simple tool to compare variants of a part or different production strategies of the same part, they could more easily choose the ecologically compatible one. This would avoid, that ecological weak points occur later on and could prevent additional costs and engineering time. It is important to have indicators that are simple to handle and interpret. In this study the eco-indicator ![$$\left( {EI\; \left[ {\text{points}} \right]} \right)$$](../images/462404_1_En_3_Chapter/462404_1_En_3_Chapter_TeX_IEq1.png) , formed according to the single score indicator of the ReCiPe-method [develop by (Goedkoop et al. 2013)], was chosen to indicate the environmental effects of the processes. The normalization is calculated using the hierarchist perspective with average weightings (Goedkoop et al. 2013).
, formed according to the single score indicator of the ReCiPe-method [develop by (Goedkoop et al. 2013)], was chosen to indicate the environmental effects of the processes. The normalization is calculated using the hierarchist perspective with average weightings (Goedkoop et al. 2013).
The following description contains only the ecological investigation of the machining of metal parts on CNC turning centers that allows turning, milling and drilling. Machining centers that are primarily used for milling are still being investigated. They have different energy, pressured air and tool consumption as well as other process parameters and strategies.
During the computer aided design of a product and its workpieces the weight of the metal part ![$$\left( {m_{BT} \; \left[ {\text{kg}} \right]} \right)$$](../images/462404_1_En_3_Chapter/462404_1_En_3_Chapter_TeX_IEq2.png) , the weight of removed metal
, the weight of removed metal ![$$\left( {m_{SP } \left[ {\text{kg}} \right]} \right)$$](../images/462404_1_En_3_Chapter/462404_1_En_3_Chapter_TeX_IEq3.png) and the surface of the final part
and the surface of the final part ![$$\left( {A_{BT} \left[ {{\text{dm}}^{2} } \right]} \right)$$](../images/462404_1_En_3_Chapter/462404_1_En_3_Chapter_TeX_IEq4.png) can easily be derived.
can easily be derived.
A complete process planning is necessary to define the other parameters, as will be discussed hereinafter.
3 Application of the Parametric LCI Model of Machining Processes to Generate Eco-indicators
The amount of all in- and outputs of the LCI model are variable depending on the geometry and material of the workpiece and the process times. Different materials need different process parameters like cutting speed ![$$\left( {v_{c} \left[ {{\text{m}}/{ \hbox{min} }} \right]} \right)$$](../images/462404_1_En_3_Chapter/462404_1_En_3_Chapter_TeX_IEq5.png) , feed per revolution
, feed per revolution ![$$\left( {f \left[ {\text{mm}} \right]} \right)$$](../images/462404_1_En_3_Chapter/462404_1_En_3_Chapter_TeX_IEq6.png) , and depth of cut
, and depth of cut ![$$\left( {a_{p} \left[ {\text{mm}} \right]} \right)$$](../images/462404_1_En_3_Chapter/462404_1_En_3_Chapter_TeX_IEq7.png) , which form the volume removal rate. Most material is removed from a workpiece by roughing with high values for feed per revolution and depth of cut. The last cut, called finishing, removes less material with low feed per revolution to get a good surface quality and dimensional accuracy. As a first approximation it can be assumed that the complete surface generated by machining is finished after roughing.
, which form the volume removal rate. Most material is removed from a workpiece by roughing with high values for feed per revolution and depth of cut. The last cut, called finishing, removes less material with low feed per revolution to get a good surface quality and dimensional accuracy. As a first approximation it can be assumed that the complete surface generated by machining is finished after roughing.
![$$\left( {m_{BT} \left[ {\text{kg}} \right]} \right)$$](../images/462404_1_En_3_Chapter/462404_1_En_3_Chapter_TeX_IEq8.png) , the weight of the removed metal
, the weight of the removed metal ![$$\left( {m_{SP} \left[ {\text{kg}} \right]} \right)$$](../images/462404_1_En_3_Chapter/462404_1_En_3_Chapter_TeX_IEq9.png) , the surface of the final part
, the surface of the final part ![$$\left( {A_{BT} \left[ {{\text{dm}}^{2} } \right]} \right)$$](../images/462404_1_En_3_Chapter/462404_1_En_3_Chapter_TeX_IEq10.png) , the transport volume of the blank part
, the transport volume of the blank part ![$$\left( {V_{RT} \left[ {{\text{dm}}^{2} } \right]} \right)$$](../images/462404_1_En_3_Chapter/462404_1_En_3_Chapter_TeX_IEq11.png) , the stock removal energy
, the stock removal energy ![$$\left( {E_{th} \left[ {\text{MJ}} \right]} \right)$$](../images/462404_1_En_3_Chapter/462404_1_En_3_Chapter_TeX_IEq12.png) , the cutting time
, the cutting time ![$$\left( {t_{h} \left[ { \hbox{min} } \right]} \right)$$](../images/462404_1_En_3_Chapter/462404_1_En_3_Chapter_TeX_IEq13.png) , the running time of the machine including times for tool change, fast movement and movement without cutting
, the running time of the machine including times for tool change, fast movement and movement without cutting ![$$\left( {t_{g} \left[ { \hbox{min} } \right]} \right)$$](../images/462404_1_En_3_Chapter/462404_1_En_3_Chapter_TeX_IEq14.png) and the time the machine is occupied including setup and handling times
and the time the machine is occupied including setup and handling times ![$$\left( {t_{b} \left[ { \hbox{min} } \right]} \right)$$](../images/462404_1_En_3_Chapter/462404_1_En_3_Chapter_TeX_IEq15.png) . Figure 1 shows one of the exemplary workpieces with all mentioned parameters generated by carrying out a complete planning of the machining process.
. Figure 1 shows one of the exemplary workpieces with all mentioned parameters generated by carrying out a complete planning of the machining process.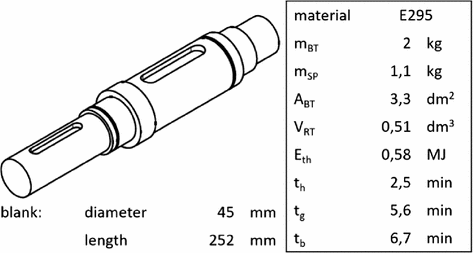
Example workpiece “gear shaft” with all relevant parameters used in the parametric LCI model
The eco-indicators (EI) can be calculated by defining these parameters and running the LCI-model in the professional software openLCA. This is done with the impact assessment method ReCiPe and normalization with hierarchic weightings.
4 Investigation of Parameters
Only the material, the weight of the part, the weight of the removed metal and the surface of the final part are known without doing a complete process planning of the machining process. Therefore, the number of parameters had to be reduced to make the eco-indicators applicable during the product development.
By applying the LCI model to different workpieces, a functional relation between the geometry of the workpiece and its environmental effects (eco-indicators) can be identified. This is especially caused by the functional relationship between the geometry of the workpiece and the process times.
 are conversion factors to convert parameters into the eco-indicators (EI). They were defined through parameter studies in the parametric LCI model in openLCA for each investigated material. Table 1 shows the amount of the conversion factors for the unalloyed steel E295 and thereby the environmental impact of the geometry and process parameters for this material.
Conversion factors for machining of an unalloyed steel (E295)
Conversion factors |
|
|
|
|
|
|
|
|
|---|---|---|---|---|---|---|---|---|
E295 | 0.001 | 0.0222 | 0.4450 | 0.6863 | 0.0266 | 0.0024 | 0.0064 | 0.0006 |
Unit |
|
|
|
|
|
|
|
|
![$$\begin{aligned} EI & = a \cdot A_{{BT}} + b \cdot E_{{th}} + c \cdot m_{{BT}} + d \cdot m_{{SP}} + e \cdot t_{b} + f \cdot t_{g} \\ & \quad + g \cdot t_{h} + h \cdot V_{{RT}} \quad \quad \quad [{\text{points}}] \\ \end{aligned}$$](../images/462404_1_En_3_Chapter/462404_1_En_3_Chapter_TeX_Equ1.png)
The surface of the final part ![$$\left( {A_{BT} \left[ {{\text{dm}}^{2} } \right]} \right)$$](../images/462404_1_En_3_Chapter/462404_1_En_3_Chapter_TeX_IEq33.png) , the weight of the part
, the weight of the part ![$$\left( {m_{BT} \left[ {\text{kg}} \right]} \right)$$](../images/462404_1_En_3_Chapter/462404_1_En_3_Chapter_TeX_IEq34.png) and the weight of the removed metal
and the weight of the removed metal ![$$\left( {m_{SP} \left[ {\text{kg}} \right]} \right)$$](../images/462404_1_En_3_Chapter/462404_1_En_3_Chapter_TeX_IEq35.png) can be easily extracted while using computer aided design and, can therefore, be easily used in the equation. The stock removal energy
can be easily extracted while using computer aided design and, can therefore, be easily used in the equation. The stock removal energy ![$$\left( {E_{th} \left[ {\text{MJ}} \right]} \right)$$](../images/462404_1_En_3_Chapter/462404_1_En_3_Chapter_TeX_IEq36.png) per kg removed metal is nearly a material specific constant for each investigated material (unalloyed steel, low-alloyed steel, chromium steel 18/8, cast iron, aluminium alloy). For example, for unalloyed steel (E295) the arithmetic averages of the investigated workpieces are 0.47 MJ per kg metal removed by roughing and 0.55 MJ per kg metal removed by finishing.
per kg removed metal is nearly a material specific constant for each investigated material (unalloyed steel, low-alloyed steel, chromium steel 18/8, cast iron, aluminium alloy). For example, for unalloyed steel (E295) the arithmetic averages of the investigated workpieces are 0.47 MJ per kg metal removed by roughing and 0.55 MJ per kg metal removed by finishing.
![$$\left( {t_{h} \left[ { \hbox{min} } \right]} \right)$$](../images/462404_1_En_3_Chapter/462404_1_En_3_Chapter_TeX_IEq37.png) is the sum of the cutting time for roughing
is the sum of the cutting time for roughing ![$$\left( {t_{{h_{rou} }} [\hbox{min} ]} \right)$$](../images/462404_1_En_3_Chapter/462404_1_En_3_Chapter_TeX_IEq38.png) and the cutting time for finishing
and the cutting time for finishing ![$$\left( {t_{{h_{fin} }} [\hbox{min} ]} \right)$$](../images/462404_1_En_3_Chapter/462404_1_En_3_Chapter_TeX_IEq39.png) . The cutting time per kg removed metal depends mainly on the generated surface and the total removed metal for both roughing and finishing. In each case the minimal value for the cutting time per kg removed metal is reached when a lot of metal is removed to generate a workpiece with minimal surface area. To take these relations into account Eq. (2) can roughly estimate this for each material, either for roughing or for finishing. The equation deduced from investigations of different reference workpieces and their process plans.
. The cutting time per kg removed metal depends mainly on the generated surface and the total removed metal for both roughing and finishing. In each case the minimal value for the cutting time per kg removed metal is reached when a lot of metal is removed to generate a workpiece with minimal surface area. To take these relations into account Eq. (2) can roughly estimate this for each material, either for roughing or for finishing. The equation deduced from investigations of different reference workpieces and their process plans.![$$\begin{aligned} & t_{{h_{rou/fin} }} = f\left( x \right) = \alpha_{rou/fin} \cdot \left( x \right)^{2} + \beta_{rou/fin} \cdot x + \gamma_{rou/fin} \quad \quad \quad \left[ { \hbox{min} } \right] \\ & \alpha , \beta , \gamma : = material \,specific\, values \,\left[ {min} \right] \\ \end{aligned}$$](../images/462404_1_En_3_Chapter/462404_1_En_3_Chapter_TeX_Equ2.png)
 represents the ratio of the generated surface to the mass of the removed material. It is also the mass ratio of the material removed by roughing
  and the total removed material
  and can be calculated by Eq. (3), which only depends on the geometry parameters
  and
and  and the material specific parameters depth of cut for finishing
  and the density of the material
  .
.![$$x = 1 - \frac{{\rho \cdot a_{{p_{fin} }} \cdot A_{BT} }}{{m_{SP} }} = \frac{{m_{{SP_{rou} }} }}{{m_{SP} }}\quad \quad \quad \quad \left[ - \right]$$](../images/462404_1_En_3_Chapter/462404_1_En_3_Chapter_TeX_Equ3.png)
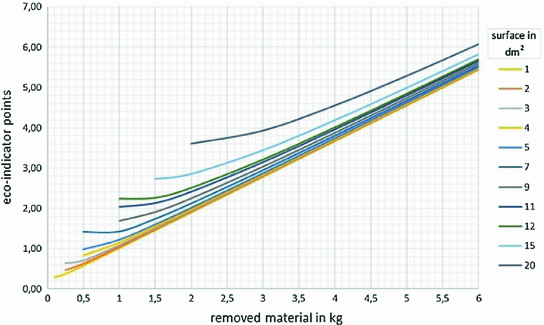
 consist of the cutting time and a time slice that is approximately constant for the investigated materials. This is a rough estimation to include auxiliary times like tool changing times, handling times and machine set-up times. Figure 2 shows the value of eco-indicator points per kg removed metal according to the mass of the removed metal and the generated surface using the described relation and the previously described Eq. (3).
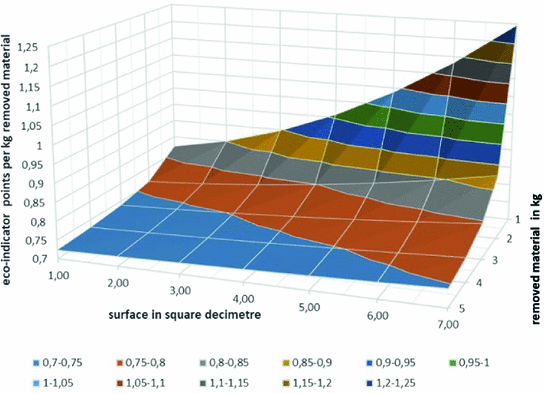
Relation between the mass of the removed material, the surface, and the resulting eco-indicator points for E295
Eco-indicator points for material production and forming per kg of the final product depending on the type of material (generated using ecoinvent data)
Material |
|
|---|---|
E295 | 0.44 |
1.4301 | 2.18 |
42CrMo4 | 0.63 |
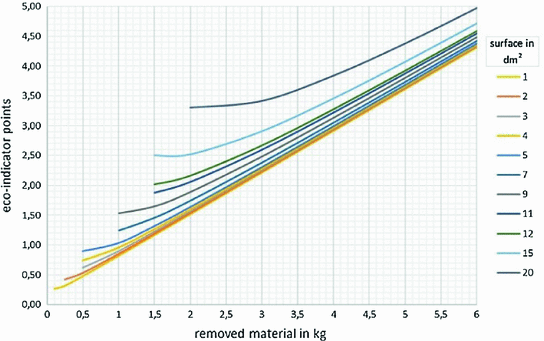
Eco-indicator points for the machining of unalloyed steel (E295)
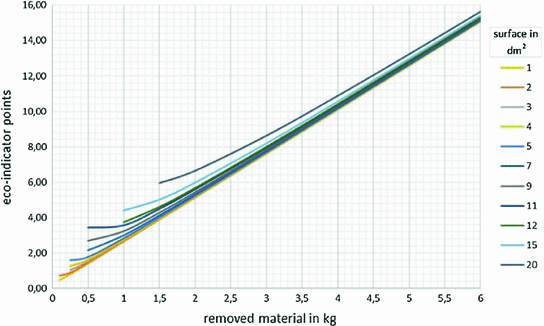
Eco-indicator points for the machining of stainless steel (1.4301)
Eco-indicator points for the machining of low-alloyed steel (42CrMo4)
5 Example

 and consist of unalloyed steel (E295). The first one is a shaft, the second one and the third one are hollow shafts. All three have constant diameters over the entire length. Table 3 shows the relevant properties.
Overview of the three example workpieces (E295)
No. | Final part | Unprocessed part | Removed | ||||
|---|---|---|---|---|---|---|---|
Diameter (mm) | Length (mm) | Mass (kg) | Machined surface | Diameter (mm) | Length (mm) | Mass (kg) | |
1 |
|
|
|
|
|
|
|
2 |
|
|
|
|
|
|
|
3 |
|
|
|
|
|
|
|
The eco-indicators for production of the material, which is not removed, are calculated by multiplying the mass of the final part with the material specific points shown in Table 2. The effects of the machining process are determined using Fig. 4 with the information of the mass of the removed metal and the generated surface.
Summary of the results
Eco-indicator points | |||
|---|---|---|---|
Shaft (1) | Hollow shaft (2) | Hollow shaft (3) | |
Material production (excl. removed material) | 0.5 | 0.2 | 0.2 |
Machining (incl. production of removed material) | 0.45 | 0.9 | 0.5 |
EI total | 0.95 | 1.1 | 0.7 |
6 Prospects
The generated method to estimate the environmental impact of machined parts is simple to handle and is based on detailed investigations of the machining processes and economical reasonable process planning. The parametric structure of the LCI model allows investigations of other materials or of the influence of the number of same pieces.
In the future, other manufacturing processes like welding, forging, water jet or laser cutting, assembling and disassembling, different types of moulding are going to be investigated to generate a database with many different options for production of a product or component.
If the database will contain more processes and different materials, it could allow the comparison of a lot of different variations of geometries and manufacturing processes or production strategies. By applying the method to the product development process, the environmental impact could be reduced efficiently without a distinct increasing of development costs and time.


