3- Learning PowerPivot “The Excel Way”
PowerPivot is Like Getting Fifteen Years of Excel Improvements All at Once
PowerPivot was first released in 2009, but development began fifteen years prior to that, in 1994. Back then, it was called Microsoft SQL Server Analysis Services (SSAS). Actually, SSAS is very much alive and well as a product today – it remains the #1-selling analytical database engine in the world. SSAS was/is an industrial strength calculation engine for business, but targeted at highly specialized IT professionals.
In late 2006, Microsoft architect Amir Netz launched a secret incubation project (codename: Gemini) with an ambitious goal: make the full power of SSAS available and understandable to Excel Pros. A few months later he recruited me to join the effort (he and I had collaborated before when I was on the Excel team). Gemini was eventually released under the name PowerPivot in 2009.
Continuing with the “biplane and jet” metaphor, think of SSAS as the jet plane, and Project Gemini (PowerPivot) as the effort to install an Excel-style cockpit and instrument panel so that Excel Pros can make the transition.
The key takeaway for you is this: PowerPivot is a much, much deeper product than you would expect from something that appeared so recently on the scene.
This actually has two very important implications:
1. It is very hard to exhaust PowerPivot’s capabilities. Its long heritage means that a staggering number of needs have been addressed, and this is very good news.
2. It is very helpful to learn it in the right sequence. When touring the cockpit of your new jet, much will be familiar to you – the SUM() function is there, so is ROUND(), and even our old friend RAND(). But there are new functions as well, with names like FILTER() and EARLIER() and CALCULATE(). Naturally you want to start with the simplest and most useful functions, but it is hard to know which ones those are.
That second point is very important, and worth emphasizing.
Learn PowerPivot Like You Learned Excel: Start Simple and Grow
When you were first introduced to Excel (or spreadsheets in general), you likely started simple: learning simple arithmetic formulas and the “A1” style reference syntax. You didn’t dive right into things like pivots until later. (In fact pivots didn’t even exist in the first few versions of Excel).
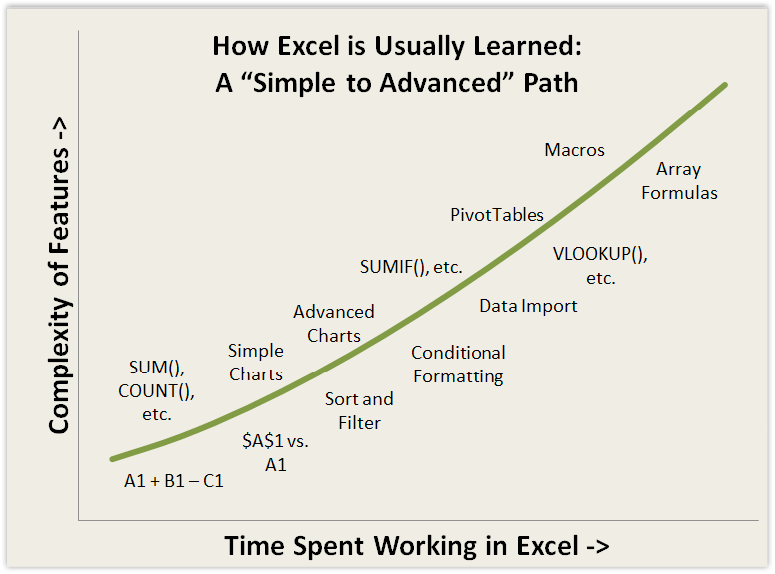
Figure 4 An Approximate Representation of the Typical Excel Learning Curve
You started with the simple stuff, got good at it, and only then branched out to new features. Incrementally, you added to your bag of tricks, over and over.
PowerPivot is no different. There are simple features (easy to learn and broadly useful) and advanced features (harder to learn and useful in more specific cases).
I have carefully sequenced the topics in this book to follow the same “simple to advanced” curve I developed and refined while training Excel pros over the past few years. The result is an approach that has proven to be very successful.
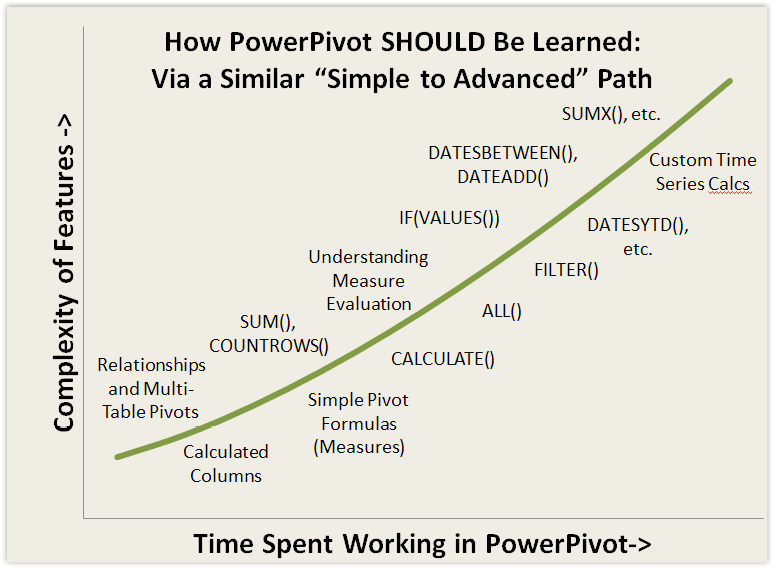
Figure 5 The learning curve I advocate to Excel Pros as they adopt PowerPivot
I highly recommend that you proceed through the book “in order.” You will see that the chapters in this book are organized in roughly the order pictured above.
When to Use PowerPivot, and How it Relates to Normal Pivot Usage
I hear this question a lot. Simply put, PowerPivot is useful in any situation where you would normally want to use a pivot. Whether you have 100 rows of data or 100 million, if you need to analyze or report on trends, patterns, and/or aggregates from that data, rather than the original rows of data themselves, chances are very good that PowerPivot has something to offer.
When you use a traditional (non Power-) pivot, your workflow in Excel generally looks something like this:
1. Grab data from one or more sources, typically landing in Excel worksheets (but sometimes directly in the “pivotcache” in advanced cases).
2. If multiple tables of data are involved, use VLOOKUP() or similar to create integrated single tables
3. Add calculated columns as needed
4. Build pivots against that data
5. Either use those pivots directly as the final report/analysis, or build separate report sheets which reference into the pivots using formulas
Our guiding philosophy on PowerPivot was “make it just like Excel wherever possible, and where it’s not possible, make it ‘rhyme’ very closely with Excel.” Accordingly, the 5-step workflow from above looks like this in PowerPivot:
1. Grab data from one or more sources, landing in worksheet-tables in the PowerPivot window.
2. Use relationships to quickly link multiple tables together, entirely bypassing VLOOKUP() or similar tedious formulas.
3. Optionally supplement that data with calculated columns and measures, using Excel functions you have always known, plus some powerful new ones.
4. Build pivots against that data
5. Either use those pivots directly as the final report/analysis, or convert pivots into formulas with a single click for flexible layout, or you can still build separate report sheets which reference into the pivots using formulas.
On net you should think of PowerPivot as “Excel++” – the only new things you have to learn should bring you tremendous benefit.
What This Book Will Cover in Depth
Simple Guideline: the more “common knowledge” something is, the less pages I am going to spend on it. I figure, for instance, that the button you use to create pivots is not worth a lot of ink. That topic, and many others, has been covered in depth by Bill Jelen’s first PowerPivot book, http://ppvt.pro/MRXLPP By contrast, the formula language of PowerPivot needs a lot of attention, so it receives many chapters and consumes most of the book.
But even in topics that are relatively straightforward, I will still point out some of the subtleties, the little things that you might not expect. So for instance, in my brief chapter on Data Import, I will call provide some quick tips on things I have discovered over time.
And what is this “DAX” thing anyway? “DAX” is the name given to the formula language in PowerPivot, and it stands for Data Analysis eXpressions. I’m not actually all that fond of the name – I wish it were called “Formula+” or something that sounds more like an extension to Excel rather than something brand new. But the name isn’t the important thing – the fact is that DAX is just an extension to Excel formulas.
OK, let’s load some data.