
Copyright © 2006, 2011 by Shelley Tanaka
Published in Canada and the USA in 2011 by Groundwood Books
All rights reserved. No part of this publication may be reproduced or transmitted in any form or by any means, electronic or mechanical, including photocopying, recording, or any information storage and retrieval system, without permission in writing from the publisher.
Distribution of this electronic edition via the Internet or any other means without the permission of the publisher is illegal. Please do not participate in electronic piracy of copyrighted material; purchase only authorized electronic editions. We appreciate your support of the author’s rights.
This edition published in 2011 by
Groundwood Books / House of Anansi Press
110 Spadina Avenue, Suite 801, Toronto, Ontario M5V 2K4
Tel. 416-363-4343
Fax 416-363-1017
or c/o Publishers Group West
1700 Fourth Street, Berkeley CA 94710
www.groundwoodbooks.com
Library and Archives Canada Cataloguing in Publication
Tanaka, Shelley
Climate change : a groundwork guide / Shelley Tanaka. — Rev. ed.
(Groundwork guides)
Includes bibliographical references and index.
eISBN: 978-1-55498-204-2
1. Climatic changes—Environmental aspects. 2. Global warming.
3. Global warming—Prevention. 4. Greenhouse effect, Atmospheric.
I. Title. II. Series: Groundwork guides
QC981.8.C5T35 2012 363.738’74 C2011-905395-0
Design by Michael Solomon

We acknowledge for their financial support of our publishing program the Canada Council for the Arts, the Ontario Arts Council, and the Government of Canada through the Canada Book Fund (CBF).
It is never too late to give up our prejudices… What old people say you cannot do, you try and find that you can. Old deeds for old people, and new deeds for new.
— Henry David Thoreau
Chapter 1
Climate Change Is Here, and It’s Real
There is an ecological time-bomb ticking away...
— Stephen Byers1
You’ve probably noticed that the weather has been big news lately.
In 2010, Russia had its hottest July in 130 years (since records have been kept). High temperatures and drought triggered widespread wildfires, and at least 15,000 people died. Pakistan suffered record rainfall and its worst flooding in the country’s history. At one point one-fifth of the country was under water, leaving 2 million people homeless.
That same year Los Angeles hit a record 45°C (113°F), and record high temperatures were recorded in seventeen countries around the world.2
Meanwhile, New Orleans is still recovering from Hurricane Katrina, which caused devastating floods and record damage in 2005. Some climatologists believe that wetter, more intense tropical storm seasons may well be due to global warming.
 3
3
But perhaps the most eerie news is coming from the isolated wilderness of western Siberia, where researchers report that a gigantic expanse of permafrost — an area the size of France and Germany combined — has begun to melt for the first time since it was formed at the end of the last ice age. Icy ground that has been frozen for 11,000 years is now, in just a few years, turning into a landscape of mud and lakes, threatening to release huge amounts of methane, a powerful greenhouse gas.
Soggy northlands, heat-related deaths, water shortages, wilting crops, heavy precipitation, power blackouts.
Is this the wave of the future?
Many experts are saying Yes.
• • •
Scientists have been warning us about global warming for more than three decades. But many of us are only starting to get the message.
The planet is getting warmer, and the warming is largely being caused by human activity. More important, this warming is happening at an alarmingly rapid rate. The earth’s surface temperature, which has not changed much in 10,000 years, has become significantly warmer during the past 150 years. If the current trend continues, many species, including humans, will not be able to adapt quickly enough to avoid severe hardship.
In the past hundred years, average global temperatures have risen at least 0.8°C (1.4°F), and three-quarters of this increase has occurred in the past thirty years. It doesn’t sound like much, but consider this. At the depth of the last ice age 20,000 years ago — a time when ice covered most of Europe, and the island of Manhattan lay under a blanket of ice half a mile thick — the average global temperature was only 5°C (9°F) colder than it is now. And in the 100,000 years that humans have been around, the planet has never been more than a degree or two warmer than it is today.
Besides, 0.8°C is just the average warming. The northern hemisphere is warming faster than the southern hemisphere. More dramatic change is taking place at the poles and in mountainous areas.
In 2002, on the eastern side of the Antarctic peninsula, a giant, floating mass of ice larger than the country of Luxembourg shattered and separated from the continent, disintegrating in just thirty-five days.5
At the other end of the globe, an area of Arctic sea ice one and a half times the size of Wales is lost each year, and an area of permanent sea ice the size of Arizona and Texas combined has disappeared since 1979. The Greenland ice sheet, up to 3 kilometers (2 miles) thick and just a little smaller than Mexico, is suddenly melting and sliding into the ocean much faster than scientists thought it would.
In fact, the World Glacier Monitoring Service says most of the world’s glaciers are retreating. If the warming trend continues as expected, by 2050, Iceland will be virtually glacier free for the first time in at least 2 million years, polar bears could be extinct, and the Himalayan glaciers, which provide 500 million people with water, will drastically shrink.
The world’s fresh water is also at risk elsewhere, as lakes and rivers dry up, and as evaporation and seepage from rising sea levels leave higher concentrations of salt and pollutants in existing supplies. In the American Southwest, Lake Powell and Lake Mead have been drying up, threatening the water supply needed to run the Glen Canyon and Hoover dams.6
Widespread drying is occurring across much of Europe, Asia, Canada, Africa and Australia, doubling the area of the planet affected by drought in the past thirty years. Hot, dry conditions in China are causing intense sand storms that are blowing dust right across the Pacific, polluting the air on the west coast of North America.
Meanwhile, the upper parts of all the world’s oceans are warming and expanding due to the rise in human-produced greenhouse gases.7 Average sea levels have risen 10 to 25 cm (4 to 10 inches) in the past century, and they are expected to rise much more rapidly in the next century. Warming sea temperatures are also contributing to the death of the world’s coral reefs, the most biologically rich of all marine ecosystems.
Animals are changing their migration patterns. Butterflies and birds are flying north and breeding earlier in spring. In 2011 scientists reported that species are shifting range two to three times faster than previously thought — 16 kilometers (10 miles) per decade, or 20 cm (8 inches) an hour.8 In the mountains of Colombia, warm-weather, disease-carrying mosquitoes that were once found only below 1,000 meters (3,300 feet) above sea level are now reported at altitudes more than twice that high.9
Each decade since the 1960s has been warmer than the last — an accelerated and extended warming that has not been seen in at least 1,200 years.10 Climate changes that used to unfold over thousands of years are now happening over just a few decades.
And humans are to blame.
• • •
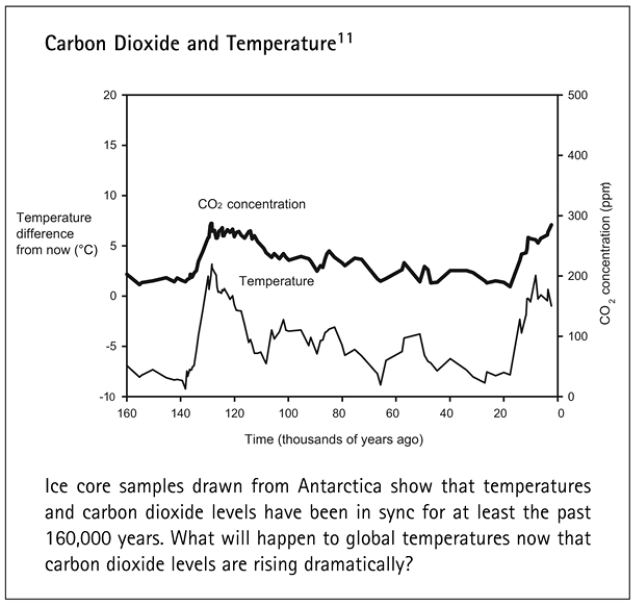
How can humans change the climate of the planet? There are many ways, but one of the most important is that in the past 150 years, as the world has become industrialized, people have been burning increasing amounts of carbon-containing fossil fuels — coal, oil and natural gas — releasing carbon dioxide into the atmosphere. The carbon dioxide traps heat and causes atmospheric temperatures to rise.
 11
11
At the same time, we have been cutting down the earth’s forests — forests that absorb carbon dioxide from the atmosphere and store it in their leaves and bark. More than half of the world’s forests have been cut down in the past 8,000 years, and each year an area larger than the state of Florida is destroyed.14
Each day we burn such vast quantities of fossil fuels that the carbon that has been stored underground for hundreds of millions of years is being returned to the atmosphere within a few centuries. There is now 30 percent more carbon dioxide in the atmosphere than there was 250 years ago. And more is released every time humans burn fossil fuels to heat buildings, make electricity or drive their cars.
Who is producing all this carbon dioxide? China and the US are the biggest overall emitters by country. However, per capita, the biggest emitters are Americans, Australians and Canadians (the average American, for example, consumes six times as much energy as the average person on the planet15.
But the atmosphere has no borders, and what goes into the atmosphere in one part of the world quickly affects us all.
• • •
There are many natural forces that cause the climate to get warmer, ranging from volcanic activity to fluctuations in the sun’s brightness and changes in the earth’s orbit.
But one thing is now clear. Natural phenomena cannot account for the speed and extent of the current warming. Scientists estimate that these natural forces have contributed only one-quarter of the total warming that took place in the twentieth century.16 The rest must be blamed on human activity.
So if humans have caused the problem, it makes sense that humans should fix it.
But who is going to do it? Global warming has been called the greatest single challenge facing humanity, yet the world’s political and business leaders seem to be spending much of the time finding reasons not to act. Some say that dealing with the problem will cause economic disaster. Others claim that we can adapt to the changes, or new technologies will save us, or at least the smartest and richest of us will survive.
The truth is that the politicians and business executives who are now making the decisons about climate change will be dead and gone in fifty years. And it will be left to today’s young people and their children to deal with the mess. Global warming is already affecting our lives, and the biggest changes are yet to come. They may not happen in time for current world leaders to take responsibility for them. Instead, they’ll arrive when today’s young people are looking for jobs, houses, raising families.
The climate change issue is tough to face because it goes far beyond agreeing on the science. The scientific consensus is clear. But global warming is an economic, political, philosophical and emotional issue as well. It affects how governments form policy and their relationship to industry.
And it affects the choices we make in our daily lives, how we look at the rest of the world, and what kind of world we want to leave to future generations.
 17,18
17,18
 19
19
Chapter 2
How We Got Here
Progress, man’s distinctive mark alone...
— Robert Browning
Over the earth’s long lifetime, the climate has changed many times, for many reasons. Continents have broken up and shifted, affecting the movement of warm and cool ocean and air currents. Periods of heavy volcanic activity have filled the atmosphere with dust and gases, blocking out the sun. Changes in the sun’s brightness and the earth’s orbit and tilt have influenced the amount of sunlight reaching the earth.
All these forces have caused natural long-term cycles of warming and cooling that have taken place over hundreds, thousands or millions of years.
About 90 million years ago, for example, the ocean was warmer than a hot tub.1 During a particularly warm period 55 million years ago, there were subtropical forests in the Arctic, and the ancestors of today’s crocodiles dozed in swamps in northern Europe.
Over the past 2.5 million years, the earth has also experienced several long periods of cooling. During these cold periods, or ice ages, a good deal of the earth’s water turned into snow and ice. Sea levels fell more than 100 meters (300 feet) as the polar ice sheets thickened and spread over the surrounding land masses, covering much of North America and Europe with glaciers. These ice ages (the most recent began 120,000 years ago) have been interrupted by shorter periods of warming (interglacials), when the edges of the ice sheets melted, and ocean levels rose.
These cycles of warming and cooling have always affected the plants and animals on the planet. Dinosaurs, for example, were in decline due to climate change long before an asteroid finally wiped them out 65 million years ago. As different parts of the world warmed and cooled, some species moved or adapted (at one point when the world was warmer than it is today, elephants and hippos thrived in western Europe). Others, like the mammoth and saber-toothed tiger, died off, while new species, such as the polar bear, emerged.
Modern humans have only been around for 100,000 years or so but, like other species, humans adapted as the planet warmed and cooled. In the early days, people moved to where the food was. Small groups of nomadic hunters might follow herds of reindeer or bison as the climate changed and grazing territories shifted. People lived where nuts, berries, grasses, fungi and shellfish were plentiful. If their traditional food sources disappeared, they moved to find others. Groups that could not find enough to eat simply died off, and the human population remained small.
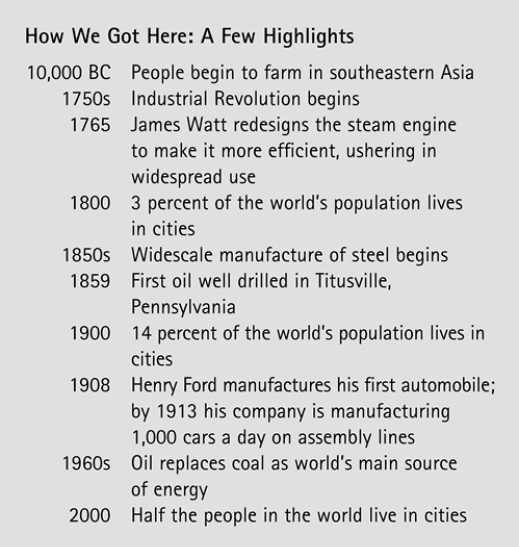
Then, about 10,000 years ago, humans began to farm. Instead of roaming the land in search of food, people began to stay in one place, where they grew food crops and raised animals such as cattle, goats, sheep and pigs. They found ways to store and preserve food — grinding grain into flour to make bread, salting fish and meat, boiling nuts and grains to make oil.
Groups of people settled in places where the climate was mild, because warmer, longer growing seasons meant bigger, more reliable crops. Settlements sprang up along low-lying shorelines on rivers and oceans, where there were natural harbors and easy access to water transportation and irrigation. Once people had a more reliable food supply, populations began to grow rapidly in different parts of the world.
As settlements grew and spread, surrounding forests were cut down for fuel for cooking and heating, to clear land for towns and roads, and for crops and grazing. In many places, wood was used to build homes, churches and schools (it took twelve mature trees, for example, to make a single house2, as well as carts, furniture, fortifications, bridges and, eventually, ships, railway ties and paper.
When the trees and other resources around them ran out, people looked farther afield. Europeans went to the Americas, to Russia. By the twentieth century, widespread clearing was flattening the tropical forests of Southeast Asia, South America and Africa.
As the world’s population grew, more and more land was needed for farming on a larger scale — sugar plantations in the Philippines, coffee farms in Brazil, sheep pastures in New Zealand, tobacco fields in the United States, logging operations in Indonesia and Thailand. When several seasons of intensive farming had exhausted all the nutrients in the soil, farmers simply moved on and cleared more land.
Over time, the world’s forests began to disappear. Three-quarters of China was originally covered by trees; now only 5 percent of the land is forested. In the United States, all but 6 percent of the original forest cover was cleared.3 Brazil, home to much of the planet’s remaining rainforest, has already lost half of its major old-growth forest and continues to lose 1.6 million hectares (4 million acres) of forest a year.4 Half the world’s mature tropical forests were cut after World War II, mostly to make room for agriculture.5 Often the clearing was achieved by burning, which was faster than cutting. When trees were burned, the carbon stored in their leaves and trunks was released into the air.
As wood fuel became scarce, people turned to coal, a carbon-rich fossil fuel formed hundreds of millions of years ago from decomposing trees and swamp plants. Coal was plentiful, and it could be dug out of the ground and burned to heat homes and cook food.
In 1765, a British engineer named James Watt built an engine that ran on steam. The steam came from boiling water heated by burning coal. The engine could be used to run trains, ships and machinery. Coal could also be converted into gas to light lamps. Now factories could be lit at night, and people could work longer hours. In cities, smoke from burning coal spewed out of home and factory chimneys twenty-four hours a day. The smoke settled in the air in a yellow haze called smog. The burning coal also released large amounts of carbon dioxide into the atmosphere.
New machines were invented. Agriculture became mechanized with the use of mechanical reapers, combine harvesters, seed drills and plows. Farms became larger, more food could be grown and more people could be fed, but fewer people were needed to work in the fields. Instead, people moved to the cities to work in the growing numbers of factories. This period of large-scale industrialization was called the Industrial Revolution, and it changed how people lived — first in Europe, then in North America and later in other parts of the world.
As the Industrial Revolution progressed, more and more energy was needed — to turn iron into a harder metal called steel, to smelt copper, tin and lead, to make glass, bricks and eventually new materials like aluminum and plastics. Cement (made from heated limestone and then mixed with sand and broken stones to form concrete) became the most widely used building material in the world, but huge amounts of fossil fuels were burned to make it.6
Energy was needed to power ships that carried raw materials to the factories to be turned into clothing, processed foods and other goods — cotton from the American South, furs from Canada, beef from Argentina, rubber from the tropics, wool from Australia.
Meanwhile, new appliances and devices were invented to make life easier, but all these things consumed energy, too, both when they were produced and when they were used. More energy was needed to power refrigerators, stoves, washing machines and dryers; then to run televisions, air-conditioners, dishwashers, stereos and computers.
As the need for energy grew, oil, another fossil fuel, gradually replaced coal as the world’s most important source of energy. Oil was used to produce electricity and then to fuel automobiles after the internal combustion engine was perfected, and cars replaced horses as the main mode of transportation. Cars didn’t need to be stabled and fed and they didn’t leave a mess on the roads, but they did run on gasoline — refined oil — and they released carbon dioxide whenever they were driven.
Cars became the center of North American culture, influencing how and where people lived. As cities grew, urban planners designed suburbs — satellite communities where every house had room to park an automobile or two, but people had to get in their cars to get to their workplace or to go shopping. Nobody minded, because gas was so cheap. Soon people came to expect to be able to drive their own cars to work, to stores, even to school, creating a need for more expressways, bridges, underpasses, overpasses, parking lots and wider streets.
In the beginning, most of this development occurred in Europe, North America and Japan, as these industrialized countries drew first on the raw resources and then on the markets of the rest of the world. These Western economies continued to grow richer, while most of the world remained poor. Even today, more than a billion people in the world do not have clean water or proper housing or enough fuel to heat their homes, while people in the industrialized world, who make up only one-quarter of the population, eat half the world’s food.7
But some developing nations are catching up quickly. China, the world’s most populous country, now has the fastest-growing economy. It is copying the patterns of Western consumption at an accelerated rate, and the model that took the industrialized world many decades to achieve — large homes in suburbs, expanding cities and highways and a car-centered culture — is now being created at a breakneck pace in some parts of China.
 8
8
Meanwhile, the population of the world has continued to grow. Now, millions of people are affected when droughts turn over-farmed land into dustbowls, when heavy rains turn clearcut hillsides into mud, when floods engulf heavily populated river deltas.
Modern human lifestyles now depend on consuming vast amounts of energy — to keep billions of people sheltered and warm; to produce, refrigerate, preserve and transport food; to carry humans and cargo from place to place; and to produce the many goods that fill people’s daily lives. The world’s energy use has nearly doubled in the past thirty years, and is expected to increase 60 percent by 2020.9
And although hydro power, nuclear energy and other sources carry some of the burden, the vast majority of the world’s energy still comes from burning fossil fuels.
Chapter 3
How the Climate System Works
Each element of the cosmos is positively woven from all the others…It is impossible to cut into this network, to isolate a portion without it becoming frayed and unravelled at all its edges.
— Pierre Teilhard de Chardin
The earth’s climate is created by the complex relationships that exist between the sun, atmosphere, water and land. Their interactions determine everything from temperature and precipitation to wind, humidity and atmospheric pressure — whether it is hot or cold, windy or calm, wet or dry.
Sun
Everything begins with the sun. When sunlight hits the earth, some of it is reflected back into space. But some is absorbed by the earth’s surface and turned into heat — heat that sets both the atmosphere and oceans in motion, triggering all of the earth’s climate systems.
Atmosphere
Although the atmosphere has often been described as a blanket of air surrounding the earth, it is an extremely thin blanket — as thin, say, as the skin on an apple. It contains mostly nitrogen (78 percent) and oxygen (21 percent). Many other gases make up the remaining 1 percent. Some of these gases are only present in tiny amounts — parts per million (ppm) or even parts per trillion — but together they create a natural phenomenon called the Greenhouse Effect.
In a greenhouse, sunlight passes through the glass and is absorbed by the plants and soil, which then give off heat. The heated air would normally rise and be replaced by the cold air from above, but the glass prevents this, keeping the air inside the greenhouse warm.
Similarly, sunlight passes through the earth’s transparent atmosphere, where it is absorbed by the earth’s surface, converted into heat and emitted back into the atmosphere. Greenhouse gases trap some of this heat, and this heat warms the earth.
If there were no greenhouse gases trapping the outgoing heat, the earth’s surface temperature would be -18°C (0.4°F) — too cold for life as we know it.
When the atmosphere at the equator is warmed by the sun, the hot air rises and moves part way toward the poles. As the air rises and moves, it cools, becomes denser and sinks, eventually moving back toward the equator.
This movement of cold and hot air does not happen smoothly or evenly. The size and shape of land masses, the rotation of the earth on its axis, and countless other influences all affect the speed and density of the moving air masses and how they meet each other. When two air masses meet, changes in the weather occur.
Water
The sun’s energy also heats the oceans, which cover 70 percent of the earth’s surface. The heated water sets ocean currents in motion the same way heated air creates the winds. Currents carry warm ocean surface water from the tropics toward the poles, while denser, colder deep water moves in to take its place. Contrasting temperature and salinity (which together determine density) keep the water masses separate.
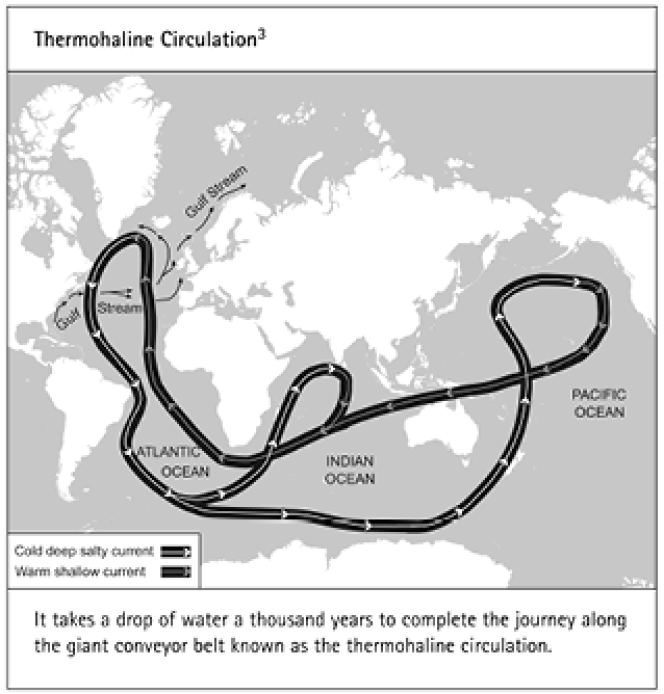
The ocean currents move like a giant conveyor belt that circles the globe, carrying warm water from the equator up the east coast of North America and across the Atlantic as the Gulf Stream. When this warm water reaches the mid North Atlantic, it releases its heat into the atmosphere, cools, becomes denser and sinks. The deep cold water eventually flows back south, around the southern tip of Africa and into the Pacific, where it warms again and finally makes the return trip west and back to the Atlantic.
 3
3
The giant loop is known as the thermohaline circulation (THC) — a massive, slow, steady movement of water that has a powerful influence on the world’s climate. Thanks to the Gulf Stream, for example, palm trees grow in Cornwall and southern Ireland, which lie almost at the same latitude as the southern tip of James Bay.
The temperature of the ocean waters also affects sea levels. In warm periods, sea levels rise because water expands as it warms and takes up more room than cool water. During cold periods, sea levels also go down because more of the planet’s water is frozen in glaciers and ice caps.
There is also a close and complex interaction between the earth’s bodies of water and the atmosphere. This interaction is called the hydrologic cycle.
Most of the earth’s water (97 percent) is held in the oceans. Three-quarters of the rest lies frozen in the polar ice caps and in mountain glaciers; most of the remainder is buried underground. Together, freshwater lakes and rivers and water vapor in the air make up only about one hundredth of one percent (.01 percent) of all the water on earth.
When the sun heats the oceans, lakes and rivers, the water evaporates and rises into the air as water vapor. As the air rises and cools, the water vapor condenses, releasing heat as it does. As it condenses it also collects on small particles (aerosols) that are suspended in the atmosphere. If there are enough drops of water vapor, clouds form. If the water drops become large enough, clouds become saturated, and the water falls to the earth as rain or snow, replenishing the world’s lakes, rivers and oceans, groundwater and ice caps.
At any given moment, clouds cover more than half the planet, and they affect the earth’s climate in many different ways. Some low gray clouds produce precipitation. Wispy, high clouds let in light but reduce the amount of heat that can get back out. And low-lying clouds have a cooling effect, because they trap essentially no heat, and they bounce the sun’s light energy back into space before it even reaches the earth.
The amount of water on earth does not really change. Instead, the same water is recycled over and over. But the hydrologic cycle does not work tidily, and the water seldom goes up and down in the same place. Winds can move clouds in unpredictable ways, and the water that evaporates off a lake can fall as rain a half a continent away.
Land
The earth’s land areas also affect climate in different ways. Temperatures are more extreme, for instance, in the middle of large land masses. Mountains force the air that hits them to rise so that the water vapor condenses into clouds, which release their water as rain and snow.
The color of the land affects climate, too. Just as a black car sitting in the sun will feel hotter than a white one, dark-colored bare rock will soak up the sun’s rays and turn the energy into heat; such surfaces are said to have low albedo. Light-colored areas of ice and sand have high albedo. They reflect about 40 percent of sunlight back into space before it can warm the surface. Freshly fallen snow has the highest albedo of all, reflecting 80 percent or more of the light that hits it back into space before it can turn into heat.
Carbon Cycle
The sun’s effect on the air, water and land creates the earth’s climate. But how are humans disturbing this natural system?
Humans are affecting climate by changing the balance of another vital natural cycle called the carbon cycle.
Carbon is a chemical element found in everything from plants and animals (one-fifth of the human body, for example, is carbon) to certain rocks and the air we breathe. Most of the planet’s carbon is buried in the earth’s crust as fossil fuels and embedded in rocks like limestone and chalk. Carbon is also stored in the earth’s oceans, soils and plants.
Carbon constantly circulates between the air, land, water and all the living things on the planet. Carbon (C) is introduced into the atmosphere as carbon dioxide (CO2). This happens naturally in a number of ways. Volcanoes bring up carbon from deep below the earth’s surface when they erupt. Limestone rocks erode slowly over time, releasing carbon into the air.
And all living things contribute to the carbon cycle when they breathe in oxygen, combine it with the carbon in their bodies, and breathe it out again as carbon dioxide. When plants and animals die, their bodies decompose and release their carbon back into the soil, air or water.
Much of the carbon released into the air is naturally recycled through the world’s vegetation and oceans, which pull carbon out of the atmosphere.
Plants take in carbon from the air and use it to make leaves and wood. All types of vegetation take in carbon, but young, growing forests, especially tropical forests (which grow year round), are the most efficient.
The oceans have a much larger capacity to take up carbon; they absorb one-third of the carbon dioxide that humans put into the atmosphere. Waves and other turbulence mix carbon dioxide from the atmosphere into the water. Some of the carbon dioxide is used by tiny marine plants (phytoplankton) for growth and by ocean animals to build their shells. When these plants and animals die, they sink into deep water where the carbon can be sequestered for hundreds or even thousands of years. And if these ocean bottom accumulations are buried in mud, they can be removed from the earth’s surface systems for millions of years.
Like all of the earth’s natural systems and cycles, the carbon cycle has been operating for millions of years. But this system is now being influenced by a new agent. Humans are pulling huge amounts of carbon fuels — oil, coal and natural gas — out of the ground and burning them, releasing large amounts of carbon dioxide into the atmosphere over a very short period. At the same time, we have been rapidly cutting and burning the earth’s forests, adding carbon dioxide to the air while reducing the forests’ ability to remove excess carbon from the air.
Carbon dioxide is now accumulating in the atmosphere twice as fast as the natural sinks can remove it, causing the planet to get warmer. And the effects of this warming are long-term and far-reaching.
Chapter 4
The Effects of Climate Change
It is almost as if we had lit a fire to keep warm, and failed to notice that the furniture had ignited.
— James Lovelock1
Temperature readings, ice core samples and other physical evidence all show that average global temperatures are rising. But rising temperatures, particularly of a degree or two, don’t mean much on their own. This week is a little warmer than last week. This winter is milder than last winter. So what? Maybe it’s a good thing.
But warmer global temperatures affect more than the daily or monthly weather forecasts. They have an impact on everything from the world’s shorelines and the planet’s fresh water supply to where we live, what we eat, the jobs we work at — even the survival of some species.
The interconnectedness of the oceans, land and atmosphere means that the effects of global warming will be complex, far-reaching and even contradictory. Some places will be a little warmer, some a lot warmer, and some may at first even be cooler, if winds or ocean currents shift. Wind and rainfall patterns that have remained more or less constant for thousands of years may now change within decades. Worldwide there will be more precipitation, but shifting wind patterns may carry clouds long distances before they dump their water vapor. To the poles, where their moisture will fall as snow, replenishing the polar ice sheets? To areas that were once dry, opening up new farmland? In a warmer atmosphere will this rainfall evaporate before it can benefit soils and plants? Will areas that once received rain now go dry?
No one knows for sure.
Effects will breed other effects, or feedbacks. Some of these feedbacks may reduce the existing warming (negative feedbacks). Warmer temperatures, for instance, might allow plants to grow faster, taking more carbon dioxide out of the atmosphere. Positive feedbacks increase or accelerate the warming. Once ice and snow begin to melt, for example, the melting ice absorbs more sunlight. If a warmer climate causes forests to dry out and die, they will no longer remove carbon from the atmosphere, which will cause the atmosphere to heat up even more.
Here are just some of the things that happen when global temperatures go up.
THE CLIMATE BECOMES MORE VARIABLE
A warmer climate may trigger more episodes of extreme weather, such as heat waves, storms and drought. Although no single weather event can be directly blamed on global warming (that event may have occurred as a result of natural forces), a warmer climate does make extreme weather events more likely to happen.
Heat Waves
When average temperatures go up, cold days are not as cold, but extremely hot days are even hotter, and there are more of them. People lucky enough to have air-conditioning will want to turn it on more often, but many will suffer, especially the poor, the elderly and the ill. Death rates typically double or triple in large cities during very high temperatures, because asphalt, concrete, brick and glass soak up and hold heat and because heat releases allergens such as pollen and mold, triggering conditions such as asthma, especially in children.2 The 2003 heat wave in Europe, when temperatures went over 40°C (104°F) in some places, resulted in more than 30,000 heat-related deaths.
More Precipitation
A warmer planet is a wetter planet. It is estimated that global precipitation increases 1 percent for every 1 degree Celsius of warming. The total amount of water on the planet and in the atmosphere remains the same, but the hydrologic cycle becomes more active. More water evaporates, and water vapor rises and falls as rain more frequently.
The combination of a moister, warmer atmosphere and warm ocean temperatures provides the energy that fuels tropical storms, and some climatologists now think there may be a connection between tropical storms and global warming.
Global warming does not mean there will be more tropical storms.3 But the ones that do occur may well be wetter and more intense, and this trend will likely continue as the climate continues to warm.4 Natural long-term cycles drive the hurricane season in the mid Atlantic, El Niño events in the Pacific and the monsoon season in Southeast Asia. However, such storms get their energy from warmer surface ocean temperatures. The extra heat and energy trapped by greenhouse gases heat up the atmosphere even more. Winds rush in at ground level to replace the rising air, and wind speeds increase, violently whipping the rain and waves.
More rain also means more heavy rain.5 When rain comes down in sudden, intense gushes, the water doesn’t soak into the soil but runs off, often taking the nutrient-rich topsoil with it. Sewers, rivers and other bodies of water overflow, causing flooding. Once the storm has passed, mosquitoes are drawn to the pools of leftover warm stagnant water, with some species bringing diseases such as malaria, encephalitis and dengue fever.
Crops are drowned and flattened. Power lines and trees come down. Bridges and roads are swept away and flooded. The drinking water is polluted from over-flowing sewage systems. Slabs of wet earth fall off the sides of mountains, causing landslides. Rivers flowing from high areas bring huge amounts of water and debris downstream, flooding river deltas. Rising sea levels mean high waves reach farther inland and, because of growing populations, do more damage to areas that were once safe from storms.
In the aftermath of such storms it can take years for people to rebuild their homes and recover their livelihoods.
Drought
It’s true that a warmer climate means a more active hydrologic cycle and more precipitation. But excessive precipitation in one place means less somewhere else. As well, with higher temperatures, moisture evaporates more quickly from plants and the soil, so drought can occur even if the rainfall remains unchanged. Warmer, shorter winters can mean less snow accumulation, so a spring melt that normally replenishes lakes and rivers may not provide enough water for the next growing season. Global warming does not cause drought; some areas are naturally drought-prone. But it can make droughts longer and more intense.
Food plants, which are usually seeded and harvested in one growing season, are particularly vulnerable to drought. But drought kills plants in more ways than by not providing the water they need to grow. On the North American prairies, for example, a warm, dry spring can mean emerging grasshopper nymphs are not killed by the usual spring rains or damp-loving fungal infections, resulting in an exceptionally large grasshopper population that can decimate wheat crops. Spider mites can invade soybeans if the insects are not killed by the damp molds that normally keep them in check.
Trees may have deep roots and a tough armor of bark, but drought can stress even hardy species, making them vulnerable to insects and disease. Bark beetles not killed off by freezing winters move in to feed on cedar, fir and pine that have been weakened by dry conditions. Flatheaded borers go after the oaks and birches.
And, of course, drought turns forests into tinder boxes, vulnerable to fires that affect all species that live in forests or depend on them for livelihood. The loss of large areas of forests to fires also affects the atmospheric carbon dioxide level, adding carbon to the air as the wood burns.
Periodic droughts are natural and normal, especially when they occur in the middle of large land masses. A drought involves one or two seasons of below-average precipitation. In farming country, that season’s crops will be poor or fail, but the farms will recover when the rain replaces the moisture in the soil the following year.
If there is low rainfall for a number of years in a row, however, as happened during the prolonged drought of the 1930s on the North American prairies, the result is desiccation. Soils dry out, even deep-rooted trees may die, and the vegetation may take years to recover. Lakes become ponds, rivers become creeks. The water evaporates but any pollutants remain, becoming more concentrated in smaller amounts of water. If fish and water plants die, so do the birds and land animals that feed on them. Clouds of dust are stirred up by the winds, blackening the skies and polluting the air, suffocating livestock, even stripping the paint off buildings and cars.
With prolonged drought, farmers may not be able to earn a living. People move away to search for jobs. Rural towns close down once there are not enough children to keep a school open, no customers for local stores and businesses.
Finally, if rainfall is consistently low for long periods, the ecosystem itself changes, turning into desert. The water table drops below the point where not even a few seasons of rain will replenish it. The fragile, thin layer of topsoil is blown away, even deep-rooted grasses and trees cannot find water, and the people and animals leave for good.
OCEANS WARM
Though land areas are warming more than the oceans, the seas are warming, too. The water warms at the surface and gradually mixes into deeper water, with the warming becoming smaller the deeper you go. The average warming has been .037°C (.066°F) in the past fifty years.6 It doesn’t seem like much, but that’s to a depth of 3,000 meters (10,000 feet). It takes a huge amount of heat energy to warm such a large volume of water.
Warmer sea temperatures affect first the plants and animals that live in the water. In general there are more fish in warmer waters, and they grow larger faster. But many sea creatures are extremely sensitive to temperature, and warming oceans can quickly change the location of the world’s commercial fisheries. Cod, for example, will migrate to warmer waters; salmon prefer cooler.
Warming sea temperatures also threaten the world’s coral reefs, home to 9 million different kinds of marine plants and animals. Coral reefs are among the oldest and richest ecosystems on the planet, but they are extremely fragile. Though they look like underwater gardens, they are actually made up of primitive animals called polyps. The polyps contain algae, which they need to live.
A number of things cause coral to expel their algae, including disease, shade, damage from ultraviolet radiation, changes in salinity and water temperature. If the water temperature rises just a degree or two, the polyps will expel their algae, leaving nothing but a white skeleton of calcium carbonate. If they do not replace their algae within weeks, the bleaching becomes permanent, and the corals die.
Warmer ocean waters also contribute to rising sea levels, because water expands with warmth, taking up more room.
Rising sea levels affect the world’s coastlines in many ways. Shorelines and beaches are eroded. Salty sea water seeps into low-lying delta areas, many of which are heavily populated and used for intensive farming. During storms, waves reach areas that were once too far inland to be affected.
Rising water levels have a dramatic effect on all species living by the sea, from nesting shore birds to humans. One-third of the world’s population lives within 100 kilometers (60 miles) of the sea, and more than half of the world’s twenty largest cities are on the coast. (A one-meter rise in sea level would be enough to flood most of New York City, including the subway system and all three major airports.8)
SNOW AND ICE MELT
When average global temperatures rise only a degree or two, the greatest and earliest warming takes place in the cold polar and mountain regions. As ice sheets shrink, there is less snow and ice to reflect sunlight back into space. Instead, the exposed land and dark oceans absorb the sun’s rays, warming the atmosphere even more. Glaciers shrink, reducing the meltwater feeding rivers that provide fresh water to cities far below. In some cases, as glaciers melt faster than normal, glacial lakes fill up, putting pressure on their fragile banks (often made up of piles of rock and debris left behind by the retreating glacier). When the banks burst, floods and landslides head downhill.
As sea ice melts, new sources of oil and minerals become accessible to drilling, and new shipping lanes open up. But the exposed shorelines are also more vulnerable to storm waves and erosion. Melting sea ice, such as the Arctic ice cap, does not contribute to rising sea levels, since the melted water takes up the same amount of room as the floating ice. However, melting ice sheets on land do release large amounts of fresh, cold water into the sea, which contributes to sea level rise and affects the ocean currents. And although the continental ice sheets on Greenland and Antarctica are still very thick and cold in the middle, once large masses of ice begin to thin and melt, the melting is difficult to stop. In Greenland, large glaciers are already thinning around the edges and flowing into the sea more quickly as meltwater seeps through cracks to the rock beneath, making the rock slippery and accelerating the slide.9 (The loss of polar ice may be counteracted by the increased precipitation that global warming will bring, but nobody knows for sure what will happen, especially in Antarctica.)
When permafrost (ground that is frozen year round) melts, once-solid ground turns into bog and becomes soft and unstable. Roads and runways crack, heave and sink. Buildings and pipelines shift and tilt on their foundations. Heavy trucks and machinery are no longer able to roll over frozen ground to reach isolated mining sites. Pools of meltwater sit stagnant in the summer, creating breeding grounds for mosquitoes.
Thawing permafrost also releases into the atmosphere carbon dioxide and methane — two major greenhouse gases long stored in the tundra’s frozen peat.
FRESH WATER SUPPLIES ARE THREATENED
Shifting precipitation patterns, increased evaporation and shrinking glaciers all affect the amount and location of the world’s fresh water — the water we all use to drink, wash and irrigate our food crops. But global warming also affects the quality of the water. Algae and microbes like warm water. Shallow lakes and rivers are more easily polluted than large, deep ones. Heavy rainfall and warm temperatures promote water-borne parasites that contaminate drinking water. Rising sea levels allow salt water to seep into freshwater coastal marshes and underground aquifers. A sudden spring melt can cause lakes and rivers to burst their banks, causing floods in valleys below, eroding mountainsides and draining freshwater reservoirs.
When the world’s freshwater supplies are threatened, important questions arise. What happens when a mountain glacier shrinks until it can no longer supply drinking water to the millions of people who live downstream (half the people in the world use mountain water to drink, grow food and run their power plants)? Who owns the world’s fresh water? Where do people who don’t have fresh water go?
HABITATS SHIFT
Global warming should be good news for plants. Carbon dioxide stimulates photosynthesis, speeding growth. Longer growing seasons and more precipitation should mean bigger yields — especially for heat-loving plants such as soybeans, grapes and tomatoes — and perhaps allow multiple harvests in a single season. New growing zones should open up, creating new forests and new carbon sinks to absorb atmospheric carbon dioxide.
But shifting vegetation belts can be a tricky business. Plants may spread their seeds into warmer zones, but rainfall may be sparse, or soils may be too thin or lacking in nutrients to support the new vegetation (deciduous trees need deeper soils than shallow-rooted conifers, for example). As areas warm, existing cool-weather species may become stressed by the extra heat and unable to fight off disease.
As well, growing belts do not shift in tidy, smooth lines, or at an even pace. Warm-weather species may creep north during a spell of milder winters, only to be zapped by an unusually harsh freeze. Fall-seeded food crops may survive milder winters, but so may weeds and insects.
Some plants should become thicker and hardier in a warmer climate, though some of the world’s most important food crops may not. Rice fertility drops 10 percent for each Celsius degree above 30°C (86°F) during the plant’s flowering.10 Five consecutive days of temperatures exceeding 35°C (95°F) can ruin a corn crop.11 Potatoes do badly when temperatures rise above 28°C (84°F).12 Apples and other fruit trees need winter chill to form buds.
And no one knows how livestock will adapt to the stresses of climate change, and what the consequences for beef, pork and lamb producers will be.
When vegetation belts shift, the wild animals that feed on the plants try to follow. But some are better travelers than others. Birds’ migration patterns are disrupted when their traditional resting and feeding stops disappear. Small, mobile animals are often the most adaptable (which is one reason why small mammals outlived dinosaurs during the mass extinction 65 million years ago). Crows, rats and flies, for instance, can thrive and reproduce almost anywhere.
Others will not be so lucky. As the world warms, forest fires, droughts, insect infestations and storms can destroy traditional habitats and force predators to move into neighboring ranges. These migrations can lead to new competitions for resources, changes in predation, even extinction for some species. The first and most dramatic impact would be on plants and creatures that already have limited ranges or a narrow supply of food sources, such as those that live in the mountains, polar regions or delicate marine ecosystems.
Because the Arctic ice is breaking up earlier in the summer, for example, polar bears, which hunt seals on the ice, have less time to put on enough weight to survive the winter and feed their young. A hunting season shortened by just one week can cause a polar bear to be 10 kilograms (22 pounds) lighter.14 Researchers note that it is cubs and old bears that are dying in the greatest numbers, which is what happens to many species, including humans, in times of food shortages.
And what about the effect of shifting habitats on human populations?
In the past, climate change has often forced groups of people to move in search of food and livelihood. But with more than 6 billion people on the earth, these migrations are no longer simply a matter of packing up one’s tent and following the caribou herd. Around the world, people have moved from rural areas to cities (by 2030, it is estimated that 60 percent of the world’s population will be living in cities15), away from places that are too hot, too wet, too dry. Many major urban areas are so crowded that settlements have spread out to less desirable land — along low-lying coastlines that are particularly vulnerable to ocean storms, or flood-prone deltas.
But if the effects of climate change — heat stress, floods, droughts, insect-borne diseases, water shortages, shifting food sources — become chronic, many, many people will be on the move. Those who can hunker down in air-conditioned buildings, who can afford to repair their storm- or flood-damaged homes and buy clean water will probably be able to stay put. But for the hundreds of millions in the world who are already struggling, living from one harvest to the next, in countries with limited infrastructure and unstable governments, the migration will be desperate and massive.
Where will these people go? A 2003 report commissioned by the US Pentagon concluded that climate change could create a security risk for the United States as early as 2020.16 With its large area, diverse climates, technological resources and wealth, the US would be better able to cope than most, but it may decide to defend its borders and coastline to keep out those fleeing their own countries.
The same thing could happen in other parts of the world. Central Europe, for instance, would become crowded with people fleeing from a thawing Scandinavia in the north and a drought-prone Mediterranean in the south.17
And all over the globe there would be a battle for the world’s arable land, energy and, especially, fresh water.
Chapter 5
The Frightening Numbers
Prediction is very difficult, especially about the future.
— Niels Bohr1
Scientists can tell us what the general effects of global warming will be, partly because of what has happened during warm periods in the past, and partly because the effects of the current warming can already be seen and measured in things like retreating glaciers and shifting habitats.
But scientists cannot tell us with absolute certainty the things many young people really want to know. How will climate change affect my house, my family, my
community, my livelihood? Which will be the “good” places to live when it is time to get a job, buy a house, raise a family? Exactly when will these changes take place? In my lifetime? Or not until my children’s generation?
One of the biggest problems with proposing action on climate change is that scientists are often unable to make specific predictions. And yet they are constantly asked to do so. Governments want hard facts before they introduce unpopular legislation that will force reductions in greenhouse gas emissions. Insurance companies want to know how much they may have to pay out for climate-triggered disasters. (Insurance claims from hurricane damage in the US in 2004 and 2005, for example, came to $90 billion.2) Investors and consumers want to know where to put their money. (Invest in wind energy or the Scandinavian wine industry? Spend extra for a hybrid car? Build a house on a hillside or by the shore?) And the media looks for short, attention-grabbing statements that will fit into a newspaper headline.
So climate centers do issue predictions (or “projections,” as they prefer to call them), based on computer models called General Circulation Models (GCMs). Researchers feed pieces of information into powerful supercomputers (the newest can perform quadrillions of operations a second) — data on the amount of greenhouse gases in the atmosphere, the location of land and water, soil depth, the earth’s rotation and orbit and many other factors. Sophisticated computer programs then apply the laws of physics to simulate the interactions between land, water, sunlight, air, ice, etc., and determine what the climate will be like over the next months, years, decades and even centuries.
Computer models are far from perfect — critics say their results are so broad as to be next to useless — because no matter how sophisticated the model, it can never factor in the many, many complexities that affect climate. A tiny physical, chemical or biological action can cause turbulence in the air or water that may trigger major reactions somewhere else. This notion that a small random change can affect a larger outcome is called chaos theory, and climate is a prime example of how it works, because it is affected by millions of random events. This is the phenomenon that allows it to be dry over your house, but raining over your friend’s house two blocks down the street.
Climate models also cannot resolve all the small-scale processes and features that drive day-to-day weather and, ultimately, climate. They cannot, for example, properly take into account the shape, height, thickness and size of clouds or predict what kinds of clouds there will be. Clouds are just too complicated. Some produce precipitation, some do not. Some block incoming solar radiation, some block outgoing heat. Climate models also cannot represent the effect of every heat-absorbing town or city, every valley or mountain.
As well, climate scientists can’t say exactly when or how warming may be offset by human forces (such as technological advances or changes in practice that result in reduced emissions) or natural forces (such as solar or volcanic activity). It is extremely difficult, for instance, to estimate how much carbon dioxide we will continue to produce — something that depends on how much our population and economies grow, whether we cut or plant forests, whether we develop alternative energy sources or invent a new way to make energy.
Today, atmospheric carbon dioxide levels are about 390 ppm. Even if we stabilize or reduce greenhouse gas emissions, the level would still rise to 450 ppm by 2100, because of the carbon dioxide already in the atmosphere and because carbon sinks are not keeping up with current emissions. If we continue to increase greenhouse gas emissions at the present rate (called the “business as usual” scenario), atmospheric carbon dioxide levels will double by 2100.3
And if emissions increase even faster,4 the news will be much worse.
As carbon dioxide levels rise, here are a few things climate models are predicting:
Average Global Temperatures Will Rise
All climate models say that temperatures will continue to rise. The most recent climate models predict that average global temperatures will rise by 3°C (5.5°F) by 2100,5 a rate of warming that has not occurred in at least 10,000 years.
Not every place in the world will become just a little bit warmer at the same time. Almost all land areas will likely warm more than the predicted average, and the biggest warming will occur in the northern polar regions. The changes will also not happen evenly or steadily. Despite the fact that 2004 was the sixth-warmest year on record, for example, in the northern hemisphere the spring of 2004 was one of the coldest.6
Sea Levels Will Rise
The IPCC predicts that average sea levels will rise by about 40 cm (15.75 inches) by 2100. New research suggests the rise will be even greater — a meter (3 feet) or more.7 Most of it will be due to the water warming and expanding, but about one-quarter of the rise will be caused by runoff from melting ice.8
No one predicts that the ice at the poles will melt completely, but with sufficient warming the West Antarctic Ice Sheet (WAIS) — a mass of ice propped up by island “pillars” — could become unstable enough to collapse and slide into the ocean, causing global sea levels to rise by several meters.
Snow and Ice Will Melt
As the Arctic and Greenland ice sheets melt, and with increased precipitation and river runoff, cold, fresh water will be released into the North Atlantic. A large enough influx would dilute the saltiness of the Gulf Stream. The current would become less salty and therefore less dense and no longer sink. Instead it would weaken and eventually stall, no longer bringing warm water from the southern Atlantic. The predictions vary, but some models expect the Gulf Stream will weaken by 20 to 50 percent by 2100, and some say the current will stall entirely in two hundred to three hundred years.13 One study reports that the ocean circulation in the North Atlantic has already weakened substantially.14
The results of a stalled Gulf Stream are uncertain, but many scientists think it could mean the collapse of the North Atlantic fisheries15 and cooler weather in some of the most heavily populated and economically active areas of the world (Great Britain could have a climate similar to that of Labrador), affecting everything from shipping (rivers and harbors would freeze up earlier) to crops (which would be more vulnerable to frost) and heating costs.
Modelers also predict that half the mass of mountain glaciers and small ice caps will melt by 2100.
Precipitation Patterns Will Change
Over all, annual precipitation will increase during the twenty-first century. But where will this precipitation fall, and when? Increased precipitation is predicted, for example, in Antarctica in winter, and in southeast Asia in summer. Australia, Central America and southern Africa, on the other hand, will receive less rainfall. The Mediterranean will receive less rain overall but more variable summer rainfall, increasing the likelihood of drought and flash floods. Increased drying during the summers in continental Africa and the North American prairies will reduce both the amount and quality of fresh water for irrigation, hydro power, water transportation and drinking.16
Vegetation Zones Will Shift
As climate zones shift, plant species will move into new growing areas, and the mix of species within areas will change. Most plants migrate at a rate of, at most, 1 kilometer per year,17 but if the planet warms by only 2°C (3.5°F) over the next century, species will have to migrate seven times faster.18 In intensively farmed mountain areas in countries near the equator, such as Ecuador and Rwanda, growing zones will move uphill.19 In the mid latitudes, agricultural zones are expected to shift 200 to 300 kilometers (320 to 480 miles) for every degree Celsius of warming.20
For humans, one of the biggest concerns is the future of the world’s cereal crops. There will be a longer frost-free season, and therefore longer growing season, in Canada, Scandinavia, Iceland and Australia. In western China, models predict the farming season will be extended by as much as one month. But in the North American prairies, the Mediterranean, Latin America and southern Africa, warming will be accompanied by decreased precipitation, which may mean there is not enough water for crops.
Scientists predict that global warming will not likely affect the world’s total food supply in this century. However, it will affect where food grows. Parts of the world already struggling, such as tropical and sub-tropical areas, will have fewer cereal crops. And if temperatures go up more than a few degrees Celsius, there will be an overall drop in agricultural activity, an increase in food prices around the world, as well as increased risk of famine in some developing countries. Warming of only 2°C (3.5°F) would, for example, make it too hot to grow coffee in Uganda — the base of the country’s economy.21
Animals Will Migrate and Adapt — or Not
Some animals will not be able to migrate or adapt quickly enough to survive the effects of climate change. At the current rate of warming, the Great Barrier Reef will be wiped out within fifty years.22 One study predicts that as a result of global warming, one-quarter of all land plants and animals — 1 million species — will either be extinct or becoming extinct by 2050.23 It would be the largest mass extinction since the disappearance of the dinosaurs 65 million years ago.
And what about humans? No one predicts that the human race will be wiped out because of climate change. But global warming is expected to increase threats to human populations, especially those already on the margins. People who live in tropical countries will likely face poorer water and air quality. One study predicts that by 2050, 150 million people will be displaced because of global warming — 100 million due to sea level rise and flooding and 50 million because of drought.24 Most models predict that disease-carrying species like mosquitoes and ticks will move with the warmer climate zones, bringing infectious diseases. Malaria already kills 2 million people each year, and 300 million to 500 million a year are affected. As the mosquito-borne disease moves into new territory, including Australia, North America and southern Europe, the local population’s natural immunity will at first be very low, increasing the mortality rate.
• • •
The predictions are alarming. Maybe too alarming? When the third IPCC report was released in 2001, some critics claimed that it painted an overly bleak picture of the future. But other studies have issued findings that are even more troubling.
 25
25
Here are just a few examples:
Avoiding Dangerous Climate Change Symposium26
A conference held in Exeter, England, in 2005 brought together one of the largest groups of climate change scientists since the 2001 IPCC report. Although the 2001 IPCC report predicted that the West Antarctic Ice Sheet (WAIS) was so cold that it would not melt for centuries, experts in Exeter reported early signs that the ice sheet could already be disintegrating.
Hadley Centre for Climate Prediction and Research27
In 2001 the British government commissioned the Hadley Centre (one of the world’s main climate modeling centers) to study the effects of climate change and its consequences, especially for Great Britain. The report took several years to complete and predicted that by the 2040s more than half of European summers will be warmer than that of 2003 (the year a heat wave killed more than 30,000), and by 2060 a summer like the one of 2003 would be considered unusually cool.
Arctic Climate Impact Assessment28
At the end of 2004, the world’s eight Arctic nations, including the US, released a 1,200-page study prepared over four years by more than three hundred scientists. The report suggested that the Arctic is warming at almost twice the rate of the rest of the world. The amount of sea ice is shrinking and the Greenland ice sheet is melting. The report predicts that in the next hundred years, Arctic temperatures will rise 4° to 7°C (7° to 12.5°F), and the permafrost line will retreat 300 kilometers (480 miles) north.
More recent studies reveal that both the Greenland ice sheet and the West Antarctic Ice Sheet are melting much more quickly than previously thought. Though the IPCC predicted that global sea levels would rise no more than a meter (3 feet) by the end of the century, new research predicts melting ice from Greenland and Antarctica will cause sea levels to rise several meters by 2100.29
• • •
Nobody knows for sure precisely how high carbon dioxide levels will rise, or what exactly will happen as a result. But climatologists are certain about one thing. Although some people will initially benefit from climate change (some industrialized countries, for example, will enjoy longer growing seasons), in general, global warming will bring more harm than good to humans.30 The problem is not just the fact of global warming — something the planet has experienced many times before. It is the speed of the warming, and the impact this will have on a crowded planet.
Chapter 6
The Tough Questions
There is no other planet to which we can turn for help, or to which we can export our problems. Instead we need to learn to live within our means.
— Jared Diamond1
The earth’s atmosphere is becoming warmer. This warming is happening unusually quickly because humans are adding greenhouse gases, especially carbon dioxide, to the air. The effects of this accelerated warming will be at best expensive and disruptive. At worst they will bring life-threatening catastrophe, especially for the poorest people of the world.
It is too late to avoid all the harmful effects of global warming. But we can try to slow down the advance — to give ecosystems time to adapt, to reduce the threat to the world’s fresh water and food supplies, and to prepare people of all nations to cope with the changes as best as they can.
It makes sense, then, to reduce the amount of carbon dioxide we are putting into the atmosphere.
There are two obvious ways to do this:
Reduce the amount of fossil fuels we burn. We will have to stop using these fuels eventually anyway, because there is a limited supply of gas, coal and, especially, oil underground.
It is ridiculous to think we can simply stop using energy, but we can reduce our dependence on fossil fuels by using energy less wastefully and more efficiently, and by replacing fossil fuels with other sources of energy. We need to find other ways to run our vehicles and machines and heat our buildings. Right now fossil fuels supply more than 80 percent of the world’s energy, but the technology exists for us to obtain much more from renewable sources such as wind, solar, geothermal and biomass (fuels made from plants and other organic material).
Preserve and manage the world’s existing forests, and plant new forests. Forests are carbon sinks, so by maintaining healthy forests, we can actually remove some of the carbon dioxide that is building up in the atmosphere.
This is the logical response to the problem of global warming.
So what is standing in the way?
We use a lot of energy, and our energy needs are growing quickly. This is partly because the world’s population is so big — 6.9 billion people and growing by 228,000 a day.4 Practices such as cutting down a dozen trees to build one house, clearing a field to keep a cow, burning coal to heat a room or cook a meal — even using a car to take one person to work — are no longer practical. More people, more homes, more cars and more industry equal more carbon dioxide emissions. Which means the problem is growing faster than we can keep up with it, because even while some try to reduce their energy consumption, others are using more and more. (Electricity generation, for instance, is expected to double by 2020, quadruple by 2060 and quintuple by 2100.5)
But the world’s growing energy needs are due to more than an expanding population. Societies of the industrialized world are based on producing and buying more and more goods, even though it is clear that the planet’s resources are limited. All the things that make up everyday life must be made, transported, used and thrown away, and each of these stages requires energy. We consume things, discard them, replace them, expand them — not just things we need but things we want, whether it is a new coat, house, car, computer or stereo. There is never enough because there is always a better or more stylish model, a new invention. Where you had one you can now have two, or more — cars, homes, phones, televisions.
Western culture, rapidly spreading throughout the globe, is based on acquiring stuff, and success is judged by whether one has more or better stuff than others. This is how economies grow and people and nations become rich. The whole idea of using less or producing less is unacceptable, so consumers are constantly encouraged to want more, buy more, use more.
Take the way we think about cars.
Next to electricity generation, one of the largest and fastest-growing sources of carbon dioxide emissions is road vehicles. Cars and trucks produce 30 percent of the world’s carbon dioxide emissions. There are more than 500 million cars on the road today, and millions of new vehicles are manufactured each year.6 (If every family in India and China owned a car, there would be one billion more cars on the roads.7)
Early on we learn that cars are more than just a way to get from place to place. Cars symbolize freedom and status. People can see right away what kind of car you drive, and that tells them what kind of person you are. Are you rich and cool or geeky and shabby? Your car says it all.
Cars are so expensive that most people have to borrow money to buy one. (The average Canadian spends more money owning and operating a car than on housing, food or education.8) Yet many families in industrialized countries have two or more. Most are driven with just one person in them. We buy new cars even when the old ones still work, because manufacturers keep coming up with new colors, styles and accessories — cars with iPod docks and phones, air-conditioners and seat warmers, built-in DVD players, mini fridges, navigation systems and crash-warning sensors.
Most cars can already go about as fast as highways will bear, so car companies make models that are more powerful, heavier and bigger, with more accessories. Things like air-conditioners, power windows and seat warmers add to fuel consumption by making cars heavier or by using more electricity. (The average vehicle contains forty pounds of wiring alone, needed to connect all of the car’s electrical components.9) Automobile manufacturers know that heavy, powerful cars contribute directly to the rising level of greenhouse gases because they use more fuel, but they make them because people want to buy them. SUVs, which have been called one of the fastest-growing causes of global warming,10 burn 45 percent more fuel than regular cars (even though they are mostly used for everyday driving in cities), but they have bigger profit margins because they are basically fancy pick-up trucks.
Cars even determine where and how we live. Modern suburbs are built for people who have cars. Shopping malls are surrounded by parking lots. There are drive-through restaurants, banks and libraries. Multi-lane highways, tunnels, bridges, overpasses and parking lots are built and then widened to accommodate growing amounts of traffic. (Two-thirds of the land in downtown Los Angeles is used for streets, highways and parking.11)
While people in industrialized countries drive their cars to their homes in the suburbs, people in the developing world look on. Almost half of the world’s people still live near or below the international poverty line of two US dollars per day. Yet through television and advertising they can see what they are missing, and they want to have the same thing.
They say they should not be the ones to suffer because the climate is changing. It’s not the developing world that created global warming by burning huge amounts of fossil fuels in the first place. Surely the rich countries (20 percent of the world’s population using 80 percent of the world’s resources12) should pay for the damage they have caused, as well as reducing their own energy use, while the developing countries catch up.
But the idea of reducing greenhouse gas emissions is, for many, simply unacceptable. Powerful forces — governments and corporations — actively campaign against climate change action by trying to dispute the science and by playing on the fears of people who don’t want to put their good life at risk. (The biggest and most profitable company in the world, ExxonMobil, has refused to invest in clean technologies and instead pressures governments to resist action on global warming.) Governments in industrialized nations want to avoid the hard political decisions required to reduce carbon dioxide emissions. Corporations fear that reducing the use of fossil fuels will mean reduced profits. Meanwhile, people in the developing world want their own economies to grow, which means using more energy.
It’s true that people are gradually using more energy from renewable energy sources, but so far these industries are far too small to fill the world’s needs, and each one has its drawbacks. Wind and solar power cannot be stored and must be backed up by other sources. And the initial setup costs are expensive. (It takes a lot of money and energy, for example, to make the photovoltaic panels needed to produce solar electric power.) The International Energy Agency predicts that by 2035 renewables (excluding biomass) will contribute only 7 percent of the world’s energy needs.18 Even nuclear power cannot fill the gap.
As well, renewable energy cannot be competitive unless consumers pay the true cost of burning fossil fuels. Governments often subsidize the fossil fuel industry — by providing money to help companies discover and develop new oil fields, by giving oil companies tax breaks. Subsidies mask the true price of the gasoline we buy at the pumps, at times making gas in the United States, for example, less expensive than bottled water. If people paid the true costs of transporting oil, cleaning up oil spills, the military costs of protecting access to oil, the cost to public health of smog and pollution produced by tailpipe emissions, fossil fuels would be far more expensive. Consumers would balk at paying so much of their incomes just to keep themselves warm and their appliances running, individuals and industries would use energy more efficiently, and the prospect of, say, using wind power or buying a hybrid car would be considerably more attractive.
Compared to reducing our dependency on fossil fuels, planting and preserving forests may seem to be an easy way to tackle global warming. Yet this, too, is not as simple as it sounds. Without careful supervision and management, only a fraction of replanted trees survive, so many more trees must be planted to replace those that have been cut. As well, it is difficult to recapture areas that were once forest because they have been used for farmland and cities. Sometimes the soils have been depleted and are no longer suitable for trees.
Meanwhile, our consumption of wood continues to grow. (In spite of the “paperless” promise of the internet, for example, we are using more paper than ever.20)
Tropical forests are especially difficult to preserve and replace, because they are such complicated ecosystems and because the people of developing countries have a growing need for cooking fuel, shelter and farmland. So much of the Amazon rainforest is being cleared for timber, cattle ranches and soybean farming that 40 percent of the remaining forest (the Amazon contains more than half of the world’s existing rainforests) is expected to be gone by 2050.21 Besides, developing countries deeply resent rich nations telling them not to cut their trees, when the greenhouse gas problem was created by the industrialized world in the first place. As one Brazilian official pointed out, “We’re not going to stay poor because the rest of the world wants to breathe.”22
Chapter 7
Facing the Music
Doubt, of whatever kind, can be ended in action alone.
— Thomas Carlyle
As with any difficult problem, there comes a point when it’s time to stop talking — and reading — about how and why we got into this situation, who is to blame, what the difficulties are and what might or might not happen in the future. There comes a time for action.
We have thrown our smartest scientists at the climate change issue, and they agree that global warming is real, it’s quickly getting worse, and its severity is due to human actions. So it is human actions that must solve the problem. We will waste valuable time if we keep worrying and stalling.
It’s time to face the music.
But where do we go from here? What’s to be done?
LESSEN THE IMPACT
Adapt
Even if we stop burning all fossil fuels today, the warming trend will continue for several decades, as the greenhouse gases already in the atmosphere continue to do their work. Scientists estimate that the world would have to reduce its carbon dioxide emissions by 40 to 60 percent just to stabilize the amount of carbon dioxide in the atmosphere.
It is obviously too late to avoid the effects of climate change completely, so plans must be put in place to deal with the warming that is already occurring.
This includes stopping development along reclaimed swamp land or coastlines that may be affected by rising sea levels or floods. Building dikes in low-lying, flood-prone areas and storm sewers to deal with run-off during flash floods in paved cities. Removing undergrowth from forests vulnerable to drought-triggered forest fires. Putting in place emergency procedures to help the poor and elderly during heat waves. Establishing early-warning systems to alert communities to floods and extreme weather, as well as evacuation procedures. Measuring, forecasting and securing freshwater supplies and building water-treatment facilities. Tracking and anticipating the spread of infectious diseases. Setting aside wildlife preserves and wilderness corridors to allow animals to migrate.
All these measures are sensible ideas for improving human health and safety anyway, and investing in prevention will be less costly than repairing the damage caused by floods, droughts and forest fires.
Reduce Emissions
Most companies and individuals in industrialized countries will not take voluntary action to reduce their carbon dioxide emissions. Many businesses insist that reducing the use of fossil fuels will mean the loss of jobs and lower profits. Most do not want to use less energy or pay more for clean energy.
It’s true that some corporations are realizing it is in their best interests to use some of their profits to take action on climate change. Not just because industry, with its huge appetite for energy, is a big part of the global warming problem and must therefore be part of the solution. Businesses don’t want to be left behind as fossil fuels are abandoned in favor of cleaner technologies. Some also see that reducing emissions can actually be profitable, and they know that governments can enforce carbon reduction policies. DuPont, a chemical company, has already reduced its greenhouse gas emissions to 65 percent below 1990 levels, beating its original 2010 tar- get date, and it expects solar products to generate $2 billion in revenue by 2014.1 In 2005, General Electric, once a big user of coal, pledged to reduce its carbon dioxide emissions and invest in clean technologies like renewable energy and hydrogen fuel cells, hoping that its own customers, such as electricity companies, would continue to buy GE products and follow its lead.5 Equally important, companies must urge governments to address global warming issues.
Elsewhere, corporations from software manufacturers to banks are retrofitting their offices to make them more energy efficient.
Still, the changes are not happening fast enough. So some governments are finally starting to take the lead, by taxing things they want to discourage (such as gas-guzzling vehicles), by subsidizing or removing taxes from things they want to encourage (such as public transit or fuel-efficient cars), by charging “congestion” fees for energy and transport use, and by enforcing reductions for large carbon dioxide emitters such as energy producers and automakers.
Some governments, for example, are rethinking the many ways they subsidize oil companies, keeping the price of oil artificially low, whether it is by providing money to find and develop new sources of oil or by reducing taxes on gasoline and heating oil. Developing countries such as Indonesia, Malaysia and Thailand are learning that keeping fuel prices low discourages conservation and fuel efficiency. It also means less money for needs like health care and education, and less money to invest in renewable energy.
In the United States, thirty-six states, tired of waiting for the federal government to enact climate change legislation, are taking their own action to reduce greenhouse gas emissions.6 In Oregon, any new gas-fired power plant is required to be 17 percent more efficient than any other gas-fired plant in the entire country.7 California pledged to reduce its greenhouse gas emissions to 1990 levels by 2020 (a 25 percent reduction).8 Improved fuel-efficiency standards set by state legislators are forcing automakers to reduce greenhouse emissions by as much as 30 percent by 2014, creating a rising demand for hybrid vehicles that run partly on gas and partly on batteries. The battery is recharged as the engine runs, and the cars routinely use half as much gas as regular vehicles.
Elsewhere, the state of West Australia has formed a partnership with an oil company, car company, fuel-cell manufacturer and university to fund three hydrogen fuel-cell powered buses in the capital city of Perth. And governments from China to Europe are subsidizing city buses that run on hydrogen, providing rebates or tax relief for people who buy hybrid cars, providing stable funding for buses, streetcars, trains and bike lanes.
Develop Renewable Energy Sources
Although it will be some time before wind, solar, geo-thermal, tidal and biomass can provide enough power to replace fossil fuels, the renewable energy field is growing. The countries of the European Union, for instance, plan to produce 20 percent of their electricity from renewable sources, mainly through wind power, by 2020.9 Scotland plans to generate 40 percent of its electricity with renewables by 2020 with onshore wind farms, wind turbines built offshore on former oil rig platforms, and by capturing ocean wave energy.10
Wind power is the fastest-growing source of energy today. The generating capacity around the world has tripled in the past five years, with countries like Denmark, Germany and Spain taking the lead. Germany is on track to supply 25 percent of its electricity with wind by 2025. To help make wind power competitive, producers are paid above-market prices for the power they feed into the grid, and the costs are shared by all the electricity users in the country. As a result, between 1990 and 2000, the average cost of manufacturing wind turbines in Germany fell by 43 percent. By 2020 half the population of Europe is projected to get its residential electricity from wind.11
North America is far behind. It supplies less than 2 percent of its electricity with wind, even though it has lots of wide-open spaces and coastlines that are ideal for wind turbines. But things are changing, and some states, provinces and communities are taking the initiative in the hopes of reducing their dependency on fossil fuels. Prince Edward Island (a Canadian province of 142,000) now supplies 18 percent of the province’s electricity with wind, and PEI plans to eventually generate all its electricity with wind.12 Windblown island communities like PEI and Unst in the Shetland Isles are investing in wind/hydrogen operations (using wind to create hydrogen that will power fuel cells at times when the wind doesn’t blow).
Other renewable energy industries are also making headway, sometimes with the help of oil companies that are hedging their bets by investing in other kinds of energy (BP, for example, is one of the top producers of photovoltaic panels). A power station on the Bay of Fundy in eastern Canada harnesses the energy of incoming and outgoing tides. The city of Stockholm is building biogas plants to turn sewage and organic waste into fuel. Elsewhere, the smart, organized people of Iceland are harnessing the steam from hot water that lies deep below their country to run turbines and produce hydrogen. Geothermal power, unlike wind and solar power, is constant, and the power is used to provide half of the country’s energy.13 In California, Nevada and Utah, geothermal power now produces as much energy as five nuclear reactors.14
Replacing fossil fuels with renewable energy may not be possible yet, but it will happen more quickly if governments help — by providing grants or loans for the construction of things like new wind turbines, and by requiring state-owned utility companies to purchase a percentage of their electricity from renewable sources. A study commissioned by Shell Oil claims that alternative energy sources could supply half the world’s energy needs by 2050.15
Develop New Technologies
Human invention and progress created the global warming problem, and now we must hope our ingenuity will help solve it, the way the invention of the car, airplane, electric light and computers have transformed modern life in the past. Some are even counting on clever engineers and scientists to come up with a way to combat global warming that will not require any of us to change our present behavior.
The ideas range from the fantastic (launching gigantic mirrors into space to deflect sunlight away from the earth) to the mundane (making roads white to reflect light), but they are all being pursued at some level. We would not have to reduce our consumption of fossil fuels, for example, if we could stop the carbon dioxide from going into the atmosphere — by capturing the carbon dioxide and pumping it into the cold water at the bottom of the ocean (deep ocean sequestration), or into old underground oil reservoirs or coal beds. Some of these solutions have good potential; pumping carbon back into rocks is already being done in Algeria and Saskatchewan, Canada. Others have potentially dangerous consequences (the damaging effects of extra carbon dioxide on ocean chemistry, for example, have only recently been recognized).
We would also not have to reduce our energy consumption if we could find another way to generate power, which is why some are pinning their hopes on the hydrogen fuel cell.
Instead of running on fossil fuels, fuel cells combine hydrogen (H2) and oxygen (O), causing an electrochemical reaction that produces water, heat and electricity. The oxygen is drawn from the air. The hydrogen can be obtained from a number of sources, from natural gas to plain water. Because there is no combustion, fuel cells produce no greenhouse gas emissions when they are used. But it does take energy to obtain the hydrogen in the first place. If the hydrogen is obtained from water (H2O), for example, the hydrogen (H2) and oxygen (O) molecules must be separated using an electric current (electrolysis) — a current that must be created by some outside source of energy.
Fuel cells can be used to power small items like laptops and cellphones, or they can be stacked to power factory generators or heat buildings. They can also be used to run cars.
In a fuel-cell car, instead of gasoline, hydrogen is stored in a pressurized tank, and the internal combustion engine is replaced by an electric motor powered by a fuel cell instead of a battery. Fuel cells in cars may one day even be used to run household appliances when the car is sitting in the garage. And the waste heat could be used to heat buildings or water.
Fuel cells have so much potential that governments, car manufacturers and energy companies are all investing in their development. Test buildings are being heated and powered by fuel cells — hotels in New Jersey, university residences in Toronto, homes in Belgium, businesses in Germany and Spain. Fuel cells are being used to run forklifts and delivery vehicles, and test cars are on the road in Vancouver, Orlando, Sacramento and Michigan.
But so far, the cost of making fuel cells is so high that heavy subsidies are required to attract customers. And there is a long way to go before they will be light, compact, powerful and durable enough to replace the internal combustion engine. As well, the hydrogen must be produced and stored in a compressed form, and a network of hydrogen refueling stations will have to be built. Fuel-cell fans argue that this network will expand naturally, just as a network of gas stations grew up when the first automobiles hit the roads, but most experts admit it will be several years, perhaps decades, before fuel-cell cars are a common sight.
Still, all these new technologies and areas of research must be pursued. That’s good news for today’s students, because global warming is opening up a whole range of opportunities and jobs for young scientists and engineers in a variety of disciplines. Food engineers are developing drought-resistant and salt-tolerant cereal crops. Epidemiologists and biologists are learning how best to cope with warming-triggered diseases and pests. Biologists are tracking bird and butterfly migrations. Engineers are addressing the important task of preserving the planet’s clean water, through conservation, efficient irrigation and desalination and purification techniques. Others are designing more energy-efficient cars, hybrid train locomotives that use half the fuel of traditional locomotives as well as reducing greenhouse gas emissions by up to 90 percent, and more efficient household appliances (in Japan you can buy a refrigerator that uses one-eighth the amount of energy as most ten-year-old fridges, and a buzzer sounds if you leave the door open for more than thirty seconds!16).
Meanwhile, climatologists carry on with their work — observing climate, improving computer models, studying ice cores and measuring glaciers. And in all fields, scientists continue to review the work of their peers and question and revise what they know. Because science does not sit still, especially the science of climate change.
Plant Trees
Although human populations are growing and spreading out, there are still plenty of places in the world where we can plant trees — increasing the areas of forests that act as carbon sinks.
China, for instance, plans to plant 35 million hectares (86.5 million acres) of new forest (“a great green wall”) by 2050.17 New carbon sinks are also being created in the southern and eastern US as abandoned farmland and logged areas are set aside for new forests. Japan, which supports one of the world’s highest population densities, has increased its forested areas to the point that 80 percent of the country is forested — the highest percentage of any industrialized nation.18
Meanwhile, botanical engineers are using pruning and planting techniques to develop fast-growing trees with denser root systems that will take in water and nutrients more efficiently. Other biologists are dispersing seeds to give trees a head start at expanding their range into new habitats.
SHARE THE BURDEN
Restraint for People in Rich Nations
Industrialized nations got rich by burning fossil fuels and creating the climate change problem in the first place. These countries continue to have higher per capita emissions of greenhouse gases than developing countries, because they are wealthy enough to consume wastefully. So shouldn’t it be up to these rich nations to assume most of the burden of fixing the problem?
For individuals, this means exercising some restraint at home. Domestic consumption accounts for 12 percent of the total energy use in industrialized countries,19 so people must make changes in their day-to-day lives to reduce the amount of energy they use. That means only using as much power as one really needs, and using it as efficiently as possible. It means considering the energy cost of everything we eat and use. Where and how was it made? How far did it come and how was it transported?
Some of the changes are pathetically simple and involve no hardship whatsoever. Choosing to heat up the lasagna in the microwave or toaster oven instead of turning on the big oven (a toaster oven uses half as much energy as a standard oven). Turning out the lights when no one is in the room. Turning down the thermostat in the winter and turning it up in the summer to save fuel in heating and air-conditioning. Turning off the computer at night (energy “vampires” such as TVs, modems, cordless phones and stereos suck power through their plugs even when they are turned off, making up 10 percent of a typical North American home’s energy use).
Many of these choices can be easily extended to the workplace. Japan, for example, has launched a nationwide campaign to encourage office workers not to wear jackets and ties in hot weather, allowing them to use less air-conditioning.20
More people are thinking before they buy, choosing goods that are energy efficient and last longer, and buying locally grown foods that haven’t been transported long distances. They are checking out energy-efficient appliances, battery-operated bikes and scooters and hybrid cars. (If everyone replaced their appliances with the most efficient models, electricity consumption would drop by more than half.21) Some are using public transportation more and driving less (a person driving alone in a car produces eight times as much carbon dioxide as someone taking public transit22), and considering whether big, heavy cars with lots of horsepower are really better than small, fuel-efficient ones. As the demand for public transit increases, the system becomes more efficient. Buses, streetcars and trains run more frequently, routes are expanded and more people are inclined to leave their cars behind.
Decisions like these reflect some hard thinking about what kinds of communities we want to live in. Neighborhoods with sidewalks, parks and easy access to public transit? Homes with solar water heaters, located where you can walk to school, work, the grocery store?
How much time and money do you want to spend driving? Do citizens have a right to drive cars? Should drivers of polluting cars have to pay more for parking? Should drivers be fined for idling their cars, which releases carbon dioxide into the atmosphere without even getting you anywhere? Should drive-through restaurants, where cars do little but idle, have to pay a penalty for encouraging pollution? Should they be banned altogether?
People are even questioning the need for air travel. Not only is carbon dioxide introduced into the atmosphere when fuel is burned (the airline industry emits twice as much carbon dioxide in a year as the entire country of India23); producing highly refined jet fuels uses vast amounts of energy, and cloud cover is affected by the water vapor in jet effluent trails.
Some energy-conservation tips may seem too small to make a difference. How can switching a lightbulb help fight global warming? Yet this is one of the easiest and most effective ways to reduce a family’s carbon dioxide emissions. Lighting uses one-fifth of the electricity brought into the average home. Compact fluorescent lightbulbs use one-quarter to one-third as much electricity as incandescent bulbs, and they last up to ten times longer. And if every household in the United States changed all its lightbulbs, for example, the growth in US carbon dioxide emissions could be stopped.24 Turning down the thermostat on the water heater (to 50°C/120°F) can save 540 kilograms (1,200 pounds) of carbon dioxide a year. Recycling a single aluminum pop can save enough energy to run a television for three hours.25
Besides, restraining our use of fossil fuels has other bonuses apart from fending off the worst effects of climate change — saving money, cleaner air, less traffic clogging cities, greener communities. And people who walk and bike instead of driving are healthier and less likely to be overweight than those who drive.
Smarter Progress for Poorer Nations
While rich nations restrain their own consumption, developing countries must catch up by improving their economies and lifestyles. But poorer nations can benefit from the knowledge rich countries have accumulated, and from the mistakes they have made.
Some developing countries, for instance, are already far ahead in terms of efficient, widely used public transit, car sharing, road tolls for private vehicles, widespread use of compact fluorescent lightbulbs, solar hot water heaters, small vehicles and buses run on alternative fuels or electric batteries. Bogotá, Colombia, has car-free days, a cheap, reliable bus system and a large network of bike and pedestrian routes connecting outlying parts of the city with downtown.26 Costa Rica invests heavily in wind energy and has vowed to phase out the use of all fossil fuels. China plans to build and refurbish 40,000 kilometers (25,000 miles) of high-speed rail network by 2015.27
 28
28
Developing countries may be in the best position to use new technologies, especially if industrialized nations will help them get set up, because their energy needs are still small, and many are not attached to a central power grid (one-third of the world’s population has no access to electricity from a central source29). Solar cooking stoves and wind turbines to pump water or charge batteries, for example, would mean huge advances for the people of poorer nations. So in the Himalayas, communities are developing small-scale hydroelectric schemes to provide villages with electricity without creating greenhouse gas emissions. In many parts of the developing world, biofuels made from renewable sources such as sugar cane, pig manure, rice hulls and coconut shells are being used to generate power in rural areas, boosting the economies of small communities.
Climate-friendly progress for developing countries is good for everyone. Poor nations cannot be allowed to lag farther behind. As writer Jared Diamond has pointed out, the world’s environmental trouble spots are also the world’s political trouble spots; the bigger the gap between rich and poor, the more politically unstable societies become.30
Climate change is such a large-scale problem that there is no magic bullet, no single solution. Instead we must pursue action on all fronts — adapt to the inevitable warming, pursue technological solutions, use energy wisely, reduce the gap between rich and poor nations, make polluters pay. This will require scientists, industry and governments at all levels to work together. And it will require all of us to sit up, pay attention and think about the consequences of our daily actions.
• • •
You could compare the world’s reaction to climate change to the people on the Titanic. The rich passengers in the first-class sections were busy eating fine meals, swimming in the ship’s pool and exercising in the gymnasium. The poorer people on the lower decks were busy feeding their babies and worrying about starting new lives on another continent. Down in the boiler room, tired stokers shoveled coal into the ship’s giant furnaces. And up in the cockpit, the captain and officers sat proudly, happy to be piloting the biggest, most modern, technologically advanced ship the world had ever seen.
Everyone was busy. Nobody saw the iceberg. Nobody was worried that there were not enough lifeboats.
Notes
1 Climate Change Is Here, and It’s Real
1. Stephen Byers, co-chair, International Climate Change Taskforce, on the release of “Meeting the Climate Challenge,” a report produced by the Institute for Public Policy Research (UK), the Centre for American Progress (US) and the Australia Institute, January 2005.
2. (Death toll in Russia) “The Great Russian Heatwave of 2010,” Australian Meteorological & Oceanographic Society, August 10, 2010, www.amos.org.au/news/id/83. (Flooding in Pakistan) Jay Gulledge, “Climate Risks: Lessons from 2010’s Extreme Weather,” Pew Center on Global Climate Change, August 23, 2010. (Record high temperatures) John Vidal, “World feeling the heat as 17 countries experience record temperatures,” August 12, 2010, guardian.co.uk. Record temperatures were set in Belarus, Ukraine, Cyprus, Finland, Qatar, Russia, Sudan, Niger, Saudi Arabia, Chad, Kuwait, Iraq, Pakistan, Burma, Ascension Island, Solomon Islands and Colombia.
3. Based on a chart provided by the Climatic Research Unit and the UK Met Office Hadley Centre, 2006, www.cru. uea.uk/cru/info/warming/.
4. US National Aeronautics and Space Administration (NASA), www.nasa.gov/topics/earth/features/2010-climate-records.html.
5. The size of the Larsen B ice shelf that disintegrated was 3,250 square kilometers (1,250 square miles), containing 500 billion metric tons of ice. About 87 percent of the glaciers on the Antarctic Peninsula (the finger of land that sticks up just below South America) are retreating. A.J. Cook et al, “Retreating Glacial Fronts on the Antarctic Peninsula Over the Past Half-Century,” Science, April 22, 2005.
6. Between 2000 and 2004 these lakes lost 50 percent of their volume. Bureau of Reclamation, Upper Colorado Region Water Operations, “Lake Power, Glen Canyon Dam – Current Status,” June 6, 2005, www.usbr.gov/uc/water/ crsp/cs/gcd.html.
7. Tim P. Barnett et al, “Penetration of Human-induced Warming into the World’s Oceans,” Science, July 8, 2005.
8. I-Ching Chen et al, “Rapid Range Shifts of Species Associated with High Levels of Climate Warming,” Science, August 19, 2011.
9. International Institute for Sustainable Development, International Year of Mountains, “Mountain Heritage of Pakistan: The Essential Quest,” 66. International Year of Mountains, www.mountains2002.org.
10. Timothy J. Osborn et al, “The Spatial Extent of 20th-Century Warming in the Context of the Past 1200 Years,” Science, February 10, 2006.
11. J. R. Petit et al, “Vostok Ice Core Data for 420,000 Years,” IGBP PAGES/World Data Center for Paleoclimatology Data Contribution series #2001-076. NOAA/NGDC Paleoclimatology Program, Boulder, 2001.
12. Edward J. Brook, “Tiny Bubbles Tell All,” Science, November 25, 2005.
13. Leaf pores shut down when there is lots of carbon dioxide in the air. Because trees, like all plants, take in carbon
dioxide to put on growth, rings in the trunk are thicker during years when carbon dioxide levels are higher. Bands on corals reflect seawater temperatures the same way tree rings reflect air temperature.
14. Michael Williams, Deforesting the Earth (Chicago: University of Chicago Press, 2003), 500; National Geographic Maps, A World Transformed, September 2002.
15. Linda McQuaig, It’s the Crude, Dude: War, Big Oil, and the Fight for the Planet (Toronto: Anchor, 2005), 333.
16. Thomas J. Crowley, “Causes of Climate Change Over the Past 1000 Years,” Science, July 14, 2000.
17. United Nations Framework Convention on Climate Change (NFCCC), United Nations Statistics Division, 2003, http://unstats.un.org/unsd/mi/.
18. Elizabeth Kolbert, “The Climate of Man - III,” New Yorker, May 9, 2005.
19. (Western Canada) In 2003, 250,000 hectares of forest burned down in British Columbia; 50,000 people were evacuated and damages totaled $550 million. Charles Anderson and Lori Culbert, Wildfire: British Columbia Burns (Vancouver: Greystone, 2003), 10. (Hudson Bay) Government of Canada, www.climatechange.gc.ca. (Atlantic beaches) Mark Lynas, High Tide: The Truth About Our Climate Crisis, (New York: Picador, 2004), 112. (US coast) Aristides Patrinos and Anjuli Bamzai, “Policy Needs Robust Climate Science,” Nature, November 17, 2005. (Costa Rica) Alan Pounds et al, Nature, January 12, 2006. (Antarctica) J. Turner et al, “Significant Warming of the Antarctic Winter Troposphere, Science, March 31, 2006. (Perth) Tim Flannery, The Weather Makers: How We Are Changing the Climate and What It Means for Life on Earth (Toronto: HarperCollins, 2005), 129. (Nepal) United Nations Environment Programme (UNEP), www.rrcap. unep.org/issues/glof. (Fiji and Samoa) Lynas, 113. (Yellow River) Y. Ding et al, “Yellow River at Risk: An Assessment of the Impacts of Climate Change on the Yellow River Source Region,” Greenpeace, 2005, http://activism. greenpeace.org/yellowriver/yrs_english_web.pdf. (China desert), Ecosystems and Human Well-Being Desertification Synthesis. (Northern Hemisphere) Intergovernmental Panel on Climate Change (IPCC) Third Assessment Report, Climate Change 2001, Synthesis Report (Cambridge: Cambridge University Press, 2001), 6. (Britain) National Geographic, September 2004.
2 How We Got Here
1. At a temperature of 33° to 42°C (91° to 107°F). Woods Hole Oceanographic Institute, “An Ocean Warmer Than a Hot Tub,” Oceanus, February 17, 2006.
2. Time-Life Books, The Natural World (Alexandria, Virginia: Time-Life Books, 1991), 87.
3. Clive Ponting, A Green History of the World: The Environment and the Collapse of Great Civilizations (New York: Penguin, 1991), 255, 256.
4. An area of 12,075 to 19,823 square kilometers per year, including up to 1,200 square kilometers of conservation lands. Gregory P. Asner et al, “Selective Logging in the Brazilian Amazon,” Science, October 21, 2005.
5. Ponting, 257.
6. The concrete industry is responsible for one-fifth of the
carbon dioxide emissions produced by humans, Carbon Dioxide Information Analysis Center,www.cdiac.esd.ornl. gov/ndp030/global00.ems.
7. Ponting, 253.
8. United Nations, World Population Prospects, Population Reference Bureau, www.prb.org; World Population Clock, US Census Bureau, www.census.gov/main/www/popclock. html.
9. National Geographic Maps, A World Transformed, September 2002.
3 How the Climate System Works
1. Yahai Lu and Ralf Conrad, “In Situ Stable Isotope Probing of Methanogenic Archaea in the Rice Rhizosphere,” Science, August 12, 2005.
2. Michael Williams, Deforesting the Earth (Chicago: University of Chicago Press, 2003), 436.
3. Based on IPCC Second Assessment Report (SAR), Climate Change 1995: Impacts. Adaptations and Mitigation of Climate Change (Cambridge: Cambridge University Press, 1996), www.grida.no/climate/vital/32.htm.
4. National Geographic, May 1998; Canadian Centre for Policy Alternatives, CCPA Monitor, October 2004; JJonathan Weiner, The Next One Hundred Years: Shaping the Fate of Our Living Earth (New York: Bantam, 1990), 182; Intergovernmental Oceanographic Commission, 2004; IPCC, Climate Change 2001: The Scientific Basis (Cambridge: Cambridge University Press, 2001), 188; John Houghton, Global Warming: The Complete Briefing, Third Edition (Cambridge: Cambridge University Press, 2004), 9.
4 The Effects of Climate Change
1. James Lovelock in a speech to the Canadian Nuclear Association, reported in Globe and Mail, March 10, 2005.
2. Children breathe in more air per pound of body weight than adults.
3. There has, for example, been no increase in the overall number of hurricanes and cyclones in the past hundred years.
4. One study says wind speed would rise by 5 percent for every 1 degree Celsius of warming in tropical ocean surface temperatures (tropical oceans have warmed 0.5°C in the past 50 years). Kerry Emanuel, “Increasing Destructiveness of Tropical Cyclones over the Past 30 Years,” Nature, August 4, 2005. Wetter, more intense hurricanes. Kevin Trenberth, “Uncertainty in Hurricanes and Global Warming,” Science, June 17, 2005. Another study showed there has been an 80 percent increase in intense hurricanes over the past 35 years. P.J. Webster et al, “Changes in Tropical Cyclone Number, Duration, and Intensity in a Warming Environment,” Science, September 16, 2005.
5. Bjørn Lomborg, The Sceptical Environmentalist: Measuring the Real State of the World (Cambridge: Cambridge University Press, 2001), 299.
6. National Oceanographic Data Center, Maryland, published in Geophysical Research Letters, cited in Guardian Weekly, February 4-10, 2005.
7. Symposium, May 2004, Paris, organized by UNESCO’s Intergovernmental Oceanic Commission and International Council for Science’s committee on oceanic research, http://ioc.unesco.org/iocweb/co2panel/highoceanco2.htm; report issued by Royal Society, June 30, 2005, quoted in New York Times, July 1, 2005.
8. Edward Goldsmith and Caspar Henderson, “Global Warming Threatens the World Economy,” in Mary Williams, ed., Is Global Warming a Threat? (San Diego: Greenhaven, 2003), 68.
9. The speed of the Kangerdlugssuaq Glacier in eastern Greenland, one of the island’s largest, increased 210 percent between 2000 and 2005, and it is now moving toward the sea at a rate of 12 kilometers a year. Eric Rignot and Pannir Kanagaratham, “Changes in the Velocity Structure of the Greenland Ice Sheet,” Science, February 17, 2006. On the Antarctic Peninsula, 87 percent of glaciers have retreated in the past sixty years. A.J. Cook et al, “Retreating Glacier Fronts on the Antarctic Peninsula over the Past Half-Century,” Science, April 22, 2005.
10. Bill McKibben, “Worried? Us?” This Overheating World, Granta, Fall 2003.
11. Jonathan Weiner, The Next One Hundred Years: Shaping the Fate of Our Living Earth, (New York: Bantam, 1990), 106.
12. Edward Goldsmith, “Massive Campaign Needed to Slow Down Global Warming,” CCPA Monitor, Canadian Centre for Policy Alternatives, October 2004.
13. Jeffrey E. Lovich, “Turtles and Global Climate Change,” Impact of Climate Change and Land Use in the Southwestern US, US Geological Survey, November 25, 2003, http://geochange.er.usgs.gov/sw/impacts/biology/turtles.
14. Government of Canada, www.climatechange.gc.ca/
Manitoba.
15. Steven Loranger, “The Water Century,” The Globalist, March 4, 2005.
16. Peter Schwartz and Doug Randall, “An Abrupt Climate Change Scenario and Its Implications for United States National Security,” October, 2003, www.environmental defense.org/documents/3566_AbruptClimateChange.pdf.
17. Jacqueline McGlade, executive director, European Environmental Agency, quoted in Globe and Mail, May 21, 2005.
5 The Frightening Numbers
1. Niels Bohr, physicist and Nobel Prize winner, 1885-1962.
2. Agnes Sinai, “The Cleanliness Business,” Le Monde Diplomatique, March 2006.
3. According to the 2007 IPCC report, CO2 levels will range from 535 to 983 ppm by 2100, 41 to 158 percent higher than current levels. IPCC, Climate Change 2007: The Physical Science Basis.
4. At the current rate of increase, the International Energy Association (IEA) expects greenhouse gas emissions to increase by 60 percent by 2030. Patrick Brethour, “IEA Says Policies Inadequate, Emissions Will Jump 60%,” Globe and Mail, October 27, 2004.
5. According to the 2007 IPCC report, average global temper-atures will rise 1.8 to 4°C by 2100. An increase in the fre-quency of heat waves and events of heavy rainfall is “very likely” (probability greater than 90 percent). It is “likely” (probability greater than 66 percent) that there will be an increase in areas affected by droughts and in the intensity of tropical storms.
6. The central and northeast US, for example, experienced a much colder than average summer. WMO Statement on the Status of the Global Climate in 2004, World Meteorological Organization.
7. Justin Gillis, “Rising Seas, and a Looming Catastrophe,”New York Times, November 21, 2010.
8. The IPCC calculations do not consider the disintegration of the Greenland or West Antarctic ice sheets, which are losing 150 square kilometers (58 square miles) of ice each year. Kennedy Warne, “Dance of a Dangerous Sea,” Canadian Geographic, October 2008.
9. Mauri S. Pelto, “Recent Global Glacier Retreat Overview,” North Cascade Glacier Climate Project, August 30, 2011, www.nichols.edu/departments/glacier/glacier_retreat.htm.
10. Susan Joy Hassel et al, “Impacts of a Warming Arctic,” Arctic Climate Impact Assessment (ACIA), www.amap.no /acia/.
11. F.S. Chapin et al, “Role of Land-Surface Changes in Arctic Summer Warming,” Science, October 28, 2005.
12. Mark Lynas, “Hot News,” This Overheating World, Granta, Fall 2003.
13. Quirin Schiermeier, “A Sea Change,” Nature, January 16, 2006; Houghton, 136.
14. Although most climate models do not predict a significant slowdown until the end of the century, a recent study reports that circulation in the north Atlantic has weakened by 30 percent over the past fifty years. H.L. Bryden et al, “Slowing of the Atlantic Meridional Overturning Circulation at 25°N,” Nature, December 1, 2005.
15. Collapse of fisheries will be largely due to the depletion of North Atlantic plankton stocks by up to 51 percent;
plankton form the base of the marine food chain. Andreas Schmittner, “Decline of the Marine Ecosystem Caused by a Reduction in the Atlantic Overturning Circulation,” Nature, March 31, 2005.
16. Filippo Giorgi, “Climate Change Hot-Spots,” Geophysical Research Letters, April 21, 2006.
17. Houghton, 170.
18. Mark Lynas, High Tide: The Truth About Our Climate Crisis (New York: Picador, 2004), 23-24.
19. Moving 500 meters up a mountain is like moving 250
kilometers north. Jonathan Weiner, The Next One Hundred Years: Shaping the Fate of Our Living Earth (New York: Bantam, 1990), 178.
20. United Nations Framework Convention on Climate Change (UNFCCC), Beginner’s Guide, 1994, www.unfccc. org/resources/beginner.html.
21. Mark Maslin, Global Warming: Causes, Effects and the Future (Osceola, Wisconsin: Voyageur, 2002), 53.
22. Queensland Centre for Marine Studies, www.marine.uq. edu.au.
23. Number of species “committed to extinction” is estimated at 15 to 37 percent. Chris D. Thomas et al, “Extinction Risk from Climate Change,” Nature, January 8, 2004.
24. Houghton, 187.
25. (Northwest Passage) “Impacts of a Warming Arctic,” Arctic Climate Impact Assessment, 2004, www.amap.no/acia/. (Polar bears) National Geographic, September 2004. (Great Lakes) Government of Canada, www.adaptation.nrcan. gc.ca. (Missouri and Upper Mississippi basins) Houghton, 160. (Louisiana) National Geographic, October 2004. (British Columbia) Government of British Columbia, www.for.gov.bc.ca/hfp/mountain_pine_beetle/. (Peru) International Strategy for Disaster Reduction, www.eird. org. (Southern Europe) Houghton, 130. (China) World-wide Fund for Nature, quoted in Houghton, 152. (South Pacific) Michael C. Howard, ed., Asia’s Environmental Crisis (Boulder, Colorado: Westview, 1993), 13-14. (Nile) Lynas, 113-14. (Coral reefs) Andrea G. Grottoli et al, “Hetero-trophic Plasticity and Resilience in Bleached Corals,” Nature, April 27, 2006.
26. Avoiding Dangerous Climate Change, www.stabilisation
2005.com.
27. Hadley Centre, Uncertainty, Risk and Dangerous Climate Change: Recent Research on Climate Change Science from the Hadley Centre, December 2004, www.metoffice.com/
research/hadleycentre.
28. “Impacts of a Warming Arctic,” Arctic Climate Impact Assessment (ACIA).
29. Julian A. Dowdeswell, “The Greenland Ice Sheet and Global Sea-Level Rise,” Science, February 17, 2006; Jonathan T. Overpeck et al, “Paleoclimatic Evidence for Future Ice-Sheet Instability and Rapid Sea-Level Rise,” Science, March 24, 2006.
30. “More people are projected to be harmed than benefited by climate change, even for global mean increases of less than a few °C.” IPCC, Climate Change 2001: Impacts, Adaptation, and Vulnerability, (Cambridge: Cambridge University Press, 2001), 8.
6 The Tough Questions
1. Jared Diamond, Collapse: How Societies Choose to Fail or Succeed (New York: Viking, 2005), 521.
2. Leopold Center for Sustainable Agriculture, www.leopold. iastate.edu; Worldwatch Institute, www.worldwatch.org.
3. Energy Information Administration, 2006 data, www.eia.gov/iea/overview.html.
4. Population Reference Bureau, www.prf.org.
5. International Energy Association, www.iea.org.
6. John Whitelegg, “The Global Transport Challenge,” Open Democracy, April 26, 2005; World Book 2001; Peter Gwynne, “Green Cars Move into Top Gear,” Physics World, July 2002.
7. Mark Maslin, Global Warming: Causes, Effects and the Future (Osceola, Wisconsin: Voyageur, 2002), 22.
8. Tim Grant and Gail Littlejohn, Teaching About Climate Change: Cool Schools Tackle Global Warming (Gabriola Island, BC: New Society, 2001), 52.
9. Globe and Mail, “To Lose Pounds, Even Wires Get Skinny,” June 2, 2005.
10. Linda McQuaig, It’s the Crude, Dude: War, Big Oil, and the Fight for the Planet (Toronto: Random House, 2004), 5.
11. Clive Ponting, A Green History of the World: The Environment and the Collapse of Great Civilizations (New York: Penguin, 1991), 213.
12. United Nations Framework Convention on Climate Change Beginner’s Guide, 1994, www.unfccc.org/resource /beginner.html.
13. World Bank, “China Quick Facts,” web.worldbank.org.
14. Stephen Kurczy, “China energy use surpasses US. Who didn’t see that coming?” Christian Science Monitor, July 20, 2010.
15. “Changes in Vehicles per Capita around the World,” US Department of Energy, Energy Efficiency & Renewable Energy, April 5, 2010, www1.eere.energy.gov/vehiclesandfuels/facts/2010_fotw617.html.
16. Keith Bradsher, “China Outpaces U.S. in Cleaner Coal-Fired Plants,” New York Times, May 11, 2009.
17. World Bank, “China Quick Facts,” web.worldbank.org.
18. IEA, World Energy Outlook 2010, www.iea.org/work/2011.
19. Andrew Heintzman and Evan Solomon, eds., Fueling the Future: How the Battle Over Energy Is Changing Everything (Toronto: Anansi, 2003), 135.
20. Michael Williams, Deforesting the Earth (Chicago: University of Chicago Press, 2003), 496.
21. Britaldo Silveira Soares-Filho et al, “Modelling Conservation in the Amazon Basin,” Nature, March 23, 2006.
22. Chicago Tribune, March 12, 1989, quoted in Williams, 499.
7 Facing the Music
1. In 2011, DuPont acquired a company that licenses solar cell technology. Ucilia Wang, “Good Timing: What DuPont Gains by Buying Innovalight,” Renewable Energy News, July 26, 2011.
2. Margaret Beckett and Patricia Hewitt, British Secretaries of State for Environment, Food and Rural Affairs and for Trade and Industry, “Naysayers, Take Note: Britain Is Pro-Kyoto and Prospering,” Globe and Mail, March 15, 2005.
3. Committee on Science, Engineering and Public Policy (COSEPUP), Policy Implications of Greenhouse Warming: Mitigation, Adaptation, and the Science Base (Washington, DC: National Academy of Sciences, 1992), 201.
4. The Climate Group, °C, June 18, 2006, www.theclimate
group.org/index/php?pid=400.
5. “The Greening of General Electric,” The Economist, December 10, 2005.
6. “Climate Change 101: State Action,” Climate Change 101: Understanding and Responding to Global Climate Change, Pew Center on Global Climate Change, January 2011.
7. Oregon Department of Energy, “Oregon Carbon Dioxide Emission Standards for New Energy Facilities,” www.
oregon.gov/ENERGY/SITING/docs/ccnest.pdf.
8. The Global Warming Solutions Act of 2006.
9. “And now, the electricity forecast,” The Economist Technology Quarterly, June 12, 2010.
10. Scottish Executive Renewable Policy Document, “Securing a Renewable Future: Scotland’s Renewable Energy,” www.scotland.gov.uk/publications/2003/03/16850/20554.
11. Janet L. Sawin, “Run with the Wind,” New Internationalist, January 2004; European Wind Energy Association, www. ewea.org/doc/20gw%20briefing.pdf.
12. Canadian Wind Energy Association, www.canwea.ca.
13. Arno Kopecky, “Water to Burn,” The Walrus, December/January 2006.
14. Geothermal Education Office, http://geothermal.marin. org/map/usa.html.
15. Shell press release, October 13, 2003, www.shell.com.
16. Ecologist, July/August 2005, 11.
17. Matt Walker, “A Nation Struggling to Catch Its Breath,” New Scientist, April 29, 2006.
18. Jared Diamond, Collapse: How Societies Choose to Fail or Succeed (New York: Viking, 2005), 294.
19. Heintzman, 310.
20. The campaign is called Cool Biz and officials say the country could save 1.9 million barrels of oil a year if office thermostats were set at 28°C instead of 25°C, as well as helping Japan to meet its Kyoto requirements (6 percent below 1990 levels by 2012). Globe and Mail, “Japan Saves Energy, Loosens Up with ‘Cool Biz’ Campaign,” June 1, 2005.
21. John Houghton, Global Warming: The Complete Briefing, Third Edition (Cambridge: Cambridge University Press, 2004), 279.
22. Tim Grant and Gail Littlejohn, Teaching About Climate Change: Cool Schools Tackle Global Warming (Gabriola Island, BC: New Society, 2001), 52.
23. Richard Adams, quoted in Heather Mallick, “When Aviation Falls to Earth,” Globe and Mail, January 29, 2005.
24. Howard Geller, “Compact Fluorescent Lighting,” American Council for an Energy Efficient Economy, www.aceee.org.
25. “Energy Matters,” Canadian Geographic, May/June 2003.
26. The city has a 200-kilometer network of bicycle and
pedestrian paths. www.velomondial.net/velomondial/2000/ pdf/pacheco.pdf.
27. “China to Have 40,000 km of High Speed Railways by End of 2015,” Business China, September 30, 2010, http://en.21cbh.com.
28. (Iceland) A. Kopecky, The Walrus, December/January 2006. (Philadelphia) Rohm and Haas, www.rohmhaas.com/roof/ coolroof. (Los Angeles) Charles Petit, “Power Struggle,” Nature, November 17, 2005. (Chile) Dave Ebner, “Trans-Alta, Chilean Firm Strike Emissions Swap Deal,” Globe and Mail, August 25, 2004. (Denmark) Greenpeace newsletter, Summer 2004; www.windenergy.org. (Europe) National Geographic, August 2005. (Mongolia) Houghton, 299. (Yangtze River) Emma Young, “Flood Warnings for the Yangtze Will Save Lives,” New Scientist, September 17, 2005. (Taipei) World Car Free Day, www.worldcarfree.net/
wcfd/; Mobility Week Europe, www.mobilityweek.europe.
org/part/campaign_presentation_2004.html.
29. Houghton, 299.
30. Diamond, 497, 515-16.
31. The Kyoto Protocol had its origins at the UN Conference on Environment and Development, held in Rio de Janeiro, Brazil, in 1992. Known as the Earth Summit, the
conference was attended by 30,000 participants from 178 governments. The Earth Summit identified climate change as one of the three major issues threatening the environment (the others were biodiversity and forests). Participants drafted the UN Framework Convention on Climate Change, a voluntary agreement, now ratified by 188 countries, to lower the emission of greenhouse gases, especially carbon dioxide. But five years later, greenhouse gas emissions had actually risen overall. It was clear that the international community needed a formal, legally binding agreement that would include specific targets for reducing greenhouse gases. In December 1997, this agreement was drafted in Kyoto, Japan, at a conference attended by 6,000 delegates from more than 160 countries. The Protocol would become legally binding after at least 55 countries, responsible for at least 55 percent of the greenhouse gas emissions produced in 1990, agreed to reduce their emissions. Because the US, which is responsible for more than one-third of the world’s greenhouse gas emissions, refused to sign, almost all the remaining industrialized countries of the world had to come on board in order for the treaty to become law. This finally happened in November 2004, when Russia ratified Kyoto.
32. The 2007 IPCC report (“Climate Change 2007: Mitigation of Climate Change”) predicts that without additional action by governments greenhouse gas emissions will rise by 25 to 90 percent by 2030.
Glossary
albedo The brightness of a surface that determines how much light the surface reflects rather than absorbing it as heat. Snow has a high albedo; dark rock and vegetation-covered surfaces have a low albedo because they absorb sunlight and turn the energy into heat.
atmosphere The gases surrounding the earth.
carbon cycle The circulation of carbon in its various forms between the atmosphere, the land and the ocean.
carbon sink Something (oceans, plants, etc.) that removes carbon from the atmosphere and stores it.
chlorofluorocarbons (CFCs) Human-made compounds used in refrigeration, foaming agents and aerosol sprays. CFCs destroy atmospheric ozone. They are also powerful greenhouse gases.
climate The average weather that prevails in a certain area over a long period of time.
cyclone A low-pressure system with intense rain and wind activity occurring over tropical or sub-tropical waters. In the Atlantic Ocean and in the Pacific Ocean east of the International date line such storms are called hurricanes; in the Pacific Ocean west of the date line they are called typhoons; in the Indian Ocean they are called cyclones.
El Niño A natural phenomenon that occurs when a large stretch of the southern Pacific Ocean becomes superheated and flows toward South America, bringing intense storm activity and disrupting weather patterns around the world.
fossil fuel Coal, oil or natural gas formed from the decayed remains of ancient animals and plants.
fuel cell A device that produces electricity from a chemical reaction of oxygen and hydrogen.
General Circulation Models (GCMs) Computer programs designed to predict what will happen to the earth’s climate.
geothermal energy Energy obtained from heat deep below the earth’s crust.
global warming The gradual increase in the overall average temperature of the earth’s surface, caused by the greenhouse effect.
Greenhouse Effect Warming of the earth’s atmosphere caused by gases that trap heat emitted from the ground.
greenhouse gas One of several gases, including water vapor, carbon dioxide and methane, that trap heat, creating the greenhouse effect.
hydrologic cycle The circulation of water in its various forms between the atmosphere, the land and the oceans.
hydro power The use of water power to generate electricity.
ice age A period in the earth’s history when temperatures were low and much of the earth’s surface was covered by snow and ice. Ice ages are interrupted by warmer interglacial periods.
Industrial Revolution The change from a primarily farming to industrial society that occurred in Europe and North America during the nineteenth century.
Intergovernmental Panel on Climate Change (IPCC) The international scientific body that assesses global warming.
jet stream A band of westerly winds that prevails in the mid latitudes of each hemisphere.
monsoon Seasonal periods of heavy rainfall in sub-tropical regions.
permafrost Land that is frozen year round.
renewable energy An energy source (such as sun or wind) that cannot be used up.
stratosphere The layer of atmosphere that sits between 10 to 50 kilometers (6 to 31 miles) above the earth’s surface.
thermohaline circulation (THC) Circulation in the world’s oceans, driven by different water densities determined by temperature and salinity.
troposphere The layer of lower atmosphere up to a height of 10 kilometers (6 miles).
tundra Treeless habitat of the Arctic.
weather The day-to-day conditions in the atmosphere in a specific place.
For Further Information
Dozens of articles, books and websites were used in the research of this book. Many are listed in the notes on pages 115 to 129. But the science of global warming is changing so rapidly that sources are often quickly outdated. Reliable websites are often the best source for current information (look for the dates the information was posted; they can be hard to find).
Here are a few:
Intergovernmental Panel on Climate Change (IPCC)
Established by the World Meteorological Organization and the United Nations Environment Programme to assess the scientific, social and economic issues surrounding human-induced climate change.
www.ipcc.ch
United Nations Environment Programme (UNEP)
Outlines strategies for addressing climate change, based on the UN Framework Convention on Climate Change (UNFCCC) and the Kyoto Protocol. Links to special pages for youth.
www.unep.org/climatechange
Science and Development Network
Covers scientific and technological issues from the perspective of the developing world. Pages devoted to climate change and environmental issues include news, recent studies and editorials.
www.scidev.net
Climate Action Network
More than 340 NGOs working to promote government and individual action to limit human-induced climate change to ecologically sustainable levels; provides links to offices around the world for information on regional concerns and initiatives.
www.climatenetwork.org
Climate Ark and Climate Wire
Two search engines and information services that direct users to climate change websites and recent news releases.
www.climateark.org
www.climatewire.org
Acknowledgments
The author and publisher would like to thank Maria Luisa Crawford, Greg Flato, Danny Harvey and John Houghton for their helpful comments and critique of the manuscript. Thanks also to Jessica Abraham, Keith Abraham, Ryan Bergen and Leon Grek for editorial assistance, fact-checking and additional research.
Index
ACIA. See Arctic Climate Impact Assessment
acid rain, 39
adaptation to global warming, 91-92, 113
aerosols, 40
Africa, 13, 27, 37, 71, 72, 111
agriculture. See farming
air travel, 106-107
Alaska, 69
albedo, 42, 56, 131
Algeria, 99
Alps, 21
alternative energy. See renewable energy
aluminum, 29
Amazon, 88
Antarctica, 12, 15, 16, 20, 41, 56, 71, 77
Arctic, 12, 13, 24, 56, 61, 68, 76-77
Arctic Climate Impact Assessment (ACIA, 2004), 76-77
Argentina, 20, 29
Arrhenius, Svante August, 38
Asia, 13, 26, 27, 71
asphalt, 80
asthma, 39, 48
Atlantic Ocean, 20, 36-37, 49, 68-70. See also Gulf Stream
atmosphere, 34-36, 131. See also stratosphere, troposphere
Australia, 13, 19, 21, 29, 71, 72, 73, 94
automobiles. See cars
Avoiding Dangerous Climate Change Symposium (2005), 76
Bangladesh, 19, 55
Barcelona, 110
barley, 69
Basel, 105
Bay of Fundy, 96
beavers, 69
beetles, 17
forest infestation by, 51, 69, 74
Belgium, 100
biomass, 79, 86, 95, 96, 109
birches, 51
birds, 14, 60, 97, 101
Bogotá, 105, 109
Bohr, Niels, 64
BP, 93, 96
Brazil, 27, 28, 112
British Columbia, 107, 117
Browning, Robert, 24
butterflies, 14, 101
Byers, Stephen, 9
California, 94, 98
Canada, 13, 19, 20, 29, 72, 96, 110
carbon, 18, 42, 47
carbon cycle, 42-45, 130
carbon dioxide
and fossil fuels, 15, 18, 38, 44
and oceans, 54
and photosynthesis, 59
and temperature, 16-17, 38
as a greenhouse gas, 34-35, 78
atmospheric, 18, 29, 30, 34, 43-45, 47, 58, 67, 79
Carbon Dioxide and Temperature (graph), 15
Carbon DioxideEmissions Per Capita (chart), 19
Carbon Dioxide in the Atmosphere (chart),
44
emissions, 18-19,
66-67,
81,
82,
87,
91, 92, 94, 104, 105, 108
sequestration, 99.See also carbon sinks
carbonic acid, 54
carbon sinks, 15, 43-45, 47, 59, 79, 102, 130
caribou, 62
Carlyle, Thomas, 90
cars, 18, 26, 30-31, 39, 82-84, 85, 94, 104-106
Car Free Days, 105, 109, 111
car sharing, 105, 109
fuel cell, 100-101
fuel efficient, 80, 93, 104, 105
hybrid, 65, 88, 94, 95, 104, 105
catalytic converters, 39
cedars, 51
cement. See concrete
Central America 71, 72
cereal crops, 71-72, 101. See also barley, corn, oats, rice
CFCs. See chlorofluorocarbons
chalk, 42
chaos theory, 66
Chernobyl, 87
Chile, 110
China, 13, 17, 19, 21, 28, 31, 72, 75, 83, 85, 95, 102, 109, 111, 112, 113
chlorofluorocarbons (CFCs), 35, 41, 130
cities, 26, 56, 62, 85
Climate Action Network, 134
Climate Ark, 134
climate system, 33-45, 130
Climate Wire, 134
clouds, 40, 42, 66
coal, 18, 26, 28, 39, 45, 81, 85, 92, 99. See also fossil fuels
cod, 53
coffee, 72
Colombia, 14
Columbia Glacier, 69
compact fluorescent lightbulbs, 108, 109
computer models. See General Circulation Models
concrete, 29
congestion charges, 93, 110
consumerism, 82
continental shift, 24
Cool Biz, 104, 127
Copenhagen, 105
Copenhagen Accord, 113
copper, 29
coral reefs, 14, 53, 54, 75, 116
corn, 60
Cornwall, 38
Costa Rica, 20
crocodiles, 24
crops. See farming, food crops
crows, 60
cyclones, 130. See also hurricanes, tropical storms
Denmark, 95, 111
deserts, 21, 44, 52
Diamond, Jared, 78, 112
dinosaurs, 25, 60, 73
drought, 9, 13, 20, 21, 32, 48, 50-52, 60, 62, 73, 91, 92
DuPont, 92
Earth Summit, 128-29
Ecuador, 71
Egypt, 17
electricity, 18, 81-82, 104
elephants, 25
El Niño, 49, 131
energy, 29, 30, 32, 81-82, 103. See also renewable energy
efficiency, 93, 94, 101, 103-104
Where the World’s Energy Comes From (chart), 81
environmental groups, 106-107
Esso. See ExxonMobil
Europe, 11, 13, 63, 73, 75, 85, 95, 96, 110, 111
2003 heat wave, 9, 48, 76
European Union, 95
Exeter, 76
extinctions, 72-73
ExxonMobil, 86, 106-107
farming, 26-28, 47, 54, 55. See also food crops
feedbacks, 47
Fiji, 21
firs, 51
fishing industry, 70
flies, 60
floods, 9, 21, 49-50, 55, 62, 74, 75, 91, 92, 111
food crops, 50-51, 58, 60, 62, 71-72, 78, 101
Ford, Henry, 26
forest fires, 51, 60, 91, 92
in Alaska, 69
in Canada, 20
in Russia, 9
forests, 15, 18, 24, 27, 28, 45, 47, 51, 59, 67, 69, 88-89, 102, 111. See also forest fires
as carbon sinks, 15, 18, 28, 43, 44, 45
fossil fuels, 15, 18, 29, 32, 39, 42, 44, 79, 87, 88, 91, 95, 96, 108, 131. See also coal, natural gas, oil
Fourier, Jean Baptiste Joseph, 38
France, 19
fresh water, 12, 39, 56, 58-59, 62, 63, 71, 74, 75, 78, 91, 101
frogs, 20
frost-free seasons. See growing seasons
fruit trees, 60
fuel cells. See hydrogen fuel cells
Fukushima, 87
Ganges River, 55
gas. See gasoline, methane, natural gas
gasoline, 39, 80, 88, 94. See also oil
General Circulation Models (GCMs), 65-66, 101, 131
General Electric, 92-93
geothermal energy, 79, 95, 96-98, 110, 131
Germany, 95-96, 100
glacial lakes, 56, 58
glaciers, 12, 20, 21, 25, 38, 39, 56, 58, 64, 101
glass, 29
Glen Canyon Dam, 13
Global Temperature Record (graph), 10
global warming
adaptation to, 91-92
and human activity, 11, 22-23, 34-35
and ozone, 41
and smog, 39
and tropical storms, 9, 49
caused by natural forces, 22, 24
definition of, 131
overall effect on humans, 77
rapid rate of, 11
technological solu-tions to, 98, 101
grapes, 59
grasshoppers, 51
Great Barrier Reef, 72. See also coral reefs
Great Britain, 19, 20, 70, 76, 93, 107
Greenhouse Effect, 34-37, 38, 131
greenhouse gases, 10, 34-35, 36, 49. See also carbon dioxide, CFCs, methane,
nitrous oxide, ozone, water vapor
emissions, 65, 67, 70, 78, 84, 85, 86, 87, 89, 91, 93, 94, 97, 103, 131
Kyoto Protocol, 112-13
Greenland, 12, 56, 68, 77
Greenpeace, 106-107
groundwater, 21, 39, 40
growing seasons, 21, 27, 59, 69, 72
Gulf Stream, 36-37, 38, 68-70
habitats, shifting, 60-61, 64
Hadley Centre, 76
heat waves, 9, 48, 62, 91
2003 in Europe, 48, 76
Himalayas, 12, 55, 109
hippos, 25
Hoover Dam, 13
Hudson Bay, 20, 74
humans, 61-62, 66-67. See also population
history of, 25-32
overall effect of global warming on, 73, 77
hurricanes, 20, 49, 131. See also tropical storms
Katrina, 9
hybrid cars. See cars
hydrocarbons, 18
hydrogen, 98, 100
hydrogen fuel cells, 92, 95, 96, 99-101, 111, 131
hydrologic cycle, 34, 38-40, 49, 50, 131
hydro power, 32, 71, 81, 109, 131
ice, 12, 20, 25, 47, 55-57, 68. See also
albedo, glaciers, sea ice, West Antarctic Ice Sheet
ice ages, 10, 11, 25, 131
icebergs, 17
ice caps, 38, 40, 56, 70, 74
ice cores, 15, 16, 46, 101
Iceland, 12, 72, 96-98, 110
Iceman, 57
IEA. See International Energy Agency
India, 19, 83, 107, 112
Indonesia, 27, 94
Industrial Revolution, 14, 26, 29, 131
insects, 51, 60, 73. See also beetles, mosquitoes
insurance companies, 65
Intergovernmental Panel on Climate Change (IPCC), 10, 13, 68, 73, 76, 77, 122, 124, 131, 133
International Energy Agency (IEA), 85, 86, 121-22
Ireland, 38
iron, 29
Italy, 57, 87
James Bay, 38
Japan, 19, 30, 85, 87, 101, 102
jet effluent trails, 107
jet stream, 131
Kangerdlugssuaq Glacier, 120
Katrina (hurricane), 9
Kyoto Protocol, 112-13
Labrador, 70
Lake Mead, 13
Lake Powell, 13
landfills, 34
Latin America. See Central America, South America
lead, 29
leaf pores, 17
lightbulbs, 107-108, 109
limestone, 42, 43
livestock, 60
London, 39, 105, 110
Lovelock, James, 46
Los Angeles, 9
Maathai, Wangari, 111
Madison, 105
Maine, 110
malaria, 73. See also mosquitoes
Malaysia, 94
mammoths, 25, 57
Manhattan, 11, 55
marine ecosystems, 61. See also coral reefs
Mediterranean, 63, 71, 72
methane, 10, 34-35, 58, 110
Michigan, 100
migration, 14, 60-63, 72, 73, 91
Mississippi River, 74, 110
Mobility Weeks, 105
mold, 48, 51
Mongolia, 111
monsoons, 131. See also hurricanes, tropical storms
mosquitoes, 14, 58, 73
mountain regions, 12, 14, 40, 55, 58-59, 61, 71
mummies, 57
natural gas, 18, 28, 34, 45, 81, 106. See also fossil fuels
Nepal, 21
Nevada, 98
New Jersey, 100
New Orleans, 9
New York City, 55
New Zealand, 27, 70
Nile River, 75
nitrogen, 34
nitrous oxide, 35
North America, 13, 25, 27, 29, 30, 36, 51, 52, 71, 72, 73, 96, 104
northern hemisphere, 12, 21, 68
Northwest Passage, 74
nuclear energy, 32, 81, 86, 87
oaks, 51
oats, 69
oceans, 24, 36, 40, 41, 99. See also coral reefs, plankton, sea ice, sea levels, thermohaline circulation
as carbon sinks, 43-45
currents, 36-38, 46, 56, 68-70
warming, 13-14, 49, 52-55
oil, 18, 26, 30, 45, 56, 80, 81, 88, 93, 94, 95, 96. See also fossil fuels
Oregon, 94
Orlando, 100
oxygen, 34, 41, 43
ozone, 35, 41
Pacific Ocean, 37, 49, 70, 75
Pakistan, 9
Paris, 105
Pennsylvania, 26
Pentagon, 62
permafrost, 10, 57-58, 69, 77, 131. See also tundra
Perth, 21, 95
Peru, 74
Philadelphia, 110
Philippines, 27
pines, 51, 74
plankton, 41, 43, 54, 123
plants, 47, 50-51, 59-60. See also food crops
shifting ranges, 14, 59-60, 71-72
plastics, 29, 80
polar bears, 12, 25, 61, 74
polar regions, 12, 14, 38, 47, 55, 61, 67
pollen, 17, 48
pollution, water, 12-13, 55
population, 26, 27, 31, 32, 35, 50, 54, 62, 67, 81
World Population Then and Now (chart), 31
potatoes, 60
poverty line, 84
precipitation, 33, 47, 48, 50, 52, 56-57, 58, 71, 72, 75
predation, 60
Prince Edward Island, 96
proxy evidence, 16-17, 46
public transit, 93, 104, 105, 109
Quelccaya Ice Cap, 74
railroads, 101, 104, 109
rainfall. See precipitation
rainforests. See forests
rats, 60
renewable energy, 79, 80, 81, 86-87, 92, 94, 95-98, 109,
132. See also
biomass, geothermal energy, solar energy, tidal energy, wind energy
rice, 34-35, 60
rock carvings, 17
Russia, 9, 27, 87. See also Siberia
Rwanda, 71
Sacramento, 100
Sahara, 17
salmon, 53
Samoa, 21
Saskatchewan, 99
Scandinavia, 63, 65, 72
Science and Development Network, 133
Scotland, 95, 110
sea ice, 12, 56, 61
sea levels, 14, 25, 38, 50, 54-55, 68, 70, 73, 74, 91, 110
sea sediments, 7
sequestration. See carbon sequestration
Shell Oil, 98
Shetland Isles, 96
shipping lanes, 56
Siberia, 10, 57
smog, 29, 30, 88, 105
snow, 47, 56, 68
soil, 59
solar activity, 22, 24, 33, 39, 66, 80
solar energy, 79, 86, 92, 95, 98, 105, 107, 109, 110
South America, 27, 72
southern hemisphere, 12
Southwest (US), 13
soybeans, 41, 51, 59, 89
Spain, 95, 100
Spanish flu, 57
spider mites, 51
sports utility vehicles. See SUVs
steam engine, 16, 26, 28. See also Industrial Revolution
steel, 29
Stockholm, 96
Stop Esso Day, 107
storms, 60, 62. See also tropical storms
stratosphere, 41, 133
suburbs, 31, 84
Sumeria, 17
sun. See solar activity
SUVs, 84, 107
Sweden, 19
Taipei, 111
technological solutions to global warming, 98, 101
Teilhard de Chardin, Pierre, 33
THC. See thermohaline circulation
temperatures, 33, 40, 46, 47
and carbon dioxide, 15, 16, 38
and sex determination, 61
during last ice age, 11
Global Temperature Record (graph), 10
measuring, 16
rising, 11, 46, 67-68
Warmest Years on Record (chart), 11, 68
Thailand, 27, 94
thermohaline circulation (THC), 36-38, 132
map, 37
Thoreau, Henry David, v
tidal energy, 96
tin, 29
Titusville, 26
tomatoes, 59
Toronto, 100
Trans Alaska Pipeline, 69
tree rings, 17
tropical storms, 9, 48, 49. See also cyclones, hurricanes, typhoons
troposphere, 41, 133
tundra, 34, 58, 132. See also permafrost
turtles, 61
Tuvalu, 70
typhoons, 130. See also hurricanes, tropical storms
Uganda, 72
ultraviolet radiation, 41
United Nations Environmental Programme (UNEP), 13, 133
United Nations Framework Convention on Climate Change (UNFCCC), 129
United States, 9, 13, 18-19, 20, 27, 28, 29, 62, 85, 88, 93, 94, 102, 113
Unst, 96
Utah, 98
Vancouver, 100
vegetation belts. See plants
volcanic activity, 22, 24, 43, 66
WAIS. See West Antarctic Ice Sheet
warming. See also global warming, temperatures
human-induced, 14-15
Warmest Years on Record (chart), 11
Warming Around the World (map), 20-21
water. See fresh water, pollution
water vapor, 34, 39, 40, 42
Watt, James, 26, 28
weather, 36, 46, 132
extreme, 48, 91
weather stations, 16
weeds, 59
West Antarctic Ice Sheet (WAIS), 68, 76, 77
Western culture, 82
wilderness corridors, 91
wildlife preserves, 91
wind energy, 65, 79, 80, 86, 88, 95-98, 109, 110, 111
winds, 33, 47, 49
World Glacier Monitoring Service, 12
World Meteorological Organization (WMO), 13
World War II, 28
World Wildlife Fund, 106
Yangtze River, 111
Yellow River, 21
Praise for Climate Change
“If a library can only afford one book on the subject, this title in the Groundwork Guides series is a terrific choice. With its small trim size and Tanaka’s concise and lucid prose, this provides an excellent overview of what is happening and why, and what needs to be done on an individual and global scale.” — Booklist
“This exploration of global warming is clear, concise, and well organized.” — Horn Book
“An excellent addition to science libraries. It is clearly written about a complex issue.” — Resource Links
“Tanaka considers the impact of global warming on the planet today and persuasively argues that the worst is yet to come. Maps and fact boxes break up the text in this compact, highly readable book.”
— School Library Journal
“Clearly written . . . the book serves as a good introduction to the subject and will be useful for students doing projects on climate change . . . Recommended.” — CM Magazine
“Shelley Tanaka provides the cold, hard, well-researched facts in this accessible and valuable guide.” — Brandon Sun
“Each of the . . . well-written and engaging books in this valuable series provides a foundation for understanding an important subject relevant to current world stability and peace . . . Recommended.”
— Library Media Connection
About the Publishers
GROUNDWOOD BOOKS, established in 1978, is dedicated to the production of children’s books for all ages, including fiction, picture books and non-fiction. We publish in Canada, the United States and Latin America. Our books aim to be of the highest possible quality in both language and illustration. Our primary focus has been on works by Canadians, though we sometimes also buy outstanding books from other countries.
Many of our books tell the stories of people whose voices are not always heard in this age of global publishing by media conglomerates. Books by the First Peoples of this hemisphere have always been a special interest, as have those of others who through circumstance have been marginalized and whose contribution to our society is not always visible. Since 1998 we have been publishing works by people of Latin American origin living in the Americas both in English and in Spanish under our Libros Tigrillo imprint.
We believe that by reflecting intensely individual experiences, our books are of universal interest. The fact that our authors are published around the world attests to this and to their quality. Even more important, our books are read and loved by children all over the globe.

